The contribution of fungal spores and bacteria
to regional and global aerosol number and
ice nucleation immersion freezing rates
The MIT Faculty has made this article openly available.
Please share
how this access benefits you. Your story matters.
Citation
Spracklen, D. V., and C. L. Heald. “The Contribution of Fungal
Spores and Bacteria to Regional and Global Aerosol Number and Ice
Nucleation Immersion Freezing Rates.” Atmospheric Chemistry and
Physics 14, no. 17 (2014): 9051–9059.
As Published
http://dx.doi.org/10.5194/acp-14-9051-2014
Publisher
Copernicus GmbH on behalf of the European Geosciences Union
Version
Final published version
Citable link
http://hdl.handle.net/1721.1/90964
Terms of Use
Creative Commons Attribution
www.atmos-chem-phys.net/14/9051/2014/ doi:10.5194/acp-14-9051-2014
© Author(s) 2014. CC Attribution 3.0 License.
The contribution of fungal spores and bacteria to regional and
global aerosol number and ice nucleation immersion freezing rates
D. V. Spracklen1and C. L. Heald2
1School of Earth and Environment, University of Leeds, Leeds, UK
2Department of Civil and Environmental Engineering, Massachusetts Institute of Technology, Cambridge, MA, USA
Correspondence to: D. V. Spracklen (dominick@env.leeds.ac.uk)
Received: 1 November 2013 – Published in Atmos. Chem. Phys. Discuss.: 10 December 2013 Revised: 1 May 2014 – Accepted: 27 July 2014 – Published: 2 September 2014
Abstract. Primary biological aerosol particles (PBAPs) may
play an important role in aerosol–climate interactions, in par-ticular by affecting ice formation in mixed phase clouds. However, the role of PBAPs is poorly understood because the sources and distribution of PBAPs in the atmosphere are not well quantified. Here we include emissions of fungal spores and bacteria in a global aerosol microphysics model and ex-plore their contribution to concentrations of supermicron par-ticle number, cloud condensation nuclei (CCN) and immer-sion freezing rates. Simulated surface annual mean concen-trations of fungal spores are ∼ 2.5 × 10⁴m−3over
continen-tal midlatitudes and 1 × 10⁵m−3over tropical forests.
Sim-ulated surface concentrations of bacteria are 2.5 × 10⁴m−3
over most continental regions and 5 × 10⁴m−3 over grass-lands of central Asia and North America. These simulated surface number concentrations of fungal spores and bacteria are broadly in agreement with the limited available observa-tions. We find that fungal spores and bacteria contribute 8 and 5 % respectively to simulated continental surface mean su-permicron number concentrations, but have very limited im-pact on CCN concentrations, altering regional concentrations by less than 1 %. In agreement with previous global mod-elling studies, we find that fungal spores and bacteria con-tribute very little (3 × 10⁻³%, even when we assume upper limits for ice nucleation activity) to global average immer-sion freezing ice nucleation rates, which are dominated by soot and dust. However, at lower altitudes (400 to 600 hPa), where warmer temperatures mean that soot and dust may not nucleate ice, we find that PBAP controls the immersion freezing ice nucleation rate. This demonstrates that PBAPs can be of regional importance for IN formation, in agreement with case study observations.
1 Introduction
Primary biological aerosol particles (PBAPs) include a wide range of biological particles emitted directly from the bio-sphere including bacteria, viruses, fungal spores, pollen and leaf debris. It has been suggested that PBAPs can make a large contribution to atmospheric aerosol (Jaenicke, 2005), influencing climate through scattering and absorbing radia-tion (the aerosol direct effect) and by altering the properties of clouds (the aerosol indirect effect). However, the impact of PBAPs on climate is poorly constrained. Here we quantify the contribution of fungal spores and bacteria to global and regional aerosol number, cloud condensation nuclei (CCN) and immersion freezing rates.
The number of PBAPs emitted into the atmosphere is thought to be substantial with estimates as large as 1000 Tg a−1 (Jaenicke, 2005). Previous estimates of the global emission of fungal spores vary from 8 to 186 Tg a−1 (Elbert et al., 2007; Heald and Spracklen, 2009; Jacobson and Streets, 2009; Hoose et al., 2010b; Sesartic and Dallafior, 2011; Després et al., 2012). The global emissions of bacteria are even more uncertain, spanning nearly 2 orders of magni-tude from 0.4 to 28.1 Tg a−1(Burrows et al., 2009b; Hoose et
al, 2010b; Jacobson and Streets, 2009; Després et al., 2012). The majority of PBAPs are thought to be emitted at su-permicron sizes (dry diameter > 1 µm), with bacteria having diameter of about 1 µm, fungal spores 2–10 µm and pollen 30 µm (Després et al., 2012). As such, PBAPs may constitute an important fraction of the number concentration of super-micron particles, especially when other supersuper-micron aerosol (e.g. dust and sea spray) are absent (Després et al., 2012). Over the Amazon rainforest, PBAP contributes up to 80 %
9052 D. V. Spracklen and C. L. Heald: Global simulation of fungal spores and bacteria
(Pöschl et al., 2010) of total supermicron number concentra-tions. Huffman et al. (2012) reported that fluorescent biolog-ical aerosol particles (FBAPs) contribute 24 % of supermi-cron number concentrations over the Amazon. Observations over Europe and central Asia show that PBAPs can make up 20–30 % of the number concentration of particles with diam-eter > 0.2 µm (Maser and Jaenicke, 1995; Matthias-Maser et al., 2000), whilst other studies have found a smaller (4 %) contribution of FBAPs to supermicron number over Europe (Huffman et al., 2010). PBAPs can also make sub-stantial contributions to supermicron particle number in the free and upper troposphere. DeLeon-Rodriguez et al. (2013) reported that bacteria can represent 20 % of total particles in the 0.25–1 µm diameter range at ∼ 10 km over the Atlantic Ocean.
PBAPs are typically considered to be efficient CCN (Bauer et al., 2003; Després et al., 2012). The low PBAP number concentrations are likely to limit the contribution of PBAPs to total CCN concentrations in most parts of the atmosphere. However, PBAPs may have a role as giant (> 2 µm) CCN, forming cloud droplets at low supersaturations (Möhler et al., 2007; Després et al., 2012).
PBAPs may also act as ice nuclei (IN) (Möhler et al., 2007; Després et al., 2012; Murray et al., 2012). Detailed aerosol– cloud models have shown that bacteria can alter the prop-erties of clouds if present in sufficiently high number con-centrations (Phillips et al., 2009). Recent atmospheric mea-surements have observed the presence of PBAPs in precipita-tion (Christner et al., 2008) and shown that IN over both the continental US (Pratt et al., 2009) and the Amazon (Prenni et al., 2009) are composed of biological particles. Prenni et al. (2009) measured IN (< 2 µm diameter) with a continu-ous flow diffusion chamber and demonstrated that carbona-ceous material, dominated by biological particles, makes up 16–76 % of IN in the Amazon basin during the wet season. Pratt et al. (2009) found that biological particles comprised
∼33 % of ice-crystal residues (< 1.2 µm diameter) measured at 8 km altitude over the continental United States. Observed correlations between PBAP and IN concentrations during rain events over the continental United States further sug-gest an important role for PBAPs in the hydrological cycle (Huffman et al., 2013; Prenni et al., 2013). In contrast, recent modelling studies have found that PBAPs make little contri-bution to global ice nucleation (Hoose et al., 2010a, b; Sesar-tic et al., 2013). For example, Hoose et al. (2010b) simulated that PBAPs contribute less than 0.6 % to the global average ice nucleation rate. However, these previous global studies have not quantified the regional contribution of PBAPs to ice nucleation which could be higher in areas of biological activity (e.g. over tropical forests) and in warm air masses (e.g. above ∼ −15◦C). Here we use a global aerosol micro-physics model to quantify the contribution of fungal spores and bacteria to regional and global aerosol and ice nucle-ation.
2 Methods
2.1 Model description
We used the modal version of the Global Model of Aerosol Processes (GLOMAP-mode) (Mann et al., 2010) which is an extension to the TOMCAT global 3-D chemical transport model (Chipperfield, 2006). The model is forced by analyses from the European Centre for Medium Range Weather Fore-casts (ECMWF), updated every 6 h and linearly interpolated onto the model time step. We ran the model for the year 2000 (after 3 months of model spin-up) at a horizontal resolution of ∼ 2.8◦×2.8◦with 31 vertical levels between the surface and 10 hPa.
GLOMAP-mode simulates aerosol component mass and number concentration (two-moment modal) in seven log-normal modes: hygroscopic nucleation, Aitken, accumula-tion and coarse modes plus a non-hygroscopic Aitken, ac-cumulation and coarse modes. The aerosol components sim-ulated are sulfate, sea salt, black carbon, particulate organic matter (POM) and dust. GLOMAP includes representations of nucleation, particle growth via coagulation, condensa-tion and cloud processing, wet and dry deposicondensa-tion and in-/below-cloud scavenging. Mann et al. (2012) demonstrated that the modal version of GLOMAP simulates very similar aerosol compared to the sectional version of the same model (Spracklen et al., 2005).
In this work we implemented fungal spore and bacteria emissions into GLOMAP. We used emissions of fungal spores from the empirically optimised scheme of Heald and Spracklen (2009), where emissions are driven by leaf area index (LAI) and atmospheric water vapour concentrations. We apply the fine- and coarse-mode emissions calculated by Heald and Spracklen (2009), assuming that the fine mode emissions are emitted with a diameter of 1.25 µm and the coarse mode emissions are emitted at 6.25 µm. For bacteria emissions we followed Hoose et al. (2010b) which itself is based on Burrows et al. (2009b). Burrows et al. (2009b) used observations of bacteria number con-centration synthesised from the literature (Burrows et al., 2009a) to estimate ecosystem-dependent fluxes. We applied ecosystem-dependent bacteria emission fluxes to match the upper emission estimate in Hoose et al. (2010b): oceans 226 m−2s−1, crops 1578 m−2s−1, forests 187 m−2s−1, grasslands 1811 m−2s−1, shrubs 619 m−2s−1, tundra 579 m−2s−1, and desert/land–ice 52 m−2s−1. We used the
MODIS International Global Biosphere Programme (IGBP) global land cover classification to determine the spatial distribution of different ecosystems. We mapped ecosystem types defined by Burrows et al. (2009a) onto MODIS IGBP land cover classifications, weighting the emission flux by the area fraction of each ecosystem as determined by MODIS. The global average annual mean land-surface bacteria emission flux is 410 m−2s−1in our implementation, which is similar to the 380 m−2s−1 reported by Burrows
et al. (2009a). Note the emission scheme for bacteria does not include a dependence on LAI. We used an emission diameter of 1 µm for bacteria as used by previous studies (Hoose et al., 2010a). We assumed that both bacteria and fungal spores are composed of POM, are hydrophilic on emission (Heald and Spracklen, 2009) and are emitted into the hygroscopic modes. Other global model studies (e.g. Sesartic et al., 2013) have assumed that fungal spores are hydrophobic on emission, with this assumption extending the simulated lifetime of PBAPs.
CCN concentrations were calculated using the simulated aerosol size distribution and the approach of Petters and Krei-denweis (2007). We assign hygroscopicity parameters for sulfate (0.61, assuming ammonium sulfate), sea salt (1.28), black carbon (0.0), and POM (0.1). To calculate the potential contribution of PBAPs to ice nucleation, we quantified the contribution of different aerosol sources (dust, soot, bacteria and fungal spores) to immersion freezing rates: the dominant heterogeneous ice nucleation pathway in mixed-phase clouds (Hoose et al., 2010a). We calculate immersion freezing rates using the parameterisation of Hoose et al. (2010a, b) which is based on classical nucleation theory and laboratory exper-iments. As in Hoose et al. (2010a, b) we assumed that only 0.1 % of fungi and bacteria and 1 % of soot have the poten-tial to be IN active. No upper limit is applied for dust (100 % of particles can act as IN). The potential of PBAPs to nucle-ate ice is uncertain (Murray et al., 2012), so we carried out a sensitivity study where we assumed that all PBAPs can be IN active with no upper limits for IN formation from PBAPs. This simulation matches the PBAP-max simulation in Hoose et al. (2010a, b). We report immersion freezing rates in two ways: all sky and weighted by ice-cloud fraction. We apply monthly mean ice cloud fraction from the International Satel-lite Cloud Climatology Project (ISCCP) D-2 data (Rossow and Schiffer, 1999) for the year 2000.
2.2 PBAP observations
We compared simulated PBAP number concentrations against observations synthesised from the literature. Obser-vations of the number concentration of PBAPs in the atmo-sphere are limited, long-term observations are rare and there are specific measurement issues. For example, many studies report the number of culturable fungi or bacteria, despite the fact that this method only accounts for a fraction of the total number (Burrows et al., 2009a). For bacteria, the fraction of total bacteria which are cultural can be as low as 1 % (Bur-rows et al., 2009a). Furthermore, most observational tech-niques rely on manual counting, a method that is subject to significant operator bias.
We used two previous studies that had synthesised obser-vations of the number concentrations of fungal spores (Sesar-tic and Dallafior, 2011) and bacteria (Burrows et al., 2009a) in surface air. Sesartic and Dallafior (2011) synthesised ob-servations of fungal spores from both culturable and
culture-independent techniques. We report the mean, maximum and minimum of the observations. Burrows et al. (2009a) syn-thesised observations of number concentration of bacteria, applying scaling factors to convert culturable to total bacte-ria concentrations. They give a best estimate as well as upper and lower bounds through which they attempt to account for uncertainty in both culturable bacteria number concentration as well as the ratio of total to culturable bacteria. Both studies report number concentrations as a function of broad ecosys-tem types (forest, shrub, grassland, crop, tundra). We used the IGBP land cover classification from MODIS to sample the model in a similar manner.
To further evaluate fungal spore number concentrations, we synthesised observations of long-term (those with at least a full annual cycle) fungal spore number concentrations from the literature (Ho et al., 2005; Sousa et al., 2009; Grinn-Gofron et al., 2011; Herrero et al., 2006; Lim et al., 1998; Henriquez et al., 2001; Hasnain et al, 2012). Observations are typically made using 7-day spore traps and microscopic identification and counting techniques; these methods are in-herently uncertain and subject to operator error. Observations are available in both hemispheres and are primarily located in urban regions.
3 Results
We compare our calculated global annual mean mass bur-den of fungal spores and bacteria to that previously re-ported using the same PBAP emission schemes. The sim-ulated global annual mean burden of fungal spores calcu-lated here (0.15 Tg) matches that previously reported us-ing GEOS-Chem (0.18 Tg) (Heald and Spracklen, 2009) and CAM-Oslo (0.094 Tg) (Hoose et al., 2010b). The sim-ulated global annual mean burden of bacteria calcsim-ulated here (0.011 Tg) is also similar to previously reported by Burrows et al. (2009b) (0.0087 Tg) and simulated using CAM-Oslo (0.0043 Tg) (Hoose et al., 2010b).
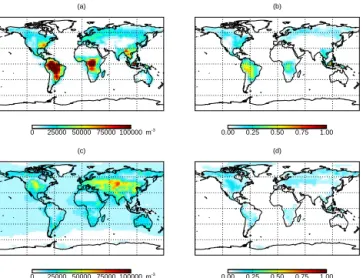
Figure 1 shows simulated surface annual mean number concentrations of fungal spores and bacteria. GLOMAP-mode simulates similar continental surface mean number concentrations for both fungal spores (2.4 × 10⁴m−3) and bacteria (1.9 × 10⁴m−3), but with different spatial patterns. Simulated concentrations of fungal spores are typically 2 × 10⁴m−3 over midlatitude continental regions and exceed 1 × 10⁵m−3 over tropical forests matching the regions of
greatest fungal spore emission (Heald and Spracklen, 2009). Simulated surface concentrations of bacteria are typically 2 × 10⁴m−3 over most continental regions, but are greater over grassland regions of central Asia and North America where concentrations of 5×10⁴m−3are more typical. Simu-lated concentrations of bacteria are lower over tropical forest regions than over other continental regions due to low emis-sion flux assumed for these ecosystems combined with rapid wet deposition. Over oceans, annual mean concentrations of
9054 D. V. Spracklen and C. L. Heald: Global simulation of fungal spores and bacteria (a) 0 25000 50000 75000 100000 m-3 (b) 0.00 0.25 0.50 0.75 1.00 (c) 0 25000 50000 75000 100000 m-3 (d) 0.00 0.25 0.50 0.75 1.00
Figure 1. Simulated surface annual mean (a) fungal spore number
concentrations, (b) fractional contribution of fungal spores to su-permicron surface number, (c) bacteria number concentrations and
(d) fractional contribution of bacteria to supermicron number
con-centrations.
bacteria (7.8 × 10³m−3)are substantially greater than fun-gal spores (1.9 × 10³m−3), since we apply an ocean flux of bacteria but no such flux for fungal spores. The global mean ratio of continental surface number concentration to marine surface number concentration is 2.5 for bacteria and 12 for fungal spores. The magnitude and spatial distribution of our simulated bacteria number concentrations is similar to that simulated by Burrows et al. (2009b).
Figure 2 compares simulated number concentrations of fungal spores and bacteria in surface air against observa-tions (Sesartic and Dallafior, 2011; Burrows et al., 2009a). Both studies report observed number concentration as a func-tion of ecosystem type. We used the MODIS IGBP land cover classification to sample the model in a similar manner to that of the observational studies. Observed fungal spore concentrations are typically ∼ 1 × 10⁴m−3. Fungal spore number concentrations are simulated to within a factor of 3 over shrub, grassland and crop ecosystems. Over forests, the model overpredicts observed concentrations of fungal spores. Limiting the observational data set to culture inde-pendent techniques (Sesartic and Dallafior, 2011) increases observed concentrations by only 40 % on average and is not sufficient to explain the model bias. It is possible that the lin-ear dependence of emission flux on LAI applied by Heald and Spracklen (2009) is too strong, or that the particle size we apply over these ecosystems is too small. Additional ob-servations over tropical ecosystems are required to explore this further.
Bacteria number concentrations simulated by the model reasonably match (within a factor of 2) observed number concentrations over ocean, desert/ice and tundra environ-ments, but are underpredicted by a factor of 2–4 over forests,
Figure 2. Comparison of simulated (solid) and observed (dashed)
surface (a) fungal spore and (b) bacteria number concentrations across different ecosystems. Boxes show minimum, mean and max-imum concentrations. Observed concentrations are a synthesis of fungal spore (Sesartic and Dallafior, 2011) and total bacteria (Bur-rows et al., 2009a) number concentrartions in near-surface air. The observed maximum for shrub and grasslands is 8.4 × 10⁴m−3and extends off the scale. Simulated concentrations are the mean, max-imum and minmax-imum annual mean surface concentrations for that ecosystem type.
grasslands and crops (Fig. 2b). Given that we are employ-ing bacteria emissions from Burrows et al. (2009b) which are based on these observations, good agreement for bacte-ria is expected. Poor understanding of the seasonal cycle in emissions (Burrows et al., 2009a; Hoose et al., 2010b), com-bined with the limited set of observations, precludes a more quantitative comparison.
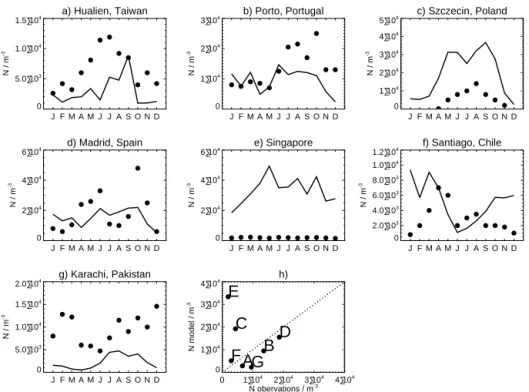
To further evaluate simulated fungal spore number con-centrations we compared against long-term observation of fungal spore number (Fig. 3). The model reasonably captures (within a factor of 2) observed annual mean number concen-trations at some sites (Taiwan, Portugal, Spain and Chile), but overpredicts at other locations (Poland and Singapore). As a mean across all sites, simulated annual mean number con-centrations are biased high (normalised mean bias (NMB)
=52 %), driven by the high model bias for Singapore. De-spite this bias, the model typically captures the observed sea-sonal cycle at Northern Hemisphere (NH) midlatitude sites
a) Hualien, Taiwan J F M A M J J A S O N D 0 5.0•103 1.0•104 1.5•104 N / m -3 b) Porto, Portugal J F M A M J J A S O N D 0 1•104 2•104 3•104 N / m -3 c) Szczecin, Poland J F M A M J J A S O N D 0 1•104 2•104 3•104 4•104 5•104 N / m -3 d) Madrid, Spain J F M A M J J A S O N D 0 2•104 4•104 6•104 N / m -3 e) Singapore J F M A M J J A S O N D 0 2•104 4•104 6•104 N / m -3 f) Santiago, Chile J F M A M J J A S O N D 0 2.0•103 4.0•103 6.0•103 8.0•103 1.0•104 1.2•104 N / m -3 g) Karachi, Pakistan J F M A M J J A S O N D 0 5.0•103 1.0•104 1.5•104 2.0•104 N / m -3 h) 0 1•104 2•104 3•104 4•104 N obervations / m-3 0 1•104 2•104 3•104 4•104 N model / m -3
A
B
C
D
E
F G
Figure 3. Evaluation of simulated fungal spore number concentrations. (a–g) Comparison of observed (circles) and simulated (black
lines) monthly mean concentrations. (h) Comparison of simulated and observed annual mean concentrations. Observations are from Ho et al. (2005), Sousa et al. (2009), Grinn-Gofron et al. (2011), Herrero et al. (2006), Lim et al. (1998), Henriquez et al. (2001), and Hasnain et al. (2012).
with greater number concentrations during the summer as ob-served (Tong and Lighthart, 2000; Yttri et al., 2011; Bowers et al., 2013).
We calculated the simulated contribution of fungal spores and bacteria to total supermicron number concen-trations. Previous model evaluations have demonstrated that GLOMAP reasonably simulates the mass and number con-centrations of dust (Manktelow et al., 2010) and sea spray (Mann et al., 2012), giving us confidence in the distribu-tion of other supermicron particle sources. Fungal spores are simulated to contribute 8 % of annual mean continental sur-face supermicron number concentrations. The contribution is typically ∼ 25 % over much of the continental NH mid-latitudes matching observed contributions in these regions (Matthias-Maser and Jaenicke, 1995; Matthias-Maser et al., 2000). Over tropical forest regions we simulate that fungal spores contribute up to 50 % of supermicron number concen-trations (Fig. 1b), similar to the large observed contribution (Pöschl et al., 2010; Huffman et al., 2012). Bacteria have a smaller simulated contribution to surface supermicron num-ber concentrations, contributing 5 % to continental mean su-permicron number concentrations, with a maximum contri-bution of 25 % over parts of North America, boreal Asia and southern Africa (Fig. 1d). Over the oceans, where sea spray dominates supermicron aerosol number and the PBAP emis-sion flux is smaller, the contribution of PBAPs is small
(sur-face ocean mean of 0.4 % for fungal spores and 1 % for bac-teria).
Figure 4 shows simulated zonal annual mean number con-centrations of fungal spores and bacteria, exhibiting similar patterns to previous studies (Hoose et al., 2010b; Sesartic et al., 2013). Hoose et al. (2010a, b) apply a similar mass emis-sion of fungal spores compared to our study but assume a larger emission diameter (they emit all spores at 5 µm), ex-plaining the greater number concentrations we simulate both at the surface and aloft. We also simulate greater number con-centration of fungal spores compared to Sesartic et al. (2013), at least partly due to the greater emission flux we apply in our study. Our simulated zonal annual mean number concentra-tions of fungal spores and bacteria are greatest in the lower troposphere (number concentrations up to 1 × 10⁴m−3) de-creasing to about 100 m−3 at 400 hPa. Number concentra-tions of soot and dust are substantially larger, with annual zonal mean soot and dust number concentrations as large as 1000 and 1 cm−3respectively in the NH lower troposphere.
The low number concentrations of PBAPs in comparison to other aerosol types means that both fungal spores and bacteria have little impact on global CCN concentrations. In our simulations, bacteria increase global mean surface CCN concentrations (0.2 % supersaturation) by 0.01 %. Includ-ing fungal spores in the model reduces global mean surface CCN concentrations very slightly (by 0.001 %) through a marginal suppression of nucleation. Regionally, both bacteria
9056 D. V. Spracklen and C. L. Heald: Global simulation of fungal spores and bacteria
(a) Fungal spore [cm-3]
-50 0 50 latitude 1000 800 600 400 200 pressure / hPa 10-6 10 -5 10-5 10 -4 10 -3
(b) Fungal spore immersion freezing [cm-3 s-1]; 1.4e-05%
-50 0 50 latitude 1000 800 600 400 200 pressure / hPa 10-14 10-14 10-12 (c) Bacteria [cm-3] -50 0 50 latitude 1000 800 600 400 200 pressure / hPa 10-6 10 -5 10-4 10 -3 10-2
(d) Bacteria immersion freezing [cm-3 s-1] 3.1e-06%
-50 0 50 latitude 1000 800 600 400 200 pressure / hPa 10-14 10 -14 10-12 (e) Soot [cm-3 ] -50 0 50 latitude 1000 800 600 400 200 pressure / hPa 0.1 1.0 5.0 5.0 10.0 50.0
(f) Soot immersion freezing [cm-3
s-1 ]; 3.6% -50 0 50 latitude 1000 800 600 400 200 pressure / hPa 10-14 10-12 10-10 10-10 10-10 10-10 10 -8 10-8 10-6 (g) Dust [cm-3 ] -50 0 50 latitude 1000 800 600 400 200 pressure / hPa 0.01 0.10 0.10
(h) Dust immersion freezing [cm-3
s-1 ]; 96.4% -50 0 50 latitude 1000 800 600 400 200 pressure / hPa 10 -1210-10 10-8 10 -8 10-6 10-6
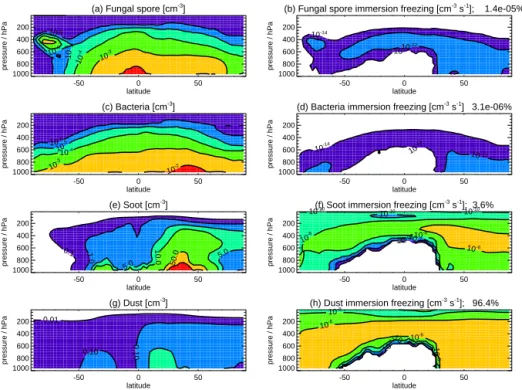
Figure 4. Zonal annual mean number concentrations for (a) fungal spores, (c) bacteria, (e) soot, (g) dust and all-sky immersion freezing
rates for (b) fungal spores, (d) bacteria, (f) soot and (h) dust. Note (e) and (g) have a different colour scale to (a) and (c). Numbers above panel show percentage contribution to annual mean all-sky freezing rate. Weighting by ice-cloud fraction does not greatly change fractional contribution (see text).
and fungal spores alter CCN concentrations by less than 1 % even over tropical forest regions.
Figure 4 shows zonal annual mean all-sky immersion freezing rates for fungal spores, bacteria, soot and dust. We find that global immersion freezing rates are dominated by dust (96.4 %) and soot (3.6 %) with PBAPs contributing only 1.4 × 10⁻⁵%. When we calculate immersion freezing rates weighted by ice-cloud fraction, global annual mean rates are still dominated by dust (97.2 %) with smaller contributions from soot (2.8 %), fungal spores (8.1 × 10⁻⁶%) and bacteria
(1.3×10⁻⁶%). Hoose et al. (2010a, b) also calculated a
mini-mal contribution from PBAPs (1.2×10⁻⁵%) with large con-tributions from dust (87.6 %) and soot (12.4 %). The lower contribution from soot in our study is due to the lower abso-lute number concentrations of soot that we simulate. We sim-ulate a larger all-sky contribution from PBAPs (3 × 10⁻³%) under the upper limit for IN formation from PBAPs, but global rates are still dominated by dust and soot.
Our simulated spatial pattern of immersion freezing rates is similar to that from previous studies (e.g. Hoose et al., 2010b). Bacteria and fungal spore immersion freezing rates are greatest in the lower troposphere at high latitudes and 400 to 600 hPa in the tropics. Immersion freezing rates of soot and dust are maximum at higher altitudes, being greatest at 400 to 600 hPa at high latitudes and 400 to 200 hPa in the tropics. Above 400 hPa, immersion freezing rates of soot and dust are as large as 1×10⁻⁶cm−3s−1, several orders of
mag-nitude greater than immersion freezing rates of either fungal spore or bacteria (1 × 10⁻¹⁴cm−3s−1). However, at lower altitudes simulated immersion freezing rates of PBAPs, dust and soot are more comparable. Between 400 and 600 hPa, simulated freezing rates of fungal spores and bacteria are as great as 1 × 10⁻¹²cm−3s−1, greater than the freezing rates of soot or dust at these altitudes. Dust and soot are known to be important IN at temperatures below about −15◦C, but their ability to nucleate ice at warmer temperatures is unclear (Murray et al., 2012).
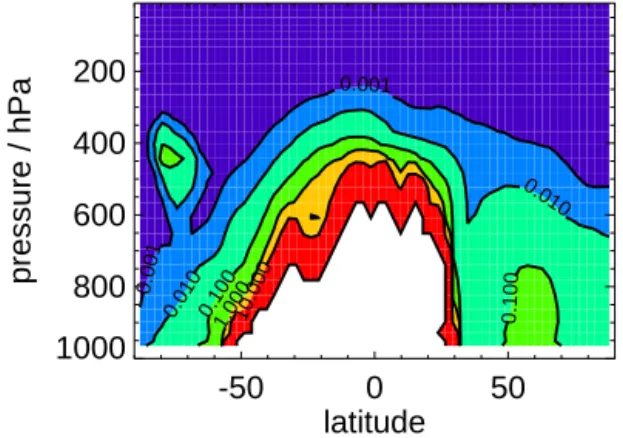
Figure 5 shows the contribution of PBAPs (bacteria and fungal spores) to total all-sky zonal annual mean immersion freezing rates. Above 400 hPa, PBAPs contribute less than 0.001 % to zonal annual mean immersion freezing rates. At warmer temperatures, PBAPs can make an important contri-bution to zonal annual mean freezing rates with contricontri-bution to total freezing rates reaching 100 %.
To examine this behaviour in more detail, Fig. 6 shows the contribution of PBAPs to immersion freezing rates at 260 and 263 K in July 2000. Freezing rates are weighted by ice-cloud fraction. At 263 K, PBAP contributes ∼ 20–100 % of total immersion freezing rates over most continental regions, with lower contribution over most oceanic regions. At 260 K, PBAP contributes typically 1–10 % to total immersion freez-ing rates. We note that very small immersion freezfreez-ing rates at warmer temperatures may have limited atmospheric impacts.
-50 0 50 latitude 1000 800 600 400 200 pressure / hPa 0.001 0.001 0.010 0.010 0.100 0.1001.00010.000
Figure 5. Percentage contribution of PBAPs (bacteria and fungal
spores) to zonal annual mean all-sky immersion freezing rates. Values are for the upper limit contribution of PBAPs to immer-sion freezing (see text). White colour shows where total immerimmer-sion freezing rate is less than 1 × 10⁻¹⁴cm−3s−1.
4 Discussion and conclusions
We have explored the contribution of fungal spores and bac-teria to global aerosol number concentrations. We included existing emission schemes for fungal spores and bacteria in a global aerosol microphysics model. Simulated surface num-ber concentrations of fungal spores and bacteria were typi-cally 2 × 10⁴m−3over many continental regions. Simulated number concentrations reasonably matched (typically within a factor of 2) available observations, although the model overpredicts fungal spore concentrations over forest ecosys-tems and underpredicts bacteria number concentrations over grass, shrub and crop ecosystems. A more detailed evalu-ation of the model is not possible because observevalu-ations of fungal spore and bacteria number are limited, are subject to methodological issues and rely on counting techniques with inherent operator error. Long-term observations (longer than a few weeks) of PBAP number are particularly scarce. New methods employing laser-induced fluorescence to identify and count biological particles (e.g. Gabey et al., 2010, 2011; Huffman et al., 2010) may offer new opportunities to evalu-ate model predictions. We note that existing PBAP emission schemes have not been designed to adequately represent sea-sonal and interannual variability.
We found that fungal spores and bacteria contributed 8 and 5 % respectively to global continental mean supermi-cron number concentrations. Regionally, the contribution was greater with fungal spores contributing 25 % of super-micron number concentration over many continental midlat-itude regions and up to 50 % over tropical forests. The low number concentrations of fungal spores and bacteria com-pared to other aerosol types result in a limited contribu-tion (< 1 %) of PBAPs to regional CCN concentracontribu-tions. It is important to note that PBAPs may be able to act as giant
(a)
0.10 1.00 10.00 100.00 %
(b)
0.10 1.00 10.00 100.00 %
Figure 6. Percentage of immersion freezing simulated to be due
to PBAPs (bacteria and fungal spores) in July 2000 at (a) 260 K and (b) 263 K. Values are for the upper limit contribution of PBAPs to immersion freezing and are weighted by ice cloud fraction (see text).
(> 2 µm) CCN (Möhler et al., 2007), something that we did not study here.
We used an existing parameterisation of immersion freez-ing rates (Hoose et al., 2010a, b) in combination with our simulated aerosol number to quantify the contribution of PBAPs to ice nucleation. We found that fungal spores and bacteria contribute less than 3 × 10⁻³% to global all-sky im-mersion freezing rates, matching recent global model stud-ies that find PBAPs to be unimportant as a source of IN at the global scale (Hoose et al., 2010a, b). We find a similarly small contribution of PBAPs to global immersion freezing rates when we weighted freezing rates by ice cloud frac-tion. Although PBAP has little impact on global immer-sion freezing rates, we found PBAPs may be important at altitudes between 400 and 600 hPa, where warm tempera-tures (> −15◦C) inhibit the formation of ice from soot and
dust. At these altitudes, PBAPs dominate immersion freezing rates in our simulations, matching case study observations that recorded a large contribution of PBAP to IN formation (Christner et al., 2008; Pratt et al., 2009; Prenni et al., 2009). Whilst we acknowledge that the IN activity of fungal spores and bacteria is uncertain (Murray et al., 2012; Hoose and Möhler, 2012), our study suggests that there are regions of the atmosphere where biological particles contribute sub-stantially to small ice nucleation rates, motivating additional research on the role of PBAPs as IN. Furthermore, recent studies have suggested that PBAP emissions are related to rainfall and relative humidity (Huffman et al., 2013; Schu-macher et al., 2013; Prenni et al., 2013) creating daily vari-ability in emissions not accounted for here and potentially leading to tighter coupling between PBAP emissions and cli-mate.
Acknowledgements. This work was supported by the Natural Environment Research Council (NE/G015015/1) and by the U.S. National Science Foundation (AGS-1238109).
9058 D. V. Spracklen and C. L. Heald: Global simulation of fungal spores and bacteria References
Bauer, H., Giebl, H., Hitzenberger, R., Kasper-Giebl, A., Reis-chl, G., Zibuschka, F., and Puxbaum, H.: Airborne bacteria as cloud condensation nuclei, J. Geophys. Res., 108, 4658, doi:10.1029/2003JD003545, 2003.
Bowers, R. M., Clements, N., Emerson, J. B., Wiedinmyer, C., Han-nigan, M. P., and Fierer, N.: Seasonal variability in bacterial and fungal diversity of the near surface atmosphere, Environ. Sc. Technol., 47, 12097–12106, 2013.
Burrows, S. M., Elbert, W., Lawrence, M. G., and Pöschl, U.: Bac-teria in the global atmosphere – Part 1: Review and synthesis of literature data for different ecosystems, Atmos. Chem. Phys., 9, 9263–9280, doi:10.5194/acp-9-9263-2009, 2009a.
Burrows, S. M., Butler, T., Jöckel, P., Tost, H., Kerkweg, A., Pöschl, U., and Lawrence, M. G.: Bacteria in the global at-mosphere – Part 2: Modeling of emissions and transport be-tween different ecosystems, Atmos. Chem. Phys., 9, 9281-9297, doi:10.5194/acp-9-9281-2009, 2009b.
Chipperfield, M. P.: New version of the TOMCAT/SLIMCAT off-line chemical transport model,Intercomparison of stratospheric tracer experiments, Q. J. R. Meteorolo. Soc., 132, 1179–1203, 2006.
Christner, B. C., Morris, C. E., Foreman, C. M., Cai, R. M., and Sands, D. C.: Ubiquity of biological ice nucleators in snowfall, Science, 319, 1214–1214, doi:10.1126/science.1149757, 2008. DeLeon-Rodriguez, N., Lathem, T. L., Rodriguez-R, L. M.,
Barazesh, J. M., Anderson, B. E., Beyersdorf, A. J., Ziemba, L. D., Bergin, M., Nenes, A., and Konstantinidis, K. T.: Microbiome of the upper troposphere: Species composition and prevalence, effects of tropical storms, and atmospheric implications, P. Natl. Acad. Sci. USA, 110, 2575–2580 doi:10.1073/pnas.1212089110, 2013.
Després, V. R., Huffman, J. A., Burrows, S. M., Hoose, C., Safa-tov, A. S., Buryak, G., Fröhlich-Nowoisky, J., Elbert, W., An-dreae, M. O., Pöschl, U., and Jaenicke, R.: Primary biological aerosol particles in the atmosphere: a review, Tellus, 64B, 15598, doi:10.3402/tellusb.v64i0.15598, 2012.
Elbert, W., Taylor, P. E., Andreae, M. O., and Pöschl, U.: Contribu-tion of fungi to primary biogenic aerosols in the atmosphere: wet and dry discharged spores, carbohydrates, and inorganic ions, At-mos. Chem. Phys., 7, 4569–4588, doi:10.5194/acp-7-4569-2007, 2007.
Gabey, A. M., Gallagher, M. W., Whitehead, J., Dorsey, J. R., Kaye, P. H., and Stanley, W. R.: Measurements and comparison of pri-mary biological aerosol above and below a tropical forest canopy using a dual channel fluorescence spectrometer, Atmos. Chem. Phys., 10, 4453–4466, doi:10.5194/acp-10-4453-2010, 2010. Gabey, A. M., Stanley, W. R., Gallagher, M. W., and Kaye, P. H.:
The fluorescence properties of aerosol larger than 0.8 µm in ur-ban and tropical rainforest locations, Atmos. Chem. Phys., 11, 5491–5504, doi:10.5194/acp-11-5491-2011, 2011.
Grinn-Gofron, A., Strzelczak, A., and Wolski, T.: The relationship between air pollutants, meteorological parameters and concen-tration of airborne fungal spores, Environ. Pollut., 159, 602–608, 2011.
Hasnain, S. M., Akhter, T., and Waqarm, M. A.: Airborne and aller-genic fungal spores of the Karachi environment and their corre-lation with meteorological factors, J. Environ. Monit., 14 , 1006– 1013, 2012.
Heald, C. L. and Spracklen, D. V.: Atmospheric budget of primary biological aerosol particles from fungal spores, Geophys. Res. Lett., 36, L09806, doi:10.1029/2009GL037493, 2009.
Henríquez, V. I., Villegas, G. R. and Nolla, J. M. R.: Airborne fungi monitoring in Santiago, Chile, Aerobiologia, 17, 137–142, 2001. Herrero, A. D., Ruiz, S. S., Bustillo, M. G., and Morales, P. C.: Study of airborne fungal spores in Madrid, Spain, Aerobiologia, 22, 135–142, 2006.
Ho, H. M., Rao, C. Y., Hsu, H. H., Chiu, Y. H., Liu, C. M., and Chao, H. J.: Characteristics and determinants of ambient fun-gal spores in Hualien, Taiwan, Atmos. Environ., 39, 5839–50, doi:10.1016/j.atmosenv.2005.06.034, 2005.
Hoose, C. and Möhler, O.: Heterogeneous ice nucleation on atmo-spheric aerosols: a review of results from laboratory experiments, Atmos. Chem. Phys., 12, 9817–9854, doi:10.5194/acp-12-9817-2012, 2012.
Hoose, C., Kristjánsson, J. E., and Burrows, S. M.: How important is biological ice nucleation in clouds on a global scale?, Envi-ron. Res. Lett., 5, 024009, doi:10.1088/1748-9326/5/2/024009, 2010a.
Hoose, C., Kristjánsson, J. E., Chen, J.-P., and Harza, A. A.: classical-theory-based parameterization of heterogeneous ice nu-cleation by mineral dust, soot, and biological particles in a global climate model, J. Atmos. Sci., 67, 2483–2503, 2010b.
Huffman, J. A., Treutlein, B., and Pöschl, U.: Fluorescent bi-ological aerosol particle concentrations and size distributions measured with an Ultraviolet Aerodynamic Particle Sizer (UV-APS) in Central Europe, Atmos. Chem. Phys., 10, 3215–3233, doi:10.5194/acp-10-3215-2010, 2010.
Huffman, J. A., Sinha, B., Garland, R. M., Snee-Pollmann, A., Gunthe, S. S., Artaxo, P., Martin, S. T., Andreae, M. O., and Pöschl, U.: Size distributions and temporal variations of bio-logical aerosol particles in the Amazon rainforest characterized by microscopy and real-time UV-APS fluorescence techniques during AMAZE-08, Atmos. Chem. Phys., 12, 11997–12019, doi:10.5194/acp-12-11997-2012, 2012.
Huffman, J. A., Prenni, A. J., DeMott, P. J., Pöhlker, C., Mason, R. H., Robinson, N. H., Fröhlich-Nowoisky, J., Tobo, Y., Després, V. R., Garcia, E., Gochis, D. J., Harris, E., Müller-Germann, I., Ruzene, C., Schmer, B., Sinha, B., Day, D. A., Andreae, M. O., Jimenez, J. L., Gallagher, M., Kreidenweis, S. M., Bertram, A. K., and Pöschl, U.: High concentrations of biological aerosol par-ticles and ice nuclei during and after rain, Atmos. Chem. Phys., 13, 6151–6164, doi:10.5194/acp-13-6151-2013, 2013.
Jaenicke, R.: Abundance of cellular material and proteins in the at-mosphere, Science, 308, 73, 2005.
Jacobson, M. Z. and Streets, D. G.: Influence of future anthro-pogenic emissions on climate, natural emissions and air qual-ity, J. Geophys. Res., 114, D08118, doi:10.1029/2008JD011476, 2009.
Lim, S. H., Chew, F. T., Dali, S. D. B. M., Tan, T. W., Lee, B. W., and Tan, T. K.: Outdoor airborne fungal spores in Singapore, Grana, 37 (4), 246–252, 1998.
Manktelow, P. T., Carslaw, K. S., Mann, G. W., and Spracklen, D. V.: The impact of dust on sulfate aerosol, CN and CCN during an East Asian dust storm, Atmos. Chem. Phys., 10, 365–382, doi:10.5194/acp-10-365-2010, 2010.
Mann, G. W., Carslaw, K. S., Spracklen, D. V., Ridley, D. A., Manktelow, P. T., Chipperfield, M. P., Pickering, S. J., and
Johnson, C. E.: Description and evaluation of GLOMAP-mode: a modal global aerosol microphysics model for the UKCA composition-climate model, Geosci. Model Dev., 3, 519–551, doi:10.5194/gmd-3-519-2010, 2010.
Mann, G. W., Carslaw, K. S., Ridley, D. A., Spracklen, D. V., Pringle, K. J., Merikanto, J., Korhonen, H., Schwarz, J. P., Lee, L. A., Manktelow, P. T., Woodhouse, M. T., Schmidt, A., Brei-der, T. J., Emmerson, K. M., Reddington, C. L., Chipperfield, M. P., and Pickering, S. J.: Intercomparison of modal and sectional aerosol microphysics representations within the same 3-D global chemical transport model, Atmos. Chem. Phys., 12, 4449–4476, doi:10.5194/acp-12-4449-2012, 2012.
Matthias-Maser, S. and Jaenicke, R.: The size distribution of pri-mary biological aerosol particles with radii > 0.2 µm in an urban rural influenced region, Atmos. Res., 39, 279–286, 1995. Matthias-Maser, S., Obolkin, V., Khodzer, T., and Jaenicke, R.:
Sea-sonal variation of primary biological aerosol particles in the re-mote continental region of Lake Baikal/Siberia, Atmos. Environ., 34, 3805–3811, 2000.
Möhler, O., DeMott, P. J., Vali, G., and Levin, Z.: Microbiology and atmospheric processes: the role of biological particles in cloud physics, Biogeosciences, 4, 1059–1071, doi:10.5194/bg-4-1059-2007, 2007.
Murray, B. J., O’Sullivan, D., Atkinson, J. D., and Webb, M. E.: Ice nucleation by particles immersed in supercooled cloud droplets, Chem. Soc. Rev., 41, 6519–6554, 2012.
Petters, M. D. and Kreidenweis, S. M.: A single parameter repre-sentation of hygroscopic growth and cloud condensation nucleus activity, Atmos. Chem. Phys., 7, 1961–1971, doi:10.5194/acp-7-1961-2007, 2007.
Phillips, V. T. J., Andronache, C., Christner, B., Morris, C. E., Sands, D. C., Bansemer, A., Lauer, A., McNaughton, C., and Se-man, C.: Potential impacts from biological aerosols on ensembles of continental clouds simulated numerically, Biogeosciences, 6, 987–1014, doi:10.5194/bg-6-987-2009, 2009.
Pöschl, U., Martin, S. T., Sinha, B., Chen, Q., Gunthe, S. S., Huffman, J. A., Borrmann, S., Farmer, D. K., Garland, R. M., Helas, G., Jimenez, J. L., King, S. M., Manzi, A., Mikhailov, E., Pauliquevis, T., Petters, M. D., Prenni, A. J., Roldin, P., Rose, D., Schneider, J., Su, H., Zorn, S. R., Artaxo, P., Andreae, M. O.: Rainforest aerosols as biogenic nuclei of cloud and precipitation in the Amazon, Science, 329, 1513, doi:10.1126/science.1191056, 2010.
Pratt, K. A., DeMott, P. J., French, J. R., Wang, Z., Westphal, D. L., Heymsfield, A. J., Twohy, C. H., Prenni, A. J., and Prather, K. A.: In situ detection of biological particles in cloud ice-crystals, Nat. Geosci., 2, 398–401, 2009.
Prenni, A. J., Petters, M. D., Kreidenweis, S. M., Heald, C. L., Mar-tin, S. T., Artaxo, P., Garland, R. M., Wollny, A. G., and Pöschl, U.: Relative roles of biogenic emissions and Saharan dust as ice nuclei in the Amazon basin, Nat. Geosci., 2, 402–5, 2009. Prenni, A. J., Tobo, Y., Garcia, E., DeMott, P. J., Huffman, J. A.,
McCluskey, C. S., Kreidenweis, S. M., Prenni, J. E., Pöhlker, C., and Pöschl, U.: The impact of rain on ice nuclei populations at a forested site in Colorado, Geophys. Res. Lett., 40, 227–231, doi:10.1029/2012GL053953, 2013.
Rossow, W. B. and Schiffer, R. A.: Advances in Understanding Clouds from ISCCP, B. Am. Meteorol. Soc., 80, 2261–2287, 1999.
Schumacher, C. J., Pöhlker, C., Aalto, P., Hiltunen, V., Petäjä, T., Kulmala, M., Pöschl, U., and Huffman, J. A.: Seasonal cycles of fluorescent biological aerosol particles in boreal and semi-arid forests of Finland and Colorado, Atmos. Chem. Phys., 13, 11987–12001, doi:10.5194/acp-13-11987-2013, 2013.
Sesartic, A. and Dallafior, T. N.: Global fungal spore emissions, re-view and synthesis of literature data, Biogeosciences, 8, 1181– 1192, doi:10.5194/bg-8-1181-2011, 2011.
Sesartic, A., Lohmann, U., and Storelvmo, T.: Modelling the impact of fungal spore ice nuclei on clouds and precipitation, Environ. Res. Lett., 8, 014029, doi:10.1088/1748-9326/8/1/014029, 2013. Sousa, S. I. V., Martins, F. G., Pereira, M. C., Alvim-Ferraz, M. C. M., Ribeiro, H., Oliveira, M., Abreu, I.: Influence of atmospheric ozone, PM10 and meteorological factors on the concentration of airborne pollen and fungal spore, Atmos. Environ., 43, 2228– 2228, doi:10.1016/j.atmosenv.2008.06.052, 2009.
Spracklen, D. V., Pringle, K. J., Carslaw, K. S., Chipperfield, M. P., and Mann, G. W.: A global off-line model of size-resolved aerosol microphysics: I. Model development and pre-diction of aerosol properties, Atmos. Chem. Phys., 5, 2227– 2252, doi:10.5194/acp-5-2227-2005, 2005.
Tong, Y. Y. and Lighthart, B.: The annual bacterial particle concen-tration and size distribution in the ambient atmosphere in a rural area of the Willamette valley, Oregon, Aerosol. Sci. Technol., 32, 393–403, doi:10.1080/027868200303533, 2000.
Yttri, K. E., Simpson, D., Stenström, K., Puxbaum, H., and Svendby, T.: Source apportionment of the carbonaceous aerosol in Norway – quantitative estimates based on14C, thermal-optical and organic tracer analysis, Atmos. Chem. Phys., 11, 9375–9394, doi:10.5194/acp-11-9375-2011, 2011.