HAL Id: inserm-02290247
https://www.hal.inserm.fr/inserm-02290247
Submitted on 17 Sep 2019
HAL is a multi-disciplinary open access
archive for the deposit and dissemination of
sci-entific research documents, whether they are
pub-lished or not. The documents may come from
teaching and research institutions in France or
abroad, or from public or private research centers.
L’archive ouverte pluridisciplinaire HAL, est
destinée au dépôt et à la diffusion de documents
scientifiques de niveau recherche, publiés ou non,
émanant des établissements d’enseignement et de
recherche français ou étrangers, des laboratoires
publics ou privés.
Distributed under a Creative Commons Attribution| 4.0 International License
French NutriNet-Santé cohort
Moufidath Adjibade, Chantal Julia, Benjamin Allès, Mathilde Touvier, Cedric
Lemogne, Bernard Srour, Serge Hercberg, Pilar Galan, Karen Assmann,
Emmanuelle Kesse-Guyot
To cite this version:
Moufidath Adjibade, Chantal Julia, Benjamin Allès, Mathilde Touvier, Cedric Lemogne, et al..
Prospective association between ultra-processed food consumption and incident depressive
symp-toms in the French NutriNet-Santé cohort. BMC Medicine, BioMed Central, 2019, 17 (1), pp.78.
�10.1186/s12916-019-1312-y�. �inserm-02290247�
R E S E A R C H A R T I C L E
Open Access
Prospective association between
ultra-processed food consumption and
incident depressive symptoms in the
French NutriNet-Santé cohort
Moufidath Adjibade
1*, Chantal Julia
1,2, Benjamin Allès
1, Mathilde Touvier
1, Cédric Lemogne
3,4,5, Bernard Srour
1,
Serge Hercberg
1,2, Pilar Galan
1, Karen E. Assmann
1and Emmanuelle Kesse-Guyot
1Abstract
Background: Ultra-processed food (UPF) consumption has increased over the last decades in Westernized countries. Our objective was to investigate for the first time the association between the proportion of UPF (%UPF) in the diet and incident depressive symptoms in the NutriNet-Santé cohort.
Methods: The sample included 20,380 women and 6350 men (aged 18–86 years) without depressive symptoms at the first Center for Epidemiologic Studies Depression Scale (CES-D) measurement, using validated cut-offs (CES-D score≥ 17 for men and≥ 23 for women). The proportion of UPF in the diet was computed for each subject using the NOVA classification applied to dietary intakes collected by repeated 24-h records (mean = 8; SD = 2.3). The association between UPF and depressive symptoms was evaluated using multivariable Cox proportional hazards models. Results: Over a mean follow-up of 5.4 years, 2221 incident cases of depressive symptoms were identified. After accounting for a wide range of potential confounders, an increased risk of depressive symptoms was observed with an increased %UPF in the diet. In the main model adjusted for sociodemographic characteristics, body mass index, and lifestyle factors, the estimated hazard ratio for a 10% increase in UPF was 1.21 (95% confidence interval = 1.15–1.27). Considering %UPF in food groups, the association was significant only for beverages and sauces or added fats.
Conclusion: Overall, UPF consumption was positively associated with the risk of incident depressive symptoms, suggesting that accounting for this non-nutritional aspect of the diet could be important for mental health promotion. Keywords: Mental health, Depression, Ultra-processed food, Prospective cohort
Introduction
Depression is a very common disorder, one of the five leading causes of years lived with disability in 2016 [1] and, according to WHO, the 1st leading cause of disease burden globally [2]. Depression etiology implies complex interactions between various factors including social, psychological, and biological factors.
Some treatments are effective but their limitations, as well as the detrimental effect of any depressive episode
on the future course of the disease, make prevention crucial [3]. Among large-scale preventive interventions, acting on modifiable factors such as diet is a good candidate for pub-lic health action. Large-scale epidemiological studies have consistently documented an association between a healthy diet or dietary indexes reflecting the holistic quality of the diet and a lower risk of depression [4–7]. For instance, in the NutriNet-Santé study, we have observed that several dietary indexes reflecting nutritional recommendations were prospectively and inversely associated with the risk to develop depressive symptoms [8]. On the opposite, a west-ern dietary pattwest-ern or pro-inflammatory diet characterized among other things by more processed foods has been as-sociated with poor mental health [5,6,9]. Previous studies
© The Author(s). 2019 Open Access This article is distributed under the terms of the Creative Commons Attribution 4.0 International License (http://creativecommons.org/licenses/by/4.0/), which permits unrestricted use, distribution, and reproduction in any medium, provided you give appropriate credit to the original author(s) and the source, provide a link to the Creative Commons license, and indicate if changes were made. The Creative Commons Public Domain Dedication waiver (http://creativecommons.org/publicdomain/zero/1.0/) applies to the data made available in this article, unless otherwise stated.
* Correspondence:m.adjibade@eren.smbh.univ-paris13.fr
1
Equipe de Recherche en Epidémiologie Nutritionnelle (EREN), Université Paris 13, Centre d’Epidémiologie et Statistiques Sorbonne Paris Cité, Inserm (U1153), Inra (U1125), Cnam, COMUE Sorbonne Paris Cité, 74 rue Marcel Cachin, 93017 Bobigny, France
that reported associations between these diets and depres-sion considered nutritional characteristics of the diet and interaction within the food matrix. However, some of those diets integrate a large part of ultra-processed food (UPF) (i.e., industrial recipes that are practical, ready to eat, and palatable [10]) which consumption has drastically increased over the past decades [11, 12]. For instance, a recent American study reported that, between 2007 and 2012, about 60% of the overall energy intake was provided by UPF [13]. In the French NutriNet-Santé study, UPF con-tributed to 35.9% of the daily energy intake and the propor-tion of UPF (%UPF) in the diet has been associated with a poor overall quality of the diet [14].
While processing ensures improvement of food avail-ability, digestibility, short-term safety, transportavail-ability, and storage life [15], UPF are often energy-dense; mostly very rich in fat, sugar, and salt; and poor in micronutri-ents; thus, they may have a potential deleterious role on health. Beyond their unfavorable nutritional compos-ition, they also contain other components generated dur-ing transformation such as neo-formed molecules produced during heating, food additives used in manu-facturing, and molecules migrated from packaging, some of which might have a detrimental role for gut micro-biota [16], involved in the development of several dis-eases characterized by an inflammatory component (including depression) [17]. The investigation of the as-sociation between UPF consumption and health is there-fore important.
Recent studies on the link between UPF consumption and health have shown a positive association between UPF consumption and obesity [18], hypertension [19], metabolic disorders [20], and cancer [21]. To date, no study has focused on mental disorders.
The purpose of the present study was thus to investi-gate for the first time the prospective association be-tween %UPF in the diet and the risk of depressive symptoms using the data of the NutriNet-Santé cohort study.
Methods
Study population
The data used in the current study are based on the web-based observational NutriNet-Santé cohort study, launched in France in 2009. The objective of the study is to investigate the link between nutrition and health, as well as determinants of dietary behaviors and nutritional status. Details on the design and method have been pre-viously described [22]. Participants are adult volunteers (aged ≥ 18 years) recruited from the general population (all regions of France) with access to Internet by a vast multimedia campaign. Yearly, participants are asked to complete a set of self-administered web-based question-naires related to sociodemographic data, economic
conditions, physical activity, dietary intake, anthropomet-ric data, and health status. The NutriNet-Santé study is conducted in accordance with the Declaration of Helsinki and was approved by the ethics committee of the French Institute for Health and Medical Research (IRB Inserm no. 0000388FWA00005831) and by the National Commis-sion on Informatics and Liberty (CNIL no. 908450 and no. 909216). Electronic informed consent was obtained from all participants. The NutriNet-Santé study is registered in
ClinicalTrials.gov(NCT03335644). Depressive symptoms
Two years after inclusion and every 2 years thereafter, depressive symptoms were assessed using the French version of the validated self-administered Center for Epi-demiologic Studies Depression (CES-D) scale [23, 24]. The CES-D scale is composed of 20 items evaluating the frequency of depressive symptoms during the previous week. Response modalities are based on a four-point scale (0 =‘less than 1 day’, 1 = ‘1–2 days’; 2 = ‘3–4 days’; and 3 =‘5–7 days’). All sub-scores were summed to yield a total score ranging from 0 (no depressive symptoms) to 60 (elevated depressive symptoms). In our study, the internal consistency assessed by Cronbach’s alpha coeffi-cient was high (> 0.80) at each CES-D scale assessment. In the present study, the presence of depressive symp-toms was defined using the French validated cut-off values (CES-D≥ 17 in men and ≥ 23 in women) [23,24]. We defined ‘incident cases of depressive symptoms’ as participants who were free of depressive symptoms at the 1st CES-D assessment and then presenting depres-sive symptoms at least once during follow-up (i.e., based on one or multiple of the CES-D questionnaires com-pleted after the initial CES-D assessment).
Dietary data and ultra-processed food consumption assessment
At inclusion and every 6 months thereafter, participants were invited to provide three non-consecutive 24-h diet-ary records. These were randomly assigned over a 2-week period (two weekdays and one weekend day) to cover intra-individual variability in intake. Consumption of all types of foods and beverages were reported on the web-based dietary record platform validated for self-administration [25]. The NutriNet-Santé web-based self-administered 24-h dietary records have also been vali-dated against blood and urinary biomarkers [26,27]. Por-tion sizes were determined using validated photographs [28] and household measures or directly by providing exact quantity (grams/milliliters). Energy and nutrient in-takes were estimated using the published NutriNet-Santé food composition table including more than 3000 food items [29]. Composite home-made dishes were decom-posed by using French recipes validated by nutrition
professionals. Dietary under-reporters were identified using the method developed by Black [30]. The dietary data used in the present study are those collected during the first 2 years of follow-up (inclusion until the first CES-D assessment). Daily mean food intakes were calcu-lated from all dietary records weighted according to the type of day (weekdays or weekend) with, on average, 7.98 (SD = 2.28) recorded days.
To account for the dietary profiles of participants, as a potentially strong confounder in the context of our study, we used principal component analysis (PCA) to extract ‘dietary pattern scores’ that are independent lin-ear combinations of 22 pre-defined food groups, maxi-mizing the explained variance. The number of dietary patterns retained was determined according to Cattel’s Scree plots and the interpretability of the principal com-ponents. Food groups with absolute loading coefficient > 0.3 were considered to be strongly associated with a pattern, and an individual pattern score was calculated by summing the intake of the 22 food groups, weighted by their loading coefficients. The first two dietary pat-terns accounted for about 18% of the initial variance (Additional file 1: Table S1). The first principal compo-nent, corresponding to a “healthy” dietary pattern, was strongly and positively correlated with intake of whole grains, olive oil, vegetables, and fruit. The second princi-pal component, corresponding to a “western” dietary pattern, was strongly correlated with refined grains, po-tatoes, meat, and alcoholic beverages.
Classification of the level of processing
All foods and beverages were classified according to the four-group NOVA food classification system (un/minim-ally processed, culinary ingredient, processed food, and ultra-processed food) [12,31]. The present study primar-ily focused on the‘ultra-processed foods’ (UPF) category. The proportion (in weight, % grams/day) of UPF (%UPF) in the diet was calculated for each participant. UPF are manufactured food products containing numerous in-gredients as well as additives such as hydrogenated oils, non-sugar sweeteners, modified starch, flavoring agents, emulsifiers, humectants, colors, and other additives used for cosmetic purpose. This food category includes among others: mass-produced packaged breads and buns; breakfast ‘cereals’, and ‘energy’ bars; sweet or sa-vory packaged snacks; carbonated and ‘energy’ drinks; sweet fruit-based desserts with added sugars, artificial flavours and texturizing agents; flavoured milk drinks and cocoa drinks; industrial cookies, pastries, cakes, and cake mixes; confectionery (ice-cream, chocolate, candies); meat and chicken extracts and‘instant’ sauces; margarines and spreads; cooked seasoned vegetables with ready-made sauces; ready-to-heat products (pow-dered and packaged‘instant’ soups, noodles and desserts,
pre-prepared pies, pasta and pizza dishes, poultry and fish‘nuggets’, burgers, hot dogs, and other reconstituted meat products).
Covariates
Data on sex, date of birth, marital status (living alone, co-habiting, or separated/divorced/widowed), educational level (less than high school diploma, high school diploma, or university level), occupational categories (never-em-ployed/other activity, self-employed, employee, intermedi-ate profession, and managerial staff ), residential area (rural or urban), smoking status (never, former or current smoker), household composition, and monthly household income (< 1200, 1200–1800, 1800–2700, > 2700 euros and a category of participants who refused to disclose their in-come) were collected at baseline using a self-administered web-based questionnaire [32].
Monthly household income was estimated per consump-tion unit (CU) using a weighting system: one CU attributed for the first adult in the household, 0.5 CU for other per-sons aged 14 or older, and 0.3 CU for children under 14 [33]. Weight and height data were collected by a validated self-administered anthropometric questionnaire [34]. Body mass index (BMI) was calculated as the ratio of weight to squared height (kg/m2). Physical activity was assessed using a short form of the French version of the International Physical Activity Questionnaire (IPAQ) [35]. Energy ex-penditure was classified as low physical activity (< 30 min of physical activity; equivalent to brisk walking/day), moderate physical activity (≥ 30 and < 60 min) or high physical activ-ity (≥ 60 min). Prevalent and incident cases of cancer and cardiovascular diseases (strokes, myocardial infarctions, and acute coronary syndromes) were self-reported during follow-up; incident cases were validated by a medical com-mittee based on medical records (diagnosis, hospitalization, radiological reports, electrocardiograms, etc.), and a link was made with medico-administrative databases of the French National Health insurance. Type 2 diabetes and hypertension were self-reported or identified using spe-cific medication. In addition, subjective memory com-plaints were measured concomitantly with depressive symptoms scale using the French version of the vali-dated self-administered Cognitive Difficulties Scale (CDS) [36,37].
Statistical analysis
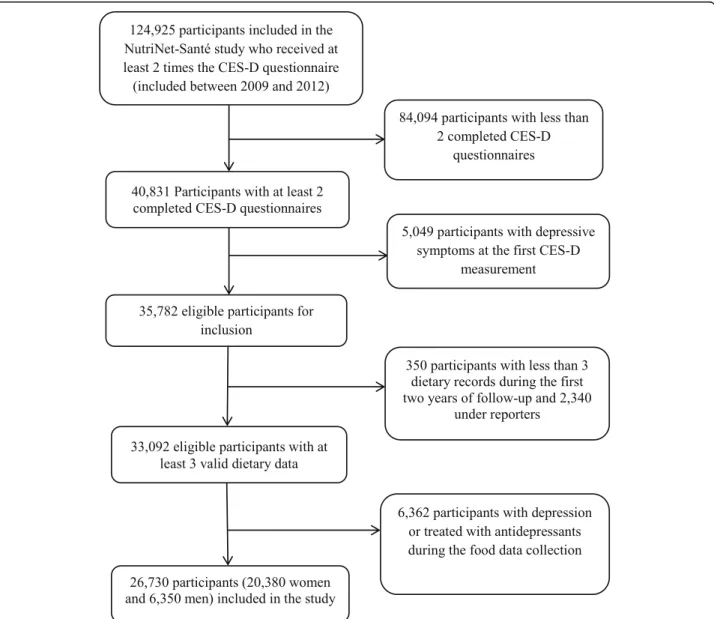
The inclusion criteria in this study were as follows: (1) have received at least twice the CES-D questionnaire (in-cluded between 2009 and 2012), (2) completed at least two of these questionnaires, and (3) not present depres-sive symptoms at the first CES-D assessment. Among the participants who met these criteria (n = 35,782), we excluded participants without valid dietary data (partici-pants with less than three dietary records during the first
2 years of follow-up and under-reporters) and the partic-ipants who had reported depression or treatment with antidepressants during the dietary data collection. Thus, a final study sample of 26,730 participants was obtained (Fig.1).
In the present study, data were missing for some co-variates (n = 7 for marital status, n = 72 for occupational categories, n = 317 for residential area, n = 195 for edu-cational level, and n = 435 for physical activity). As the proportion of missing values was < 1%, they were han-dled using the Hot Deck method, i.e., by replacing miss-ing values with the value of respondents with similar characteristics [38] .
Participants included in the present study were com-pared with excluded eligible participants using chi-square tests ort tests. Participants’ characteristics and nutritional
factors were compared across quartiles of %UPF using lin-ear contrast or Cochran-Mantel-Haenszel tests. For de-scriptive purposes, nutrient intakes were energy-adjusted using the residual method [39].
The associations between %UPF (modeled as quartiles and as a continuous variable, while estimating coeffi-cients associated with a 10% increase in UPF) and risk of depressive symptoms were assessed using Cox propor-tional hazards regression models for interval censored data. Hazard ratios (HR) and 95% confidence intervals (CI) were estimated. Linear trend tests across quartiles of %UPF were assessed by modeling these quartiles as ordinal variables. Age was used as the primary time scale variable. Entry time was defined as the age at the first CES-D measurement. Exit time was the age at last com-pleted CES-D questionnaire, or the average of the age
between the first occurrence of depressive symptoms and the age at the previous measurement for non-cases and cases respectively.
The first model was adjusted for age, sex, and BMI (continuous variable). The second model (main model) was additionally adjusted for marital status, educational level, occupational categories, monthly household come per consumption unit, residential area, energy in-take without alcohol, number of 24 h records and inclusion month, smoking status, alcohol consumption, and physical activity. Five additional models were also performed to account for (a) PCA-extracted dietary pat-terns and intake of carbohydrates, lipids, and salt; (b) health events occurring during follow-up (cancer, type 2 diabetes, and cardiovascular diseases); (c) baseline CES-D score (continuous variable), and use of antide-pressants during the follow-up; (d) CDS score (continu-ous variable), and (e) baseline CES-D score (continu(continu-ous variable), use of antidepressants during the follow-up and CDS score (continuous variable).
A potential interaction between %UPF and the West-ern and the healthy dietary pattWest-erns on the risk of de-pressive symptoms was tested. We also considered a potential interaction between %UPF and the ratio be-tween energy intake and energy needs calculated using the PAL (physical activity level) and basal metabolic rate (which was estimated using the Schofield equations ac-counting for age, sex, weight, and height [40]).
Another supplementary analysis was performed by considering the % of UPF within each food group. For this analysis, models were further adjusted for the intake of the considered food group. To account for the mul-tiple testing, false discovery rate-correctedP values were estimated using the Benjamini-Hochberg procedure [41]. Sensitivity analyses
A number of sensitivity analyses were performed to test the robustness of our findings. First, for comparison with international data, the proportion of total energy intake from UPF, usually used in other studies, in the diet was also calculated and the main analyses were re-run. Second, we tested the robustness of our findings when other CES-D cut-offs (a) 16 or (b) 19 were consid-ered [23,24]. We also repeated the analyses by consider-ing as cases, only the participants who had depressive symptoms during follow-up (according to CES-D score) and also reported antidepressant treatment during follow-up. All statistical analyses were conducted using SAS (version 9.4; SAS institute Inc., Cary, NC, USA) with a significance level of 0.05 for two-sided tests.
Results
In the NutriNet-santé cohort, participants who completed only 1 CES-D questionnaire (n = 24,154), compared to
those who completed it at least two during follow-up (n = 40,831) were younger, less physically active, and more likely to be women, current smoker or living alone. They were also more likely to have a BMI value≥ 30, a slightly higher baseline CES-D score, a household income per unit consumption < 1800, or not having provided their income and less likely to have a chronic disease and an intermedi-ate profession or to be managerial staff (Additional file2: Table S2). In addition, among eligible participants (n = 35,782), those included were more educated, more often managerial staff, and more often physically active and pre-sented less often an obesity or chronic diseases than those excluded (Additional file3: Table S3).
The study sample included 6350 men and 20,380 women with a mean age of 47.26, standard deviation (SD = 14.17) years at baseline. During follow-up (mean = 5.4, SD = 1.13 years), a total of 2221 incident cases of de-pressive symptoms (9.0% in men and 8.1% in women;p = 0.02) were identified. Baseline characteristics of the studied sample are presented in Table1.
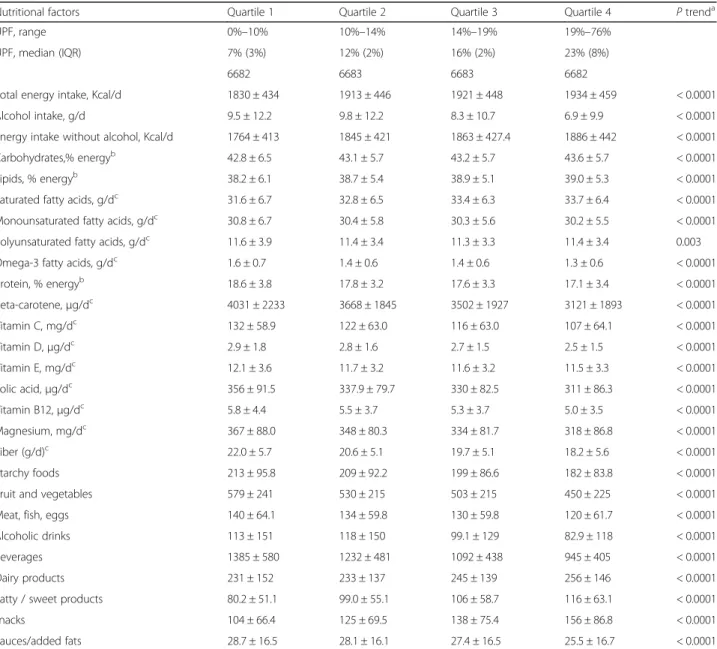
The average %UPF was 15% (SD = 8%) in gram and 32% (SD = 11%) in energy. Participants with an elevated %UPF in the diet were younger, more often employees, never or current smokers, and had a lower income. They also more often presented obesity. The %UPF in the diet was also associated with a less nutritionally healthy diet (Table2), since higher %UPF values were associated with higher energy intakes and saturated fatty acids intakes. On the other hand, a negative correlation with micronu-trients (beta-carotene, vitamin C, folic acid, Vitamin B12, magnesium, and fibers) and omega 3 fatty acids was observed.
The associations between ultra-processed food intake and incident depressive symptoms are presented in Table 3. In the main model adjusted for sociodemo-graphic and lifestyle data, a strong and linear relation-ship was observed between %UPF in the diet and the risk of incident depressive symptoms. A 10% increase in %UPF in the diet was associated with a 21% (95%CI = 15%–27%) higher risk of depressive symptoms. Further adjustment for dietary patterns and dietary intakes (car-bohydrates, lipids, and sodium), health events, or the CDS score did not substantially modify the association. However, after accounting for the use of antidepressants during follow-up and the baseline value for the CES-D score, the association was attenuated but remained sig-nificant (HRfor a 10% increase in UPF in the diet= 1.14, 95%CI = 1.09–1.20). The proportional hazards assumption was evaluated using martingale residues, and the assumption was acceptable (P = 0.12 for the main model). The dose-response association between %UPF and incident depressive symptoms using Restricted Cubic Spline was also presented in Additional file 4: Figure S1 (p < 0.0001
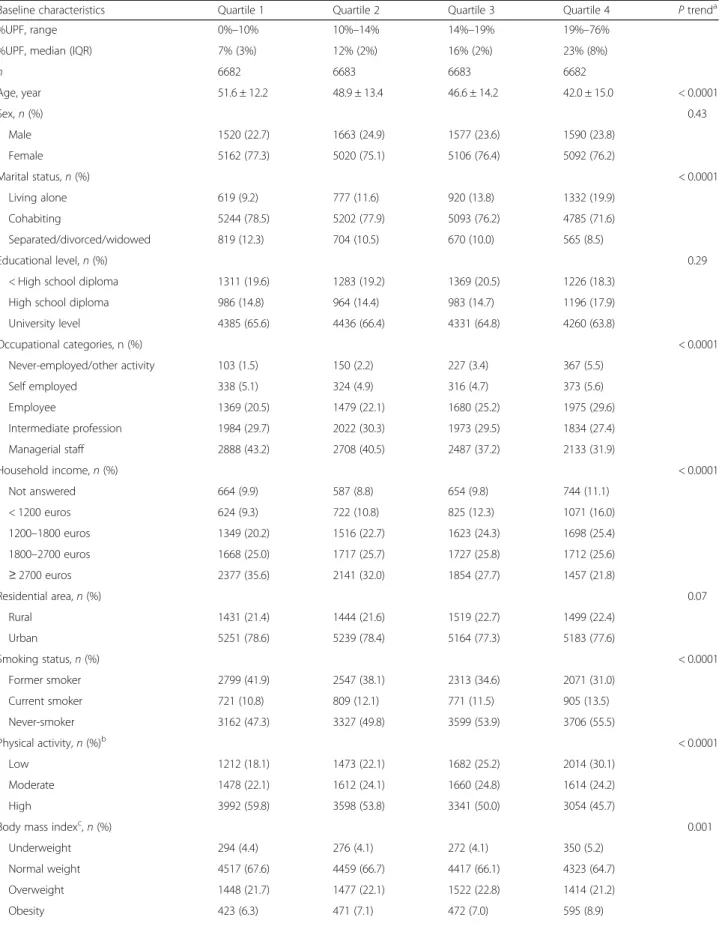
Table 1 Baseline characteristics according to the quartiles of ultra-processed food (UPF) consumption, NutriNet-Santé study (n = 26,730)
Baseline characteristics Quartile 1 Quartile 2 Quartile 3 Quartile 4 P trenda %UPF, range 0%–10% 10%–14% 14%–19% 19%–76%
%UPF, median (IQR) 7% (3%) 12% (2%) 16% (2%) 23% (8%)
n 6682 6683 6683 6682 Age, year 51.6 ± 12.2 48.9 ± 13.4 46.6 ± 14.2 42.0 ± 15.0 < 0.0001 Sex, n (%) 0.43 Male 1520 (22.7) 1663 (24.9) 1577 (23.6) 1590 (23.8) Female 5162 (77.3) 5020 (75.1) 5106 (76.4) 5092 (76.2) Marital status, n (%) < 0.0001 Living alone 619 (9.2) 777 (11.6) 920 (13.8) 1332 (19.9) Cohabiting 5244 (78.5) 5202 (77.9) 5093 (76.2) 4785 (71.6) Separated/divorced/widowed 819 (12.3) 704 (10.5) 670 (10.0) 565 (8.5) Educational level, n (%) 0.29
< High school diploma 1311 (19.6) 1283 (19.2) 1369 (20.5) 1226 (18.3) High school diploma 986 (14.8) 964 (14.4) 983 (14.7) 1196 (17.9) University level 4385 (65.6) 4436 (66.4) 4331 (64.8) 4260 (63.8) Occupational categories, n (%) < 0.0001 Never-employed/other activity 103 (1.5) 150 (2.2) 227 (3.4) 367 (5.5) Self employed 338 (5.1) 324 (4.9) 316 (4.7) 373 (5.6) Employee 1369 (20.5) 1479 (22.1) 1680 (25.2) 1975 (29.6) Intermediate profession 1984 (29.7) 2022 (30.3) 1973 (29.5) 1834 (27.4) Managerial staff 2888 (43.2) 2708 (40.5) 2487 (37.2) 2133 (31.9) Household income, n (%) < 0.0001 Not answered 664 (9.9) 587 (8.8) 654 (9.8) 744 (11.1) < 1200 euros 624 (9.3) 722 (10.8) 825 (12.3) 1071 (16.0) 1200–1800 euros 1349 (20.2) 1516 (22.7) 1623 (24.3) 1698 (25.4) 1800–2700 euros 1668 (25.0) 1717 (25.7) 1727 (25.8) 1712 (25.6) ≥ 2700 euros 2377 (35.6) 2141 (32.0) 1854 (27.7) 1457 (21.8) Residential area, n (%) 0.07 Rural 1431 (21.4) 1444 (21.6) 1519 (22.7) 1499 (22.4) Urban 5251 (78.6) 5239 (78.4) 5164 (77.3) 5183 (77.6) Smoking status, n (%) < 0.0001 Former smoker 2799 (41.9) 2547 (38.1) 2313 (34.6) 2071 (31.0) Current smoker 721 (10.8) 809 (12.1) 771 (11.5) 905 (13.5) Never-smoker 3162 (47.3) 3327 (49.8) 3599 (53.9) 3706 (55.5) Physical activity, n (%)b < 0.0001 Low 1212 (18.1) 1473 (22.1) 1682 (25.2) 2014 (30.1) Moderate 1478 (22.1) 1612 (24.1) 1660 (24.8) 1614 (24.2) High 3992 (59.8) 3598 (53.8) 3341 (50.0) 3054 (45.7)
Body mass indexc, n (%) 0.001
Underweight 294 (4.4) 276 (4.1) 272 (4.1) 350 (5.2) Normal weight 4517 (67.6) 4459 (66.7) 4417 (66.1) 4323 (64.7) Overweight 1448 (21.7) 1477 (22.1) 1522 (22.8) 1414 (21.2) Obesity 423 (6.3) 471 (7.1) 472 (7.0) 595 (8.9)
Table 1 Baseline characteristics according to the quartiles of ultra-processed food (UPF) consumption, NutriNet-Santé study (n = 26,730) (Continued)
Baseline characteristics Quartile 1 Quartile 2 Quartile 3 Quartile 4 P trenda
Chronic diseasesd
, n (%) 741 (11.1) 724 (10.9) 683 (10.2) 559 (8.4) < 0.0001 Baseline CES-D, mean score 7.74 ± 5.38 7.94 ± 5.35 8.26 ± 5.46 8.90 ± 5.56 < 0.0001
CES-D Center for Epidemiologic Studies Depression Scale, UPF Proportion of ultra-processed food intake Values are means ± standard deviation or numbers (percentages) as appropriate
a
P trend values are based on linear contrast or Cochran-Mantel-Haenszel tests b
Physical activity was classified as low (< 30 min of physical activity; equivalent to brisk walking/day) or moderate/high physical activity (≥ 30 min of physical activity; equivalent to brisk walking/day)
c
Body mass index was classified as underweight (BMI < 18.5), normal weight (18.5≥ BMI < 25), overweight (25 ≥ BMI < 30) or obese (BMI ≥ 30) d
Incident cases of cancer, type 2 diabetes, hypertension and cardiovascular diseases
Table 2 Baseline nutritional and dietary intakes according to the quartiles of ultra-processed food consumption, NutriNet-Santé study
Nutritional factors Quartile 1 Quartile 2 Quartile 3 Quartile 4 P trenda
UPF, range 0%–10% 10%–14% 14%–19% 19%–76% UPF, median (IQR) 7% (3%) 12% (2%) 16% (2%) 23% (8%)
n 6682 6683 6683 6682
Total energy intake, Kcal/d 1830 ± 434 1913 ± 446 1921 ± 448 1934 ± 459 < 0.0001 Alcohol intake, g/d 9.5 ± 12.2 9.8 ± 12.2 8.3 ± 10.7 6.9 ± 9.9 < 0.0001 Energy intake without alcohol, Kcal/d 1764 ± 413 1845 ± 421 1863 ± 427.4 1886 ± 442 < 0.0001 Carbohydrates,% energyb 42.8 ± 6.5 43.1 ± 5.7 43.2 ± 5.7 43.6 ± 5.7 < 0.0001 Lipids, % energyb 38.2 ± 6.1 38.7 ± 5.4 38.9 ± 5.1 39.0 ± 5.3 < 0.0001 Saturated fatty acids, g/dc 31.6 ± 6.7 32.8 ± 6.5 33.4 ± 6.3 33.7 ± 6.4 < 0.0001 Monounsaturated fatty acids, g/dc 30.8 ± 6.7 30.4 ± 5.8 30.3 ± 5.6 30.2 ± 5.5 < 0.0001 Polyunsaturated fatty acids, g/dc 11.6 ± 3.9 11.4 ± 3.4 11.3 ± 3.3 11.4 ± 3.4 0.003 Omega-3 fatty acids, g/dc 1.6 ± 0.7 1.4 ± 0.6 1.4 ± 0.6 1.3 ± 0.6 < 0.0001 Protein, % energyb 18.6 ± 3.8 17.8 ± 3.2 17.6 ± 3.3 17.1 ± 3.4 < 0.0001 Beta-carotene,μg/dc 4031 ± 2233 3668 ± 1845 3502 ± 1927 3121 ± 1893 < 0.0001 Vitamin C, mg/dc 132 ± 58.9 122 ± 63.0 116 ± 63.0 107 ± 64.1 < 0.0001 Vitamin D,μg/dc 2.9 ± 1.8 2.8 ± 1.6 2.7 ± 1.5 2.5 ± 1.5 < 0.0001 Vitamin E, mg/dc 12.1 ± 3.6 11.7 ± 3.2 11.6 ± 3.2 11.5 ± 3.3 < 0.0001 Folic acid,μg/dc 356 ± 91.5 337.9 ± 79.7 330 ± 82.5 311 ± 86.3 < 0.0001 Vitamin B12,μg/dc 5.8 ± 4.4 5.5 ± 3.7 5.3 ± 3.7 5.0 ± 3.5 < 0.0001 Magnesium, mg/dc 367 ± 88.0 348 ± 80.3 334 ± 81.7 318 ± 86.8 < 0.0001 Fiber (g/d)c 22.0 ± 5.7 20.6 ± 5.1 19.7 ± 5.1 18.2 ± 5.6 < 0.0001 Starchy foods 213 ± 95.8 209 ± 92.2 199 ± 86.6 182 ± 83.8 < 0.0001 Fruit and vegetables 579 ± 241 530 ± 215 503 ± 215 450 ± 225 < 0.0001 Meat, fish, eggs 140 ± 64.1 134 ± 59.8 130 ± 59.8 120 ± 61.7 < 0.0001 Alcoholic drinks 113 ± 151 118 ± 150 99.1 ± 129 82.9 ± 118 < 0.0001 Beverages 1385 ± 580 1232 ± 481 1092 ± 438 945 ± 405 < 0.0001 Dairy products 231 ± 152 233 ± 137 245 ± 139 256 ± 146 < 0.0001 Fatty / sweet products 80.2 ± 51.1 99.0 ± 55.1 106 ± 58.7 116 ± 63.1 < 0.0001 snacks 104 ± 66.4 125 ± 69.5 138 ± 75.4 156 ± 86.8 < 0.0001 Sauces/added fats 28.7 ± 16.5 28.1 ± 16.1 27.4 ± 16.5 25.5 ± 16.7 < 0.0001
UPF Proportion of ultra-processed food intake Values are means ± standard deviation a
P trend values are based on linear contrast b
Values are percentages of total daily energy intake (without alcohol) c
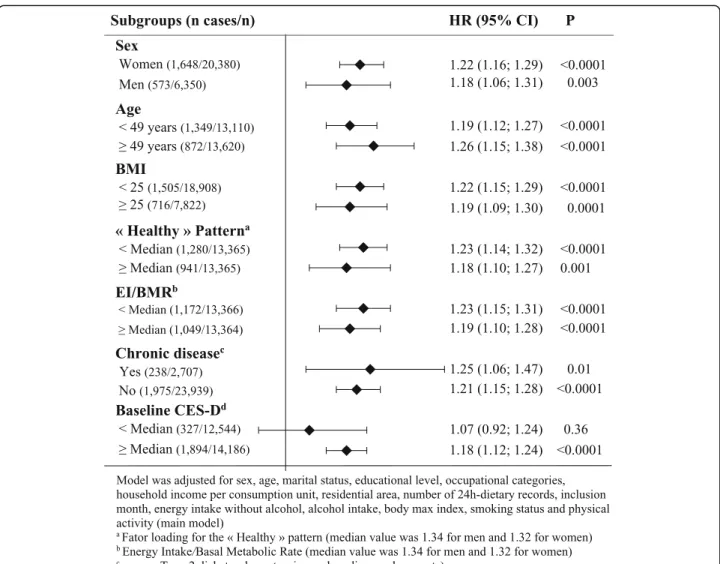
On the other hand, when considering the ratio of en-ergy intake to enen-ergy needs, a significant interaction with %UPF was detected (P = 0.04). Hence, analysis stratified according to this ratio (while using the sex-specific EI/BMR median value as cut-off: 1.34 for men and 1.32 for women) was performed (Fig. 2). The association between %UPF and the risk of depressive symptoms was stronger in participants with low energy intakes compared to their needs than their counterparts (HRfor a 10% increase in UPF in the diet= 1.23, 95%CI = 1.15– 1.31 versus 1.19, 95%CI = 1.10–1.28; main model). Simi-larly, in the stratified analyses according to sex, age (using the median value), BMI (< 25 vs. ≥ 25), comorbid conditions and individual pattern score for the‘Healthy’ pattern (using the sex-specific median value as cut-off: 0.04 for men and − 0.11 for women), stronger associa-tions were observed in the subgroups of women, partici-pants aged ≥ 49 years, participants with a chronic disease, participants with a BMI value ≥ 25, and partici-pants with a lower value for the individual score of the ‘Healthy’ pattern, compared to their respective counter-parts (Fig.2). However, the estimated HR were similar in the subgroups and no significant interaction was ob-served (P value for the interaction term was 0.49 for sex, 0.46 for age, 0.59 for BMI, 0.88 for comorbidities, and 0.18 for the individual score of the ‘healthy’ dietary pat-tern). In addition, in the stratified analyses according to
the baseline CES-D score (using the sex-specific median value as cut-off: 6 for men and 8 for women), the associ-ation between %UPF and the risk of depressive symp-toms was significant only among participants with a higher baseline CES-D score (P value for the interaction term was 0.13).
The associations between %UPF in each food group and the risk of depressive symptoms are presented in Table 4. A significantly increased risk was observed for high %UPF in beverages and sauces or added fats. The strongest association was detected for %UPF in bever-ages (HRQ4 vs.Q1= 1.25, 95%CI = 1.13–1.38).
Sensitivity analyses
Sensitivity analyses using other CES-D cut-offs (16 or 19) to identify cases of depressive symptoms or %UPF weighted on energy intake rather than on quantity con-sumed in gram yielded similar associations (Add-itional file5: Table S4 and Additional file6: Table S5). In addition, the analyses considering as cases only partici-pants who had depressive symptoms and also used anti-depressant treatment during follow-up showed stronger associations (Additional file 7: Table S6). However, the associations were not significant when the %UPF was modeled as quartiles, mainly due to low statistical power because of the small number of cases (n = 113 cases). In the main model, the estimated HR for the analysis Table 3 Association between ultra-processed food intake and incident depressive symptoms, NutriNet-Santé study
Quartile 1 Quartile 2 Quartile 3 Quartile 4 P trend Continuousa Pb UPF, range 0%–10% 10%–14% 14%–19% 19%–76%
UPF, median (IQR) 7% (3%) 12% (2%) 16% (2%) 23% (8%)
n 6682 6683 6683 6682 26,730 Number of cases 491 459 557 714 2221 Person years 21,597 21,097 20,468 19,918 83,080 Model 1c 1 (ref) 0.90 (0.79; 1.02) 1.07 (0.94; 1.21) 1.31 (1.16; 1.47) < 0.0001 1.23 (1.17; 1.29) < 0.0001 Model 2d 1 (ref) 0.91 (0.80; 1.04) 1.09 (0.96; 1.23) 1.30 (1.15; 1.47) < 0.0001 1.21 (1.15; 1.27) < 0.0001 Model 3e 1 (ref) 0.91 (0.80; 1.04) 1.08 (0.95; 1.23) 1.29 (1.13; 1.47) < 0.0001 1.22 (1.16; 1.29) < 0.0001 Model 4f 1 (ref) 0.92 (0.81; 1.04) 1.09 (0.97; 1.24) 1.31 (1.16; 1.48) < 0.0001 1.21 (1.15; 1.27) < 0.0001 Model 5g 1 (ref) 0.88 (0.77; 1.00) 1.00 (0.88; 1.13) 1.13 (1.00; 1.28) 0.01 1.14 (1.09; 1.20) < 0.0001 Model 6h 1 (ref) 0.88 (0.78; 1.00) 1.06 (0.94; 1.20) 1.27 (1.13; 1.44) < 0.0001 1.21 (1.15; 1.27) < 0.0001 Model 7i 1 (ref) 0.86 (0.76; 0.98) 1.00 (0.88; 1.13) 1.13 (1.00; 1.28) 0.01 1.15 (1.09; 1.21) < 0.0001
Values are hazard ratios (95% confidence intervals).CDS Cognitive Difficulties Scale; CES-D Center for Epidemiologic Studies Depression Scale; IQR interquartile range; UPF proportion of ultra-processed food intake
a
Hazard ratios for 10% increase in the proportion of ultra-processed food intake b
P for continuous variable c
Adjusted for age, sex, and body mass index d
Adjusted for all variables in model 1 + marital status, educational level, occupational categories, household income per consumption unit, residential area, number of 24-h dietary records, inclusion month, energy intake without alcohol, alcohol intake, smoking status, and physical activity (main model) e
Adjusted for all variables in model 2 + dietary patterns derived from the factor analysis (‘Healthy’ and ‘Western’ dietary pattern) and intakes of lipids, sodium, and carbohydrates
f
Adjusted for all variables in model 2 + health events during follow-up (cancer, type 2 diabetes, hypertension and cardiovascular events) g
Adjusted for all variables in model 2 + use of antidepressants during follow-up and baseline CES-D score h
Adjusted for all variables in model 2 + CDS score i
with a 10% increase in UPF consumption was 1.43 (95%CI = 1.18–1.73).
Discussion
In this large cohort study of adults, the %UPF in the diet was positively associated with the risk of incident de-pressive symptoms even after extensive adjustment in particular for dietary patterns correlated to %UPF. In-deed, in coherence with previous studies, we found that the %UPF in the diet varied according to the socioeco-nomic profile and lifestyle of individuals [42,43].
The first hypothesis which may explain our findings relies on the fact that ultra-processed foods are often part of generally “unhealthy”/western dietary patterns. Although not entirely composed of UPF, western diet is
marked by elevated consumption of UPF and has been associated with depressive outcomes in epidemiologic study. Indeed, in a previous investigation based on data from the NutriNet-Santé study, the diet of high con-sumers of UPF was relatively‘unhealthy’ [14], i.e., char-acterized by a low consumption of fruit and vegetables and a high intake of sweet products or soft drinks. Simi-lar findings were observed in a study conducted within the NHANES, a representative survey conducted in the American population [44]. This is of high importance since ‘western’-style dietary patterns have been previ-ously related to depression [5,6]. In particular, a recent meta-analysis including 21 studies conducted in 10 countries reported that a diet rich in red meat, processed meat, refined grains, sweets, high-fat dairy products,
Fig. 2 Association between ultra-processed food intake and incident depressive symptoms in population subgroups. Values are hazard ratios (HR) and 95% confidence intervals (95% CI). BMI body max index; BMR basal metabolic rate; CES-D Center for Epidemiologic Studies Depression Scale; EI energy intake. Model was adjusted for sex, age, marital status, educational level, occupational categories, household income per consumption unit, residential area, number of 24-h dietary records, inclusion month, energy intake without alcohol, alcohol intake, body max index, smoking status, and physical activity (main model)
butter, potatoes, and high-fat gravy was associated with an elevated risk of depression: presenting a high versus a low ‘Western-type diet’ score was associated with an 18% (95%CI = 5%–34%) increased risk [6].
In the Whitehall study, which included middle-aged UK adults, a diet rich in some types of UPF foods such as sweetened desserts, fried food, and processed meat but also refined grains and high-fat dairy products was also associated with higher odds of depressive symptoms (ORtertile3 vs. tertile1= 1.58, 95%CI = 1.11–2.23) [45]. An increased risk of depression was also observed among the participants included in the Seguimiento Universidad de Navarra—University of Navarra Follow-up (SUN) Project, who were in the highest quintile of fast food (hamburgers, sausages, pizza) and processed pastries (muffins, doughnuts, croissants) compared with those in the lowest quintile (HRquintiles 5 vs. quintiles 1= 1.37, 95%CI = 1.02–1.83) [46]. In addition, in the Personality and Total Health (PATH) Through Life Study—a longi-tudinal community study including 3663 Australian par-ticipants from 3 age cohorts (20+; 40+; 60+ years), a higher score concerning an unhealthy dietary pattern characterized by a high consumption of roast meat, sau-sages, hamburgers, steak, chips, crisps, and soft drinks was an independent predictor of the risk depressive symptoms over time [47]. Anyway these studies do not allow to distinguish the specific role of nutritional profile versus non-nutritional components, part of the western diet, implied in the association with depression.
Then, when stratifying analysis on‘adequate energy in-take’ reflected by the ratio between energy intake and energy needs, a stronger association was observed among participants with lower energy intakes. This may suggest that a limited energy intake associated with a large part of UPF in the diet could limit the intakes of
bioactive micronutrients that are beneficial for depres-sion prevention.
Importantly, the link between UPF consumption and depression could be at least partly explained by effect of some non-nutrient components used for or produced during processing. Indeed, UPF often contain products additives (in particular emulsifiers) or molecules result-ing from high-temperature heatresult-ing which may among others cause alterations to the gut microbiota [16], which has been suggested to show important interrela-tions with mental health [48]. To the best of our know-ledge, no investigation in humans has been conducted to explore the specific role of food additives for the risk of depression except concerning artificial sweeteners. Some experimental studies argue for a modulating role of arti-ficial sweeteners, such as aspartame, on neurotransmit-ters regulation which may lead to symptoms such as mood or depression [49]. However, a recent review based on more than 370 scientific papers reported that data are currently insufficient to conclude [50].
A specific role of UPF on depression, beyond nutri-tional aspects, may, among others, also rely on changes in microbiota induced by non-nutritive components, in particular by emulsifiers which may provoke gut dysbio-sis and mediate inflammatory processes in the gut [51]. In addition, a specific nanoparticle used as, TiO2 whiten-ing agent, has been related to neuroinflammation in an animal model [52]. Findings from animal studies have suggested that some food additives (e.g., monosodium glutamate) may induce anxiety and depression symp-toms [53] or increase susceptibility to the depressor stimuli [54].
The association reported in this study is of interest in terms of public health namely for prevention of depres-sion. In this context, it should be noted that the benefit Table 4 Association between the % of ultra-processed in each food group and incident depressive symptoms, NutriNet-Santé study, N = 26,730
Quartile 1 Quartile 2 Quartile 3 Quartile 4 P trenda
Starchy foods 1 (ref) 0.97 (0.86; 1.10) 0.97 (0.86; 1.10) 1.01 (0.89; 1.14) 0.98 Fruit and vegetables 1 (ref) 0.92 (0.81; 1.03) 0.97 (0.86; 1.10) 1.08 (0.95; 1.22) 0.57 Meat, fish, eggs 1 (ref) 1.08 (0.96; 1.22) 0.97 (0.86; 1.10) 1.04 (0.92; 1.17) 0.98 Beverages 1 (ref) 1.19 (0.91; 1.54) 1.00 (0.89; 1.12) 1.25 (1.13; 1.38) 0.002 Dairy products 1 (ref) 1.03 (0.91; 1.16) 1.06 (0.94; 1.20) 1.13 (1.00; 1.27) 0.20 Fatty/sweet products 1 (ref) 1.02 (0.90; 1.16) 1.05 (0.93; 1.18) 1.08 (0.96; 1.22) 0.57 Snacks 1 (ref) 0.97 (0.85; 1.10) 1.10 (0.98; 1.25) 1.10 (0.98; 1.24) 0.18 Sauces/added fats 1 (ref) 1.05 (0.93; 1.19) 0.96 (0.85; 1.09) 1.23 (1.10; 1.39) 0.02
Values are hazard ratios (95% confidence intervals) and linear trend tests across the quartiles were assessed by modeling the quartiles of %UPF as ordinal variables. UPF Proportion of ultra-processed food intake
Models are adjusted for age, sex, marital status, educational level, occupational categories, household income per consumption unit, residential area, energy intake without alcohol, number of 24-h dietary records, inclusion month, smoking status, physical activity, body mass index, health events during follow-up (cancer, type 2 diabetes, hypertension and cardiovascular events) and quantity of the equivalent food group
a
of decreasing %UPF in diet may be even stronger in other populations than in our sample of French volun-teers included in a diet-related study. Indeed, while UPF (as % of energy) accounted for 32% in our population, a higher proportion has been documented in other stud-ies. For instance, in the UK national diet and Nutrition Survey, 53% of the energy intake [55] was provided through UPF. In North America, %UPF was even higher as evaluated by the representative survey (NHANES), with an average of 57.5% of calories coming from ultra-processed foods [44]. Such elevated consumption of UPF may be an important lever in terms of public health strategy for the prevention of depression. Our results showing that the association between %UPF and the risk of depressive symptoms vary across food groups may help guiding future research toward the non-nutrient compo-nents that are most likely to convey an increased risk of depression. Should ultra-processed beverages, dairy prod-ucts, snacks, and fats share common food additives that are less present in other food groups, these food additives might warrant further scrutiny.
Some limitations of our study should be noted. First, the allocation of foods to the categories defined by the NOVA may have led to misclassification bias—particu-larly since the food composition table used so far in our study is based on generic foods, and not foods as sold. Thus, for food which can be more or less processed, the most frequent level of processing for a food item was ap-plied. Second, given the observational design of our study, we cannot entirely exclude reverse causality, al-though our study is of prospective nature. Moreover, despite the fact that we accounted for a wide range of confounders in our statistical models, unmeasured fac-tors related to depression such as life events might have led to potential residual confounding; thus, causality of the observed associations is not established. Third, par-ticipants of the NutriNet-Santé study were volunteers in a nutrition-related cohort and thus more interested in nutritional issues and healthy lifestyles than the general population. In particular, their consumption of UPF may be lower than in the general population which may have led to an underestimation of the associations investi-gated in our study. In addition, excluding participants who completed only one CES-D questionnaire and par-ticipants with depressive symptoms at baseline might have resulted in excluding those most likely to have de-pressive symptoms. Similar analysis in this specific population should deserve further investigations. All this might have led to a selection bias and thus a potential bias in the risk estimates. As a result, any generalization of our findings should be done with caution. Important strengths of this study include its prospective design, the large sample, and the repeated assessment of depressive symptoms using a validated tool, as well as the quality of
the dietary data based on repeated dietary records allow-ing to assess usual dietary intakes. Finally, the wide range of confounding factors contributed to improve the validity of our findings.
Conclusions
In this prospective study, we found a positive association between the %UPF in the overall diet and the risk of in-cident depressive symptoms. Positive associations were also found for beverages and sauces or added fats, when %UPF in the food groups was investigated.
This study highlights a potential role of non-nutri-tional aspects of the diet in the depression development. Overall, there is a need to collect more detailed data on the degree of food processing and additive or contamin-ant contents in food surveys to better explore UPF con-sumption and its potential impact on health.
Additional files
Additional file 1:Table S1. Loading coefficients of the PCA-extracted dietary patterns. (PDF 13 kb)
Additional file 2:Table S2. Comparison of participants who completed one CES-D questionnaire to those who completed it at least two during follow-up, NutriNet-Santé study. (PDF 301 kb)
Additional file 3:Table S3. Comparison of included and excluded participants, NutriNet-Santé study. (PDF 132 kb)
Additional file 4:Figure S1. Dose-response association between ultra-processed food intake and incident depressive symptoms using Restricted Cubic Spline. (PDF 190 kb)
Additional file 5:Table S4. Association between ultra-processed food intake and incident depressive symptoms using other cut-off values to define depressive symptoms, NutriNet-Santé study. (PDF 134 kb)
Additional file 6:Table S5. Association between ultra-processed food intake (% of energy) and incident depressive symptoms, NutriNet-Santé study. (PDF 125 kb)
Additional file 7:Table S6. Association between ultra-processed food intake and incident depressive symptoms (considering as cases, only the participants who had depressive symptoms and also reported antidepressant treatment during follow-up), NutriNet-Santé study. (PDF 125 kb)
Abbreviations
BMI:Body mass index (kg/m2); CDS: Cognitive Difficulties Scale;
CES-D: Center for Epidemiologic Studies Depression Scale; CI: Confidence interval; CU: Consumption unit; HR: Hazard ratios; IPAQ: International Physical Activity Questionnaire; SD: Standard deviation; UPF: Ultra-processed food
Acknowledgements
We thank all the scientists, dietitians, technicians and assistants for their technical contribution to the NutriNet-Santé study. We especially thank Younes Esseddik, Thi Duong Van, Frédéric Coffinieres, Mac Rakotondrazafy, Régis Gatibelza and Paul Flanzy (computer scientists); and Nathalie Arnault, Véronique Gourlet, Dr. Fabien Szabo, Julien Allegre, Anouar Nechba and Laurent Bourhis (data-manager/biostatisticians). We also thank all the volunteers of the NutriNet-Santé cohort.
Funding
The NutriNet-Santé study is supported by the following public institutions: Ministère de la Santé, Santé publique France (SPF), Fondation pour la Recherche Médicale (FRM), Institut de Recherche en Santé Publique (IRESP), Fondation ARC pour la recherche sur le cancer, Région Ile-de-France (CORD-DIM), Institut National de la Santé et de la Recherche Médicale (INSERM),
Institut National de la Recherche Agronomique (INRA), Conservatoire National des Arts et Métiers (CNAM), and Université Paris 13. This study was supported by the metaprogram Did’it of INRA in the INNOV project. The funders or study sponsors had no role in the study design, data collection, analysis, interpretation of data, preparation of the manuscript, and decision to submit it for publication.
MA was supported by a doctoral fellowship from the Ecole Doctorale Galilée, Paris 13 University, Sorbonne Paris Cité. BS was supported by the French National Cancer Institute INCa and the“Fondation de France” foundation. Availability of data and materials
Data of this study are protected under the protection of health data regulation set by the‘Commission Nationale de l’Informatique et des Libertés (CNIL). The data are available upon request to Nathalie Pecollo (n.pecollo@eren.smbh.univ-paris13.fr) for review by the steering committee of the NutriNet-Santé study.
Authors’ contributions
MA and EKG wrote the statistical analysis outline, analyzed the data, and drafted and revised the paper. EKG has primary responsibility for the final content. EKG, BA, MT, and CJ participated in the development of the NOVA classification. SH, EKG, PG, BA, MT, and CJ designed the data collection tools, implemented the study, and monitored the data collection for the whole study. MA, CJ, BA, MT, CL, BS, SH, PG, KEA, and EKG critically revised the paper for important intellectual content. All authors have read and approved the final manuscript.
Ethics approval and consent to participate
The NutriNet-Santé study is conducted in accordance with the Declaration of Helsinki and was approved by the ethics committee of the French Institute for Health and Medical Research (IRB Inserm no. 0000388FWA00005831) and by the National Commission on Informatics and Liberty (CNIL no. 908450 and no. 909216). Electronic informed consent was obtained from all participants.
Consent for publication Not applicable. Competing interests
Cédric Lemogne has received honoraria for board membership from Lundbeck and for speaking at invited symposia from Janssen, Lundbeck and Otsuka Pharmaceuticals.
The other authors declare that they have no conflict of interests.
Publisher’s Note
Springer Nature remains neutral with regard to jurisdictional claims in published maps and institutional affiliations.
Author details
1Equipe de Recherche en Epidémiologie Nutritionnelle (EREN), Université
Paris 13, Centre d’Epidémiologie et Statistiques Sorbonne Paris Cité, Inserm (U1153), Inra (U1125), Cnam, COMUE Sorbonne Paris Cité, 74 rue Marcel Cachin, 93017 Bobigny, France.2Département de Santé Publique, Hôpital Avicenne, F-93017 Bobigny, France.3Faculté de Médecine, Université Paris
Descartes, Sorbonne Paris Cité, Paris, France.4Service de Psychiatrie et Addictologie de l’adulte et du sujet âgé, AP-HP, Hôpital européen Georges-Pompidou, Paris, France.5Institut Psychiatrie et Neurosciences, Inserm (U1266), UMR-S 1266, Paris, France.
Received: 14 September 2018 Accepted: 25 March 2019
References
1. GBD 2016 Disease and Injury Incidence and Prevalence Collaborators. Global, regional, and national incidence, prevalence, and years lived with disability for 328 diseases and injuries for 195 countries, 1990–2016: a systematic analysis for the Global Burden of Disease Study 2016. Lancet Lond Engl. 2017;390:1211–59.
2. WHO Fact sheet - Depression. World Health Organization. 2018.http://www. who.int/news-room/fact-sheets/detail/depression. Accessed 7 June 2018.
3. Post RM. Heading off depressive illness evolution and progression to treatment resistance. Dialogues Clin Neurosci. 2015;17:105–9.
4. Rahe C, Unrath M, Berger K. Dietary patterns and the risk of depression in adults: a systematic review of observational studies. Eur J Nutr. 2014; 53:997–1013.
5. Lai JS, Hiles S, Bisquera A, Hure AJ, McEvoy M, Attia J. A systematic review and meta-analysis of dietary patterns and depression in community-dwelling adults. Am J Clin Nutr. 2014;99:181–97.
6. Li Y, Lv M-R, Wei Y-J, Sun L, Zhang J-X, Zhang H-G, et al. Dietary patterns and depression risk: a meta-analysis. Psychiatry Res. 2017;253:373–82. 7. Molendijk M, Molero P, Ortuno Sanchez-Pedreno F, Van der Does W, Angel
Martinez-Gonzalez M. Diet quality and depression risk: A systematic review and dose-response meta-analysis of prospective studies. J Affect Disord. 2018;226:346–54.https://doi.org/10.1016/j.jad.2017.09.022Epub;%2017 Sep 23.:346–54.
8. Adjibade M, Lemogne C, Julia C, Hercberg S, Galan P, Assmann KE, et al. Prospective association between adherence to dietary recommendations and incident depressive symptoms in the French NutriNet-Santé cohort. Br J Nutr. 2018;120:290–300.
9. Wang J, Zhou Y, Chen K, Jing Y, He J, Sun H, et al. Dietary inflammatory index and depression: a meta-analysis. Public Health Nutr. 2019;22:654–60. 10. Luiten CM, Steenhuis IH, Eyles H, Ni Mhurchu C, Waterlander WE.
Ultra-processed foods have the worst nutrient profile, yet they are the most available packaged products in a sample of New Zealand supermarkets. Public Health Nutr. 2016;19:530–8.
11. Martínez Steele E, Baraldi LG, da C Louzada ML, Moubarac J-C, Mozaffarian D, Monteiro CA. Ultra-processed foods and added sugars in the US diet: evidence from a nationally representative cross-sectional study. BMJ Open. 2016;6:e009892.
12. Monteiro CA, Moubarac J-C, Cannon G, Ng SW, Popkin B. Ultra-processed products are becoming dominant in the global food system. Obes Rev. 2013;14:21–8.
13. Baraldi LG, Martinez Steele E, Canella DS, Monteiro CA. Consumption of ultra-processed foods and associated sociodemographic factors in the USA between 2007 and 2012: evidence from a nationally representative cross-sectional study. BMJ Open. 2018;8:e020574.
14. Julia C, Martinez L, Allès B, Touvier M, Hercberg S, Méjean C, et al. Contribution of ultra-processed foods in the diet of adults from the French NutriNet-Santé study. Public Health Nutr. 2018;21:27–37.
15. Ludwig DS. Technology, diet, and the burden of chronic disease. JAMA. 2011;305:1352–3.
16. Roca-Saavedra P, Mendez-Vilabrille V, Miranda JM, Nebot C, Cardelle-Cobas A, Franco CM, et al. Food additives, contaminants and other minor components: effects on human gut microbiota-a review. J Physiol Biochem. 2018;74:69–83. 17. Clapp M, Aurora N, Herrera L, Bhatia M, Wilen E, Wakefield S. Gut microbiota’s effect
on mental health: the gut-brain axis. Clin Pract. 2017;7:987.
18. da C Louzada ML, Baraldi LG, Steele EM, APB M, Canella DS, Moubarac J-C, et al. Consumption of ultra-processed foods and obesity in Brazilian adolescents and adults. Prev Med. 2015;81:9–15.
19. de D Mendonça R, ACS L, Pimenta AM, Gea A, Martinez-Gonzalez MA, Bes-Rastrollo M. Ultra-Processed Food Consumption and the Incidence of Hypertension in a Mediterranean Cohort: The Seguimiento Universidad de Navarra Project. Am J Hypertens. 2017;30:358–66.
20. Tavares LF, Fonseca SC, Garcia Rosa ML, Yokoo EM. Relationship between ultra-processed foods and metabolic syndrome in adolescents from a Brazilian Family Doctor Program. Public Health Nutr. 2012;15:82–7. 21. Fiolet T, Srour B, Sellem L, Kesse-Guyot E, Allès B, Méjean C, et al.
Consumption of ultra-processed foods and cancer risk: results from NutriNet-Santé prospective cohort. BMJ. 2018;360:k322.
22. Hercberg S, Castetbon K, Czernichow S, Malon A, Mejean C, Kesse E, et al. The Nutrinet-Sante Study: a web-based prospective study on the relationship between nutrition and health and determinants of dietary patterns and nutritional status. BMC Public Health. 2010;10:242. 23. Führer R, Rouillon F. The French version of the Center for Epidemiologic
Studies-Depression Scale. 4, 163-166. Psychiatr Psychobiol. 1989;4:163–6. 24. Radloff LS. The CES-D Scale: a self-report depression scale for research in the
general population. Appl Psychol Meas. 1977;1:385–401.
25. Touvier M, Kesse-Guyot E, Méjean C, Pollet C, Malon A, Castetbon K, et al. Comparison between an interactive web-based self-administered 24 h dietary record and an interview by a dietitian for large-scale epidemiological studies. Br J Nutr. 2011;105:1055–64.
26. Lassale C, Castetbon K, Laporte F, Camilleri GM, Deschamps V, Vernay M, et al. Validation of a web-based, self-administered, non-consecutive-day dietary record tool against urinary biomarkers. Br J Nutr. 2015;113:953–62. 27. Lassale C, Castetbon K, Laporte F, Deschamps V, Vernay M, Camilleri GM, et
al. Correlations between fruit, vegetables, fish, vitamins, and fatty acids estimated by web-based nonconsecutive dietary records and respective biomarkers of nutritional status. JAcadNutr Diet. 2016;116:427–38. 28. Le Moullec N, Deheeger M, Preziosi P, Monteiro P, Valeix P, Rolland-Cachera
M, et al. Validation of the photo manual used for the collection of dietary data in the SU.VI.MAX study. Cah Nutr Diététique. 1996;31:158-64. 29. NutriNet-Santé coordination. Table de composition des aliments - Etude
NutriNet-Santé. Paris: Economica; 2013.
30. Black AE. Critical evaluation of energy intake using the Goldberg cut-off for energy intake: basal metabolic rate. A practical guide to its calculation, use and limitations. IntJ Obes Relat Metab Disord. 2000;24:1119–30. 31. Monteiro CA, Cannon G, Moubarac J-C, Levy RB, Louzada MLC, Jaime PC.
The UN Decade of Nutrition, the NOVA food classification and the trouble with ultra-processing. Public Health Nutr. 2018;21:5–17.
32. Vergnaud A-C, Touvier M, Méjean C, Kesse-Guyot E, Pollet C, Malon A, et al. Agreement between web-based and paper versions of a
socio-demographic questionnaire in the NutriNet-Santé study. Int J Public Health. 2011;56:407–17.
33. INSEE. Definitions and methods. 2009.http://www.insee.fr/en/methodes/. Accessed 23 Feb 2015.
34. Lassale C, Péneau S, Touvier M, Julia C, Galan P, Hercberg S, et al. Validity of web-based self-reported weight and height: results of the Nutrinet-Santé study. J Med Internet Res. 2013;15:e152.
35. Hagstromer M, Oja P, Sjostrom M. The International Physical Activity Questionnaire (IPAQ): a study of concurrent and construct validity. Public Health Nutr. 2006;9:755–62.
36. Derouesné C. Empirical evaluation of the“Cognitive difficulties scale” for assessment of memory complaints in general practice: a study of 1628 cognitively normal subjects aged 45-75 years. Int J Geriatr Psychiatry. 1993;8:599–607. 37. McNair D, Kahn R. Self-assessment of cognitive deficits. In Assessment in
Geriatr Psychopharmacol, Crook T, Ferris A, Baltus R Eds., Mark Powley Associates, New Canaan, CT. 1983;137–43.
38. Andridge RR, Little RJA. A review of hot deck imputation for survey non-response. Int Stat Rev Rev Int Stat. 2010;78:40–64.
39. Willett W. Nutritional epidemiology. USA: OUP; 2012.
40. Schofield WN. Predicting basal metabolic rate, new standards and review of previous work. Hum Nutr Clin Nutr. 1985;39(Suppl 1):5–41.
41. Benjamini Y, Hochberg Y. Controlling the false discovery rate: a practical and powerful approach to multiple testing. J R Stat Soc. 1995;57:289–300. 42. Moubarac J-C, Batal M, Louzada ML, Martinez Steele E, Monteiro CA.
Consumption of ultra-processed foods predicts diet quality in Canada. Appetite. 2017;108:512–20.
43. Djupegot IL, Nenseth CB, Bere E, Bjørnarå HBT, Helland SH, Øverby NC, et al. The association between time scarcity, sociodemographic correlates and consumption of ultra-processed foods among parents in Norway: a cross-sectional study. BMC Public Health. 2017;17:447.
44. Martínez Steele E, Popkin BM, Swinburn B, Monteiro CA. The share of ultra-processed foods and the overall nutritional quality of diets in the US: evidence from a nationally representative cross-sectional study. Popul Health Metrics. 2017;15:6.
45. Akbaraly TN, Brunner EJ, Ferrie JE, Marmot MG, Kivimaki M, Singh-Manoux A. Dietary pattern and depressive symptoms in middle age. Br J Psychiatry. 2009;195:408–13.
46. Sánchez-Villegas A, Toledo E, de Irala J, Ruiz-Canela M, Pla-Vidal J, Martínez-González MA. Fast-food and commercial baked goods consumption and the risk of depression. Public Health Nutr. 2012;15:424–32.
47. Jacka FN, Cherbuin N, Anstey KJ, Butterworth P. Dietary patterns and depressive symptoms over time: examining the relationships with socioeconomic position, health behaviours and cardiovascular risk. PLoS One. 2014;9:e87657.
48. Cenit MC, Sanz Y, Codoñer-Franch P. Influence of gut microbiota on neuropsychiatric disorders. World J Gastroenterol. 2017;23:5486–98. 49. Choudhary AK, Lee YY. Neurophysiological symptoms and aspartame: what
is the connection? Nutr Neurosci. 2018;21:306–16.
50. Lohner S, Toews I, Meerpohl JJ. Health outcomes of non-nutritive sweeteners: analysis of the research landscape. Nutr J. 2017;16:55.
51. Zinöcker MK, Lindseth IA. The Western diet–microbiome-host interaction and its role in metabolic disease. Nutrients. 2018;10:365.
52. Grissa I, Guezguez S, Ezzi L, Chakroun S, Sallem A, Kerkeni E, et al. The effect of titanium dioxide nanoparticles on neuroinflammation response in rat brain. Environ Sci Pollut Res Int. 2016;23:20205–13.
53. Quines CB, Rosa SG, Da Rocha JT, Gai BM, Bortolatto CF, Duarte MMMF, et al. Monosodium glutamate, a food additive, induces depressive-like and anxiogenic-like behaviors in young rats. Life Sci. 2014;107:27–31. 54. Campos-Sepúlveda AE, Martínez Enríquez ME, Rodríguez Arellanes R, Peláez
LE, Rodríguez Amézquita AL, Cadena RA. Neonatal monosodium glutamate administration increases aminooxyacetic acid (AOA) susceptibility effects in adult mice. Proc West Pharmacol Soc. 2009;52:72–4.
55. Adams J, White M. Characterisation of UK diets according to degree of food processing and associations with socio-demographics and obesity: cross-sectional analysis of UK National Diet and Nutrition Survey (2008-12). Int J Behav Nutr Phys Act. 2015;12:160.