HAL Id: hal-02992367
https://hal-amu.archives-ouvertes.fr/hal-02992367
Submitted on 9 Dec 2020HAL is a multi-disciplinary open access archive for the deposit and dissemination of sci-entific research documents, whether they are pub-lished or not. The documents may come from teaching and research institutions in France or abroad, or from public or private research centers.
L’archive ouverte pluridisciplinaire HAL, est destinée au dépôt et à la diffusion de documents scientifiques de niveau recherche, publiés ou non, émanant des établissements d’enseignement et de recherche français ou étrangers, des laboratoires publics ou privés.
Biomechanical comparison of spinal cord compression
types occurring in Degenerative Cervical Myelopathy
Simon Lévy, Guillaume Baucher, Pierre-Hugues Roche, Morgane Evin,
Virginie Callot, Pierre-Jean Arnoux
To cite this version:
Simon Lévy, Guillaume Baucher, Pierre-Hugues Roche, Morgane Evin, Virginie Callot, et al.. Biome-chanical comparison of spinal cord compression types occurring in Degenerative Cervical Myelopathy. Clinical Biomechanics, Elsevier, 2020, pp.105174. �10.1016/j.clinbiomech.2020.105174�. �hal-02992367�
Biomechanical comparison of spinal cord compression
1
types occurring in Degenerative Cervical Myelopathy
2
Simon Lévy1-4, Guillaume Baucher4,5, Pierre-Hugues Roche4,5, Morgane Evin3,4, Virginie 3
Callot1,2,4, Pierre-Jean Arnoux3,4 4
5
Affiliations 6
1
Aix-Marseille Univ, CNRS, CRMBM, Marseille, France
7
2
APHM, Hopital Universitaire Timone, CEMEREM, Marseille, France 8
3
Aix-Marseille Univ, IFSTTAR, LBA, Marseille, France 9
4
iLab-Spine International Associated Laboratory, Marseille-Montreal, France-Canada 10
5
APHM, Hopital Nord, Neurosurgery Department, Marseille, France 11 12 Corresponding author 13 Pierre-Jean Arnoux 14
LBA, Faculté de Médecine Nord, Aix-Marseille Université 15
Bd Pierre Dramard 16
13916 Marseille cedex 20, France 17
Office: +334 91 65 80 06 | Email: pierre-jean.arnoux@ifsttar.fr 18
Abstract
1
2
Objective: To study spinal cord compressions occurring in Degenerative Cervical 3
Myelopathy (DCM) using a comprehensive biomechanical model defined by actual 4
features observed in patients, in a view to better understand the pathogenesis and further 5
predict patients evolution. 6
Methods: Anatomical MRIs from 20 DCM patients were collected. Compression indices 7
derived from spinal canal and spinal cord were measured at the compression site. Mean 8
values were compared to values reported in literature and to the Spine Model for Safety 9
and Surgery (comprehensive 3D finite element model of the spine), further used for
10
simulations. Based on those results, a 30% reduction in cord cross-sectional area at C5-11
C6 intervertebral disk was defined as the compression threshold inducing myelopathy. 12
Four main compression patterns were simulated. Median diffuse, median focal and lateral 13
compression types were modelled as a migration of the disk into the spinal canal evenly, 14
at the central line only and laterally, respectively. Circumferential type involved a 15
posterior compression by the ligamentum flavum. All constraints in spinal cord were 16
quantified along inferior-superior axis, along compression development and within atlas-17
defined spinal cord regions. 18
Results: Regardless of compression types, predominant stress was found along 19
anteroposterior axis but also along inferior-superior axis, attributable to a slight sliding of 20
the disk in that direction because of natural spine anatomical restrictions. Anterior GM 21
and WM regions globally received the highest stress while lateral pathways were the least 22
affected. Compression applied along the complete anterior side of the cord (median 23
diffuse) globally induced the highest constraints. Additional posterior compression by 24
ligamentum flavum (circumferential) might focus constraints in the anterior gray matter 25
region. Along inferior-superior axis, median diffuse and circumferential types showed a 26
peak of constraints at compression site while median focal and lateral types showed lower 27
constraints values but extending further. 28
Conclusion: Median diffuse type would be the most detrimental based on stress 29
amplitude. Anterior regions would be the most at risk, except for circumferential type 30
where posterior regions would be equally affected. Ischemia would be a significant 31
component in addition to applying constraints to explain the pathogenesis of DCM, in 32
particular for lateral pathways. Future work will look at patient-specific simulations and 33
relation with clinical symptoms. Biomechanical models could become strong predictors 1
of degenerative changes. 2
3
Keywords: spinal cord, spinal cord compression, biomechanical simulations, 4
degenerative cervical myelopathy, finite element modelling 5
1. Introduction
1
Degenerative Cervical Myelopathy (DCM) is the most common progressive non-2
traumatic disorder of the spinal cord (SC) in elderly population with a prevalence of 605 3
per million people in North America (1). Eighty-seven percent of global population above 4
60 years old is estimated to present one or more severely degenerated cervical levels (2). 5
DCM results from degenerative changes of the cervical spine with aging causing spinal 6
canal stenosis, cord compression and eventually myelopathy (i.e. SC-related neurologic 7
deficit). Degenerative changes are multiple and can happen concurrently or individually 8
(1). On the anterior side of the cord, intervertebral disk draining causing disk material 9
migration into the spinal canal, spondylitis with osteophytes development along with 10
hypertrophy of the posterior longitudinal ligament (PLL) progressively reduce the spinal 11
canal cross section. On the opposite side, the spinal canal is reduced by hypertrophy of 12
the ligamentum flavum. Compression is suspected to first disrupt tissue perfusion and 13
metabolism, which then leads to expanding tissue necrosis (cell loss, axonal 14
demyelination, Wallerian degeneration) (3–5). In addition to the chronic static cord 15
compression, everyday life neck motion (flexion, extension) is expected to add repeated 16
traumas to the cord (dynamic effects). However, the respective role of each process in 17
tissue degeneration yielding myelopathy remains unknown. The multiple processes 18
aforementioned induce a high variability in the patients’ clinical presentation and the 19
compression patterns observed on MRI or CT scans. Severity of symptoms is therefore 20
hardly predictable. 21
The SC compression process is intrinsically mechanical. Finite element models 22
are therefore very well suited to study SC compression processes occurring in DCM 23
degeneration. Several biomechanical studies already proposed DCM compression 24
models. Nishida et al (6) first studied the contribution of static and dynamic anterior 25
compressions of the cord for three different patterns (central, lateral, diffuse). Kim et al 26
(7) investigated the individual effects of different patterns of ossification of the PLL and 27
ligamentum flavum. Nishida et al then explored the static and dynamic effects of the 28
ossification of the PLL (8). Finally, Khuyagbaatar et al (9) modelled both single-level and 29
multi-level compressions caused by ossification of the PLL. 30
In all of these studies, the different processes involved were not simulated 31
concurrently. Resulting stresses were only analyzed based on visual assessment of the 32
stress maps or by quantification at a specific compression stage and level without 33
comparison across spinal pathways, compression development or inferior-superior (I-S) 1
axis. Moreover, models were often simplified with unnatural compression loading, which 2
is useful to identify the specific effects of a given process but could miss some important 3
features induced by the natural human anatomy. 4
In this work, simulations of the main compression patterns derived from clinical 5
MR exploration of 20 DCM patients were designed using a detailed and comprehensive 6
cervical SC model. Quantitative compression features measurements from MRI data and 7
derived from literature were integrated. All resulting constraints were analyzed along the 8
I-S axis, along compression development and across atlas-defined SC regions so as to 9
identify the specificity of each compression pattern. Such analysis can help understand 10
the multiple degenerative processes associated with DCM and identify the most 11
detrimental pattern. Those simulations could guide clinicians in the treatment, surgical 12
planning and/or prognosis of this pathology. 13
2. Material and Methods
1
2.1. Compression features from literature review 2
2.1.1. Most frequently affected level
3
Intervertebral disk level C5-C6 is the most frequently compressed level in DCM 4
patients (10,11). It is hypothesized to be due to the higher mobility of that segment 5
compared to others (12). It is also among the two segments with smallest anteroposterior 6
(A-P) spinal canal diameter (13). 7
2.1.2. Compression threshold inducing tissue degeneration
8
In literature, SC compression has been quantified using different morphological 9
measurements (Table 1). 10
First studies chose to measure the spinal canal A-P diameter. Arnold et al. (14) shows 11
a strong involvement of age and of this measure at C5 in myelopathy severity. According 12
to Fehlings et al. (4) based on such data, a diameter of less than 12 mm would be a critical 13
threshold in the development of DCM, while a normal cervical spinal canal diameter 14
would be around 17-18 mm (15,16). In close agreement, Adams and Logue (17) found an 15
average A-P spinal canal diameter of 11.8 mm in their DCM-only group, while the 16
average diameter without osteophyte was 17.2 mm and the average diameter in the 17
control group was 19.2 mm. Those values are also in agreement with Edwards and 18
LaRocca’ study (11) on narrow cervical spinal canal but they slightly differ from the 19
values reported in Burrows et al. (15) with a median sagittal canal diameter of 14.5 mm at 20
C5 in degenerative cervical spondylosis. Ogino et al. (13) also measured a larger critical 21
canal diameter with around 13 mm for the DCM group with respect to around 16 mm for 22
the control group at C5. 23
The Maximum Canal Compromise (MCC) and Maximum SC Compression (MSCC) 24
indices were also proposed to predict patients’ surgical outcome (18–22). MCC (resp. 25
MSCC) were calculated as % with di, da and db being the A-P
26
canal (resp. cord) diameters at compression level, at the nearest normal level above and 27
below compression level respectively. In DCM patients prior to surgery, reported MCC 28
mean values were 35.3% (N=71)(18) and 49.2% (N=114)(21); reported MSCC values 29
were 27.4% (N=71)(18), 33.9% (N=114)(21) and 31.5% (N=113)(23). However, the 30
calculation of those indices might be prone to substantial rater bias related to the 31
definition of the nearest normal levels above and below compression level, largely 1
depending on the number of compressed levels in the patient. 2
Compression assessment based on the SC Cross-Sectional Area (CSA) might be less 3
prone to bias and more directly related to the compression-induced tissue damage. 4
According to Penning et al.’ study (24), the critical SC compression threshold inducing 5
myelopathy is a CSA of ~60 mm2 measured inCT myelography at C5-C6 vertebral level, 6
corresponding to a 30% reduction in CSA compared to controls. Note that this threshold 7
is in agreement with the reported MSCC values on DCM. In their cohort of 113 DCM 8
patients in need of decompression surgery, Li et al. reported a mean CSA and MSCC of 9
51.15 mm2 and 31.5% respectively (23). 10
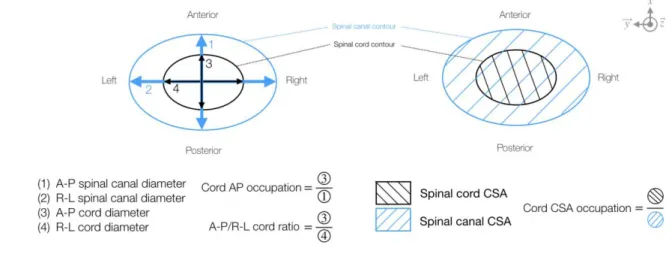
Finally, the A-P compression ratio has also been employed. It is the ratio of the A-P 11
diameter of the cord over its right-left (R-L) diameter (Figure 1). Li et al. measured a 12
mean ratio of 34.25% across the same cohort (23). However, this index was 13
unsuccessfully correlated to decompression surgery outcome. 14
2.2. Compression features from acquired MRI data 15
To complete and balance the data heterogeneity in literature regarding DCM features, 16
anatomical MR images of 20 diagnosed DCM adult patients acquired at 3T (Magnetom 17
Verio, Siemens Healthcare) at CEMEREM (La Timone Hospital, APHM, Marseille, 18
France) were retrospectively examined. 19
2.2.1. Most frequently affected level
20
C4-C5 and C5-C6 were the most frequent compression levels (N=8 respectively) in 21
the cohort. 22
2.2.2. Compression threshold inducing tissue degeneration
23
The morphological features of DCM compressions were inspected on T2*-weighted 24
and T1-weighted images. The following measurements were performed on T1-weighted 25
images at the maximum compression level: A-P and R-L spinal canal diameters, A-P and 26
R-L cord diameters (used to calculate A-P cord compression), spinal canal and cord 27
Cross-Sectional Area (CSA), cord A-P occupation (cord A-P diameter/canal A-P 28
diameter) and cord CSA occupation (cord CSA/canal CSA). Those indices are defined on 29
Figure 1. Measurements were performed manually using Horos (horosproject.org). 30
2.2.3. Elected compression features for simulations
1
Considering morphometric indices based on SC more directly related to the constraint 2
applying in it, and given the proximity between measurements derived from MRI data 3
and literature (see Table 1 and Results section), the SC CSA was elected to define the 4
compression threshold. A SC CSA of 70% with respect to the initial CSA (equivalent to a 5
30% CSA reduction) was defined as threshold inducing myelopathy at C5-C6 6
intervertebral disk level. 7
2.2.4. Observed compression types
8
Anatomical MRI images showed various compression patterns which were classified 9
into 4 main types (Figure 2) in agreement with previous studies (6,25,26): median and 10
diffuse (N=9), median and focal (N=2), lateral (N=5), circumferential (N=4). Note that 11
paramedian focal compressions (compression point not exactly in the median sagittal plan 12
of the cord, as shown in the MRI scan for median focal type in Figure 2) would be 13
included in median focal type. 14
2.3. Simulations 15
2.3.1. Finite element model description
16
The Spine Model for Safety and Surgery (27,28) was employed to simulate each type 17
of SC compression. This is a 3D finite element model of the spine made out of the CT 18
scan of a 32-year old healthy male human subject. It includes vertebrae, ligaments, 19
intervertebral disks, SC gray and white matter (GM, WM), spinal roots, dura and pia 20
matter, dentate ligaments and ganglion. GM and WM were modelled according to an 21
elastic law with tangent moduli of 1.67×10⁻¹ and 0.9×10⁻¹ MPa respectively (29). Their 22
geometry was defined based on a high-resolution MRI atlas (30). Anterior and posterior 23
GM regions as well as WM dorsal column, WM lateral motor, WM lateral sensory and 24
WM anterior spinal pathway regions were defined according to histological and MRI 25
atlases (31,32). SC sub-regions were modelled as a continuous mesh. SC was meshed 26
with tetrahedral elements, as were the Intervertebral Disk (IVD), made of a nucleus and 27
an annulus (28). The complete description of the model parameters used can be found in 28
Table 2. For clarity purposes, in the subsequent text, the posterior > anterior axis was 29
defined along , the right > left axis along and the inferior > superior axis along (see 30
Figure 2). 31
Since literature review and MRI data both showed that C5-C6 was the most 1
frequently affected level in DCM and since this study focused on single-level 2
compression, the cervical segment from C4 to C6 was extracted. It also enabled to remain 3
within acceptable simulation times and manageable memory size. 4
2.3.2. General simulation features
5
Simulations were designed with HyperMesh v17 and performed with RADIOSS v17 6
(Altair Engineering Inc., MI, USA). 7
C4 and C6 vertebrae were fixed. C5-C6 IVD and C5-C6 ligamentum flavum were 8
used to impose the SC loading with a given kinematic condition (see below). Constraints 9
on those entities were therefore not considered. To account for the quasi-static behavior 10
of the degenerative process, the kinetic energy relaxation was forced at each computing 11
step. 12
2.3.3. Diffuse median compression
13
All nodes of C5-C6 IVD were translated along about 9.9mm so as to reach a 70% 14
compression ratio in CSA at the compression site. 15
2.3.4. Acute median compression
16
C5-C6 IVD was divided into two groups of nodes. The central line (~6.5mm 17
thickness out of 20mm diameter) was translated by 9.8mm along while the remaining 18
nodes were translated by 7.9mm so as to reach a compression ratio of 70% and avoid 19
rupture of too many elements. 20
2.3.5. Asymmetric compression
21
C5-C6 IVD was divided into four groups of nodes. The most left part of the disk 22
(7.4mm thick), a central-left line (2.5mm thick), the central line (1.9mm thick) and the 23
remaining right part of the disk (7.6mm thick) were translated along by 11.2mm, 24
10.5mm, 8.5mm and 8.1mm respectively. Such design enabled us to create asymmetry in 25
the compression while still reaching a 70% compression ratio. 26
2.3.6. Circumferential compression
27
All nodes of C6 IVD were translated along by 4.4mm while all nodes of C5-28
C6 ligamentum flavum were translated along by 4.4mm. 29
2.4. Quantification 1
Stresses along X, Y, Z, shear stresses in XY, YZ, ZX and Von Mises stress were 2
extracted with HyperView v2017 and Compose v2019.2 (Altair Engineering Inc., MI, 3
USA). Data were processed with Python v3.6. 4
2.4.1. Study along inferior-superior axis
5
To mitigate outliers effect, the 95th percentile of each constraint absolute value within SC 6
at each millimeter was extracted for each compression type and plotted along the I-S axis. 7
The absolute value enabled to be independent from the axes direction definition. 8
2.4.2. Study across compression development course
9
For each simulation step, the 95th percentile of each constraint absolute value within the 10
whole SC was extracted for each compression type. 11
2.4.3. Study across spinal cord regions
12
The 95th percentile of each constraint absolute value within each of the 6 SC regions 13
(anterior and posterior GM, WM dorsal column, WM lateral motor, WM lateral sensory 14
and WM anterior pathways) was extracted for each compression type and pictured on a 15
transversal unwrapped SC map. Note that left and right regions were quantified together 16
to get rid of bias caused by potential asymmetry in compression types (e.g., lateral type). 17
3. Results
1
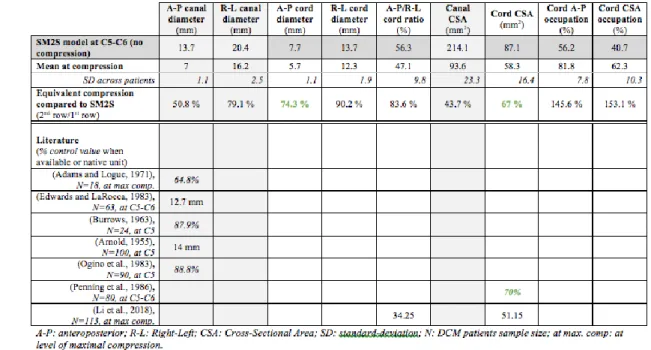
Mean spinal canal and cord measurements across patients performed on MRI data 2
were compared to literature data in Table 1. Those measurements were normalized to 3
initial SM2S model dimensions (1st row) to determine the equivalent compression in the 4
model. Compression indices based on spinal canal dimensions showed poor agreement 5
between our DCM cohort, SM2S model and literature data available. However, cord-6
based indices, and in particular, MSCC, A-P cord diameter and cord CSA showed a rough 7
agreement around a 30% compression value between the measurements performed on the 8
DCM cohort with respect to initial SM2S dimensions and literature data with respect to 9
controls (equivalent to an index value of 70% with respect to the uncompressed state). 10
The similarity obtained between the designed simulations and the observed DCM 11
compression patterns on transversal MRIs can be observed on Figure 2. The median 12
diffuse compression is mainly caused by the migration of a large portion of the disk into 13
the canal in addition to osteophyte development. The SC is pushed from its anterior side 14
to the posterior side of the canal. In the median focal type, the compression is more local, 15
predominantly caused by osteophyte developments or herniated disk, which was 16
modelled by a more prominent migration of the central A-P line of the disk. The lateral 17
compression is caused by an asymmetric degeneration of the disk and/or osteophyte 18
development; it was simulated by a more prominent migration of the left side of the disk. 19
Finally, the circumferential compression type involves an additional process: hypertrophy 20
and bulking of the ligament flavum induce a posterior stenosis of the spinal canal while 21
disk migration and/or osteophyte development constrict the cord anteriorly. 22
A sole observation of constraint maps (as in Figure 2) does not enable to detect 23
differences between compression types. For all types, GM appears as the structure with 24
the most constraints, which is attributable to its highest rigidity compared to WM. 25
Profiles along I-S axis look similar and so far, history of the compression development 26
process is missing. 27
The quantitative constraints profile along the I-S axis in the whole SC is presented 28
in Figure 3 for each compression type. Two profiles can be identified. Median diffuse and 29
circumferential types show a peak of the constraints at the level of compression whereas 30
median focal and lateral types show low constraint values but extending over a larger 31
height of the SC, spreading from upper C5 level down to lower C6. Such features would 32
not have been detectable with a sole qualitative observation of the constraints maps 33
(Figure 2), hence the value of the quantitative analysis. Median diffuse appears as the 1
compression type inducing the highest constraint to the SC tissue with a peak of the Von 2
Mises stress at 0.15MPa and of X (stress along ) at 0.14MPa. For all types, the highest
3
directional stress is along X while the highest shear stress is in the ZX plane. 4
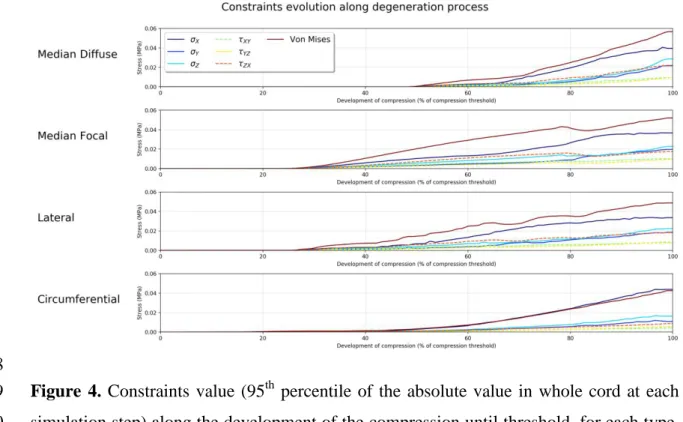
Figure 4 presents the evolution of constraints within cord along the development 5
of the pathology until compression threshold is reached. A linear rise of the constraints 6
can be observed with the development of the compression but at different pace according 7
to compression types. Constraints in SC start to increase earlier for median focal and 8
lateral types but at a slower pace than other types. Median diffuse show the latest rise of 9
the constraints and the fastest pace. Nevertheless, care has to be taken when comparing 10
those results as time scale and respective timings of individual degenerative changes are 11
unknown and may highly vary across population. Again, for all types, the constraints are 12
dominated by the stress along X and the shear stress in the ZX plane. 13
Figure 5 presents constraints analysis by SC sub-regions. Spinal pathways were 14
affected differently according to compression type. Globally, highest constraint values 15
were found for Von Mises and directional stresses. Shear stresses in XY and YZ planes 16
showed the lowest contributions. 17
The median diffuse type induced the most damage, mainly in GM and WM 18
anterior regions. Interestingly, this compression type also showed the highest shear stress 19
value in ZX plane (for the GM posterior horns). This type also showed the highest stress 20
along Z (within the anterior WM). 21
The median focal type also showed high X in the central regions of the cord
22
(anterior WM, GM and dorsal columns) but posterior GM horns were less affected than 23
with the diffuse type. 24
The lateral compression type showed a similar profile as the median focal type but 25
with lowest constraint values (Von Mises, X). Of note, although the compression pattern
26
is asymmetric, the lateral pathways were not the most affected. Highest constraints were 27
found in anterior regions. 28
Finally, the circumferential type almost showed no shear stress and constraints 29
were mainly the stress along X and Von Mises stress. Interestingly, the stress along X 30
was similarly distributed between anterior and posterior regions. Indeed, this compression 31
pattern was the one with the highest X in posterior GM horns and dorsal columns.
32 33
1 2 3
4. Discussion
1
In this work, biomechanical constraints applying in the SC during typical DCM 2
compressions were studied and the effect of compression pattern was investigated. In a 3
view to perform realistic simulations, compression features were defined based on MRI 4
data and morphological studies available in literature. A compression threshold inducing 5
myelopathy was defined based on the SC CSA and four compression patterns were 6
simulated using a detailed and comprehensive finite element model of the spine. 7
Differences in terms of I-S profile of the constraints at compression threshold, constraint 8
evolution along development of degenerations and constraints distribution across SC sub-9
regions were examined. 10
4.1. Main findings 11
Regardless of the compression type, the main constraints standing out were along the 12
A-P axis, as well as along I-S axis in anterior regions. In addition to the obvious A-P 13
compression, the anatomy (alignment between the disk and the opposite vertebrae 14
posterior part) might also induce a sliding of the disk in the I-S direction, resulting in 15
constraints along this axis as well. Moreover, GM is globally the most affected structure, 16
which is attributable to its higher rigidity compared to WM. This result is in agreement 17
with histologic and clinicopathologic studies reporting most severely affected central 18
GM, anterior cell loss and GM infarction in DCM patients (4,13). Also, interestingly, 19
ischemia and compression are thought to be additive causes to tissue necrosis. 20
Experimental studies in dogs demonstrated the combined effects of those two processes, 21
with anterior SC compression and ligation of segmental arteries (33), and with cervical 22
compression and obstruction of the arterial plexus (34). Ischemia clearly exacerbated the 23
pathologic effects of compression and yielded a particular vulnerability of corticospinal 24
tracts to injury. Such observation was substantiated by clinicopathologic studies reporting 25
that corticospinal tracts demyelination was one of the first pathological changes in DCM 26
(13). In light of those findings, our results suggest that lateral WM tracts damage 27
occurring in DCM cannot be explained by applying constraints only, but that ischemia 28
would be a necessary component to this process. 29
In agreement with previous biomechanical studies on DCM compressions (6,9), the 30
median diffuse type induced the highest constraints. Median focal and lateral types 31
differed especially regarding the constraints profile along the I-S axis, suggesting that SC 32
would need to be screened more carefully rostral and caudal to the compression site for 1
such compression patterns. This result can be explained by the more local compression; 2
the cord needs to be confined in a more restricted area, involving opposite forces applying 3
above and below the compression site to clench the cord. The circumferential type, 4
involving both anterior and posterior compression by hypertrophy of the ligamentum 5
flavum, exhibited particular constraints distribution across SC sub-regions. Very low 6
shear stresses were observed and constraints were mainly focused in the A-P axis. Effects 7
of ligaments ossification on the stress distribution in SC have been studied at thoracic and 8
cervical levels (7–9) but they have never been compared to other compression types with 9
identical spine models. Quantification results may substantially differ across models. The 10
current study enables to directly identify the specific effects of each type, and in 11
particular, the circumferential type would be the one inducing the highest constraints 12
along A-P axis in posterior GM horns. 13
Furthermore, this work investigated the evolution of stresses in SC as DCM 14
degenerations develop. Such analysis could guide neurosurgeons in defining the critical 15
time to prescribe surgery or in identifying the most detrimental degenerative changes. For 16
instance, results obtained here would suggest that lateral and median focal types take 17
more degenerative changes (displacement) or more time to set up and reach the threshold 18
defined as inducing myelopathy. However, to translate those results to real life, timings of 19
each degenerative process with respect to each other need to be known. But those 20
degenerative processes and their timing are very likely to vary across patients. 21
Simulations designed specifically on the patient morphology (patient-specific 22
simulations) would therefore be required to predict the pathology evolution. 23
Beyond that, this study proposes an exhaustive quantitative analysis of the constraints 24
at different scales (across degeneration process, I-S axis, SC regions) which, to the best of 25
our knowledge, has been rarely done in the literature, probably because of the large 26
memory size and lack of tools available for such study. However, such analysis is crucial 27
to explore and understand the tissue degeneration processes of this pathology. 28
4.2. Limitations and perspectives 29
Compressions occurring in DCM patients are highly variable, as are the symptoms. 30
For the study purposes, compression patterns were classified into 4 main types 31
Interestingly, this classification was found to be consistent across the literature (6,9). 32
However, real cases often mix those types either at different intervertebral levels or even 33
at a single level. Designing such compression patterns would come to patient-specific 1
simulations, relevant for report case studies. 2
The same compression threshold was defined for each type. However, given the 3
variability of constraints distribution, this threshold is likely to differ across types. No 4
data available in the literature enabled to provide an answer to this question. Further 5
investigations, in association with MRI examinations and patient-specific simulations, 6
will look at the definition of this threshold based on the actual constraints value applying 7
in the tissue, which might be a more direct surrogate than the CSA. Anyhow, indices 8
based on spinal canal dimensions appeared less reliable to define the myelopathy or 9
symptomatic threshold than indices based on SC dimensions because of a larger 10
variability. 11
In the current study, only static effects of compression were considered. Dynamic 12
effects (with repeated neck flexion and extension) are suspected to have a significant 13
impact on myelopathy development too. In a simplified model of the cervical spine, they 14
were shown to have a different effect on stress distribution in the cord (6) but this effect 15
was not quantified. Integration of such effects in the current model would be relevant. 16
Results suggest that the choice of tissue rigidity for GM with regards to WM have a 17
strong impact on the resulting stress values in those two structures. Even though limited 18
literature exists on this topic for human, three studies (two groups) agreed on a higher 19
stiffness of GM compared to WM, in bovine cervical cord by tensile testing (29,35) and 20
in mice SC using atomic force microscopic indentation and tensile measurements (36). 21
One study found no significant difference using pipette aspiration method in rabbit SC 22
(37). In this study, values reported for bovine cervical cord were used with higher 23
stiffness of GM (29). Although it is likely to observe the same behavior in humans, 24
everything has still to be shown. Therefore, stress values reported here can only be 25
considered relatively. In addition, if GM turned out to be less rigid than WM in humans, 26
results of these simulations might be challenged. 27
Furthermore, Koser et al. (36) reported significant difference in compression 28
measurements depending on tissue orientations, for both WM and GM. They even found 29
significant differences across GM regions, with the dorsal horn being stiffer than the 30
ventral horn, while WM would be transversely isotropic. Obtaining similar data for 31
human SC would refine the model and provide more insights for regional analysis. 32
The acknowledged hypothesis is that the main components in DCM pathogenesis are 33
(cervical compression inducing arterial obstruction causing ischemia) and additively 1
(ischemia exacerbating compression pathological effects) (4). For this reason, the study 2
focused on mechanical stresses and strain measurement were not included. Including 3
strain in such an analysis could bring more insights in the understanding of the pathology, 4
but this would require a more complex and accurate modelling than the elastic law used 5
here, with failure criteria. Unfortunately, such data are not available yet. 6
Impacts on tissue perfusion were not modelled in this study either. SC vascular 7
network is very complex and may vary across individuals. Moreover, the characterization 8
of its effect on the tissue mechanical properties is challenging. However, as described 9
earlier with regards to corticospinal tracts early demyelination, ischemia effects are a key 10
component in the pathogenesis of DCM. Ashareef et al. (38) implemented a simple model 11
of the anterior spinal artery and five of its branches to investigate how differently 12
anterior, posterior and anteroposterior compression would affect blood supply. One of 13
their main findings was that the perfusion disruption caused by the compression of the 14
main arteries could potentially be compensated by an increased blood flow in non-15
compressed arteries. However, effects of and on capillary network within tissue was not 16
investigated. This field of research still remains unexplored but would help refine the 17
model. 18
The time scale of degenerative changes leading to cord compression remains 19
unknown but clearly extends over several years and even decades. During this period of 20
time, as tissue gets more and more compressed, tissue degeneration also induces a change 21
in tissue properties. In this study, this change during development of the compression was 22
not taken into account and tissue properties were fixed during the entire length of the 23
simulations. We expect that it would only affect the constraints values but not the overall 24
trends and distributions observed. Regarding quantification more particularly, the 95th 25
percentile of the absolute constraints value was preferred over the maximum value here to 26
mitigate outliers’ effect but this index can yield slightly different values depending on the 27
considered regions. No gold standard has been agreed upon so far and studies rarely 28
mention the metric used. 29
Furthermore, only three vertebral levels were considered which limits the SC extent 30
along the I-S axis under investigation. Moreover, the compression consequently occurs at 31
unequal length from top and bottom of the model, which were fixed. A choice was also 32
made to leave the whole middle vertebral level (C5) free, neglecting potential constraints 33
from surrounding muscles. On the one hand, performing the same compression 34
simulations on a longer I-S extent of the model might let higher degrees of freedom to the 1
cord and increase the time necessary to reach compression threshold. On the other hand, 2
fixing intermediate vertebrae (or including neck muscles in the model) would reduce SC 3
mobility and help reach the compression threshold faster. 4
5. Conclusion
1
Integrating representative morphologic measurements of DCM compressions into 2
a comprehensive spine model and by means of an exhaustive quantitative analysis of the 3
constraints, different compression patterns were shown to induce different constraint 4
profiles along the I-S axis, along degenerative process development and across SC 5
regions. Median diffuse compression was found to be the most detrimental pattern, 6
causing the highest constraints with the fastest pace. Anterior GM and WM pathways 7
would be the most affected regions, except for circumferential compression where 8
posterior GM and dorsal columns would be equally at stake. In contrast, lateral WM 9
pathways demyelination observed in DCM would not be attributable to applying 10
constraints only, but to the combined effects of compression and ischemia. 11
Future work will look at patient-specific simulations in association with 12
microstructural assessment of the tissue by MRI in a view to define a threshold inducing 13
myelopathy based on actual applying constraints. In the near future, for patients showing 14
stenosis at the preclinical stage, reliable simulation models could be strong predictors of 15
potential deficits and could help prompt preventive surgery. Such an approach is in stark 16
contrast with the current policy as consensus still is to indicate decompression at the time 17
of clinical impairment without any guarantee for recovery. 18
6. Table and figure captions
1
2 3
4
Table 1. Compression indices compared between SM2S model at t=0 (row 1, dark gray 5
background), DCM patients group (rows 2, 3) and literature (row 5 and below). Row 4 6
reports the equivalent percentage compression of SM2S model if the mean compression 7
measured in patients is applied to the model. The compression indices found in literature 8
were reported in percentage with regards to controls when data were available (italic 9
format within table). For easier visualization, background of spinal canal-based indices 10
was colored in light gray. Agreement of cord-based indices around a value of 70% 11
compression (with regards to uncompressed value) was highlighted in green. 12
Compression indices are defined in Figure 1. 13
1 2
Table 2. Model parameters used for simulations. ρ: density (g.mm-3), E: Young’s 3
Modulus (MPa),: Poisson’s ratio, M: mass (g), K: stiffness (N), Et: tangent modulus
4
(MPa), (µ1, µ2): ground shear hyperelastic modulus (MPa), (): material exponent
5
parameters (MPa).
6
7
Figure 1. Definition of the compression indices measured on anatomical MRI data. 8
Diagrams represent a simplified transversal view of the cord (black outline) and spinal 9
canal (blue outline). A-P: anterior-posterior, R-L: right-left, CSA: Cross-Sectional Area. 10
1
Figure 2. Main compression types observed in the DCM group. First row shows 2
anatomical transversal MRIs (T2*-weighted scans). Red arrows indicate the compression 3
processes occurring as pointed out by the clinician. Second and third rows show the 4
transversal and sagittal views for the corresponding simulations (constraint maps are the 5
Von Mises stress). Anatomical markers are indicated on each image (A: anterior, P: 6
posterior, L: left, R: right). 7
8 9
1
Figure 3. Constraints value (95th percentile of the absolute value by millimeter) along the 2
inferior-superior axis for each compression type. The extent of each vertebral level is 3
indicated below. X, Y, Z: stresses along X, Y, Z; XY, YZ, ZX: shear stresses in plane 4 XY, YZ, ZX. 5 6 7 8
Figure 4. Constraints value (95th percentile of the absolute value in whole cord at each 9
simulation step) along the development of the compression until threshold, for each type. 10
x-axis corresponds to the simulation steps until compression threshold is reached. The
time sale of degenerative spine changes leading to DCM, which extends over several 1
years, and the respective timings of individual processes, are unknown. Therefore, care 2
should be taken when interpreting those results in terms of dynamics. X, Y, Z: stresses 3
along X, Y, Z; XY, YZ, ZX: shear stresses in plane XY, YZ, ZX. 4
1 2
Figure 5. Spinal cord regions analysis at compression threshold. Each constraint value 1
(95th percentile of the absolute value by region) were quantified and plotted by region on 2
an unwrapped transversal map. Region labels are indicated on the bottom left-hand 3
corner. Note that left and right regions were quantified together to get rid of bias caused 4
by potential asymmetry in compression types (e.g., lateral type). Color scale was defined 5
according to minimum and maximum values across all constraints and regions. X, Y, 6
Z: stresses along X, Y, Z; XY, YZ, ZX: shear stresses in plane XY, YZ, ZX. 7
8 9
7. Acknowledgements
1
The authors would like to sincerely thank Lauriane Pini, Claire Costes and Véronique 2
Gimenez-Derderian for MR examinations and study logistics as well as Patrice Sudres, 3
Tristan Tarrade and Maxime Llari for useful discussions. 4
This project has received funding from the European Union’s Horizon 2020 research and 5
innovation program under the Marie Skłodowska-Curie grant agreement Nº 0 lso 6
it has een carried out with the financial support of the Regional ouncil of rovence-7
lpes- te d’ zur and with the financial support of the *MIDEX (n° ANR- 11-IDEX-8
0001-02), funded by the Investissements d'Avenir project funded by the French 9
Government, managed by the French National Research Agency (ANR). 10
This work was performed within a laboratory member of France Life Imaging network 11
(grant ANR-11-INBS-0006) and supported by the CNRS (Centre National de la 12
Recherche Scientifique). 13
8. References
1
1. Nouri A, Tetreault L, Singh A, Karadimas SK, Fehlings MG. Degenerative Cervical 2
Myelopathy: Epidemiology, Genetics, and Pathogenesis. Spine. 2015 3
Jun;40(12):E675–93. 4
2. Matsumoto M, Fujimura Y, Suzuki N, Nishi Y, Nakamura M, Yabe Y, et al. MRI of 5
cervical intervertebral discs in asymptomatic subjects. The Journal of Bone and Joint 6
Surgery. 1998;80(1):6. 7
3. Ellingson BM, Woodworth DC, Leu K, Salamon N, Holly LT. Spinal Cord Perfusion 8
MR Imaging Implicates Both Ischemia and Hypoxia in the Pathogenesis of Cervical 9
Spondylosis. World Neurosurgery. 2019 Aug;128:e773–81. 10
4. Fehlings MG, Skaf G. A review of the pathophysiology of cervical spondylotic 11
myelopathy with insights for potential novel mechanisms drawn from traumatic 12
spinal cord injury. Spine. 1998 Dec 15;23(24):2730–7. 13
5. Ahuja CS, Wilson JR, Nori S, Kotter MRN, Druschel C, Curt A, et al. Traumatic 14
spinal cord injury. Nature Reviews Disease Primers. 2017 Apr 27;3:17018. 15
6. Nishida N, Kato Y, Imajo Y, Kawano S, Taguchi T. Biomechanical analysis of 16
cervical spondylotic myelopathy: The influence of dynamic factors and 17
morphometry of the spinal cord. The Journal of Spinal Cord Medicine. 2012 18
Jul;35(4):256–61. 19
7. Kim YH, Khuyagbaatar B, Kim K. Biomechanical effects of spinal cord compression 20
due to ossification of posterior longitudinal ligament and ligamentum flavum: A 21
finite element analysis. Medical Engineering & Physics. 2013 Sep;35(9):1266–71. 22
8. Nishida N, Kanchiku T, Kato Y, Imajo Y, Yoshida Y, Kawano S, et al. Cervical 23
ossification of the posterior longitudinal ligament: Biomechanical analysis of the 24
influence of static and dynamic factors. The Journal of Spinal Cord Medicine. 2015 25
Sep;38(5):593–8. 26
9. Khuyagbaatar B, Kim K, Park WM, Kim YH. Influence of sagittal and axial types of 27
ossification of posterior longitudinal ligament on mechanical stress in cervical spinal 28
cord: A finite element analysis. Clinical Biomechanics. 2015 Dec;30(10):1133–9. 29
10. Northover JR, Wild JB, Braybrooke J, Blanco J. The epidemiology of cervical 30
spondylotic myelopathy. Skeletal Radiol. 2012 Dec 1;41(12):1543–6. 31
11. Edwards W, LaRocca H. The developmental segmental sagittal diameter of the 32
cervical spinal canal in patients with cervical spondylosis. Spine. 1983;8(1):20–7. 33
12. Penning L. Normal movements of the cervical spine. American Journal of 34
Roentgenology. 1978 Feb 1;130(2):317–26. 35
13. Ogino H, Tada K, Okada K, Yonenobu K, Yamamoto T, Ono K, et al. Canal 36
diameter, anteroposterior compression ratio, and spondylotic myelopathy of the 37
cervical spine. Spine. 1983;8(1):1–15. 38
14. Arnold JG Jr. The clinical manifestations of spondylochondrosis (spondylosis) of the 1
cervical spine. Annals of surgery. 1955 Jun;141(6):872–89. 2
15. Burrows EH. The sagittal diameter of the spinal canal in cervical spondylosis. 3
Clinical Radiology. 1963;14(1):77–86. 4
16. Hayashi H, Okada K, Hamada M, Tada K, Ueno R. Etiologic factors of myelopathy. 5
A radiographic evaluation of the aging changes in the cervical spine. Clinical 6
orthopaedics and related research. 1987 Jan;(214):200–9. 7
17. Adams CBT, Logue V. Studies in Cervical Spondylotic Myelopathy: II. The 8
Movement and Contour of the Spine in Relation to the Neural Complications of 9
Cervical Spondylosis. Brain. 1971 Jan 1;94(3):569–86. 10
18. Fehlings MG, Rao SC, Tator CH, Skaf G, Arnold P, Benzel E, et al. The optimal 11
radiologic method for assessing spinal canal compromise and cord compression in 12
patients with cervical spinal cord injury. Part II: Results of a multicenter study. 13
Spine (Phila Pa 1976). 1999 Mar 15;24(6):605–13. 14
19. Arvin B, Kalsi-Ryan S, Karpova A, Mercier D, Furlan JC, Massicotte EM, et al. 15
Postoperative Magnetic Resonance Imaging Can Predict Neurological Recovery 16
After Surgery for Cervical Spondylotic Myelopathy: A Prospective Study With 17
Blinded Assessments. Neurosurgery. 2011 Aug 1;69(2):362–8. 18
20. Arvin B, Kalsi-Ryan S, Mercier D, Furlan JC, Massicotte EM, Fehlings MG. 19
Preoperative Magnetic Resonance Imaging Is Associated With Baseline 20
Neurological Status and Can Predict Postoperative Recovery in Patients With 21
Cervical Spondylotic Myelopathy: Spine. 2013 Jun;38(14):1170–6. 22
21. Nouri A, Tetreault L, Zamorano JJ, Dalzell K, Davis AM, Mikulis D, et al. Role of 23
Magnetic Resonance Imaging in Predicting Surgical Outcome in Patients With 24
Cervical Spondylotic Myelopathy: Spine. 2015 Feb;40(3):171–8. 25
22. Nouri A, Martin AR, Mikulis D, Fehlings MG. Magnetic resonance imaging 26
assessment of degenerative cervical myelopathy: a review of structural changes and 27
measurement techniques. FOC. 2016 Jun;40(6):E5. 28
23. Li X-Y, Lu S-B, Sun X-Y, Kong C, Guo M-C, Sun S-Y, et al. Clinical and magnetic 29
resonance imaging predictors of the surgical outcomes of patients with cervical 30
spondylotic myelopathy. Clinical Neurology and Neurosurgery. 2018 Nov 31
1;174:137–43. 32
24. Penning L, Wilmink J, van Woerden H, Knol E. CT myelographic findings in 33
degenerative disorders of the cervical spine: clinical significance. American Journal 34
of Roentgenology. 1986 Apr 1;146(4):793–801. 35
25. Fujiwara K, Yonenobe S, Hiroshima K, Fuji T, Ebara S, Yamashita K, et al. The 36
evaluation of viability of the spinal cord by CT myelography. Rinsho Seikei Geka. 37
1986;21(4):355–61. 38
26. Nishida N, Kanchiku T, Taguchi T. Biomechanical Analysis of Compressive 39
Myelopathy: The Influence of Morthometry of the Spinal Cord. In: Uchida K, 40
Nakamura M, Ozawa H, Katoh S, Toyama Y, editors. Neuroprotection and 1
Regeneration of the Spinal Cord [Internet]. Tokyo: Springer Japan; 2014. p. 75–82. 2
Available from: https://doi.org/10.1007/978-4-431-54502-6_7 3
27. El-Rich M, Arnoux P-J, Wagnac E, Brunet C, Aubin C-E. Finite element 4
investigation of the loading rate effect on the spinal load-sharing changes under 5
impact conditions. Journal of Biomechanics. 2009 Jun 19;42(9):1252–62. 6
28. Wagnac E, Arnoux P-J, Garo A, Aubin C-E. Finite element analysis of the influence 7
of loading rate on a model of the full lumbar spine under dynamic loading 8
conditions. Med Biol Eng Comput. 2012 Sep;50(9):903–15. 9
29. Ichihara K, Taguchi T, Shimada Y, Sakuramoto I, Kawano S, Kawai S. Gray matter 10
of the bovine cervical spinal cord is mechanically more rigid and fragile than the 11
white matter. Journal of neurotrauma. 2001;18(3):361–7. 12
30. Taso M, Le Troter A, Sdika M, Ranjeva J-P, Guye M, Bernard M, et al. Construction 13
of an in vivo human spinal cord atlas based on high-resolution MR images at 14
cervical and thoracic levels: preliminary results. MAGMA. 2014 Jun 1;27:257–67. 15
31. Standring S Gray’s natomy: The natomical Basis of linical ractice Expert 16
Consult - 40th Edition. 2008. 17
32. Lévy S, Benhamou M, Naaman C, Rainville P, Callot V, Cohen-Adad J. White matter 18
atlas of the human spinal cord with estimation of partial volume effect. NeuroImage. 19
2015 Spring;119:262–71. 20
33. Gooding MR, Wilson CB, Hoff JT. Experimental cervical myelopathy: effects of 21
ischemia and compression of the canine cervical spinal cord. J Neurosurg. 22
1975;43:9–17. 23
34. Shimomura Y, Hukuda S, Mizuno S. Experimental Study of Ischemic Damage to the 24
Cervical Spinal Cord. Journal of Neurosurgery. 1968 Jun;28(6):565–81. 25
35. Ichihara K, Taguchi T, Sakuramoto I, Kawano S, Kawai S. Mechanism of the spinal 26
cord injury and the cervical spondylotic myelopathy: new approach based on the 27
mechanical features of the spinal cord white and gray matter. Journal of 28
Neurosurgery: Spine [Internet]. 2003;99(3). Available from: 29
https://thejns.org/spine/view/journals/j-neurosurg-spine/99/3/article-p278.xml 30
36. Koser DE, Moeendarbary E, Hanne J, Kuerten S, Franze K. CNS Cell Distribution 31
and Axon Orientation Determine Local Spinal Cord Mechanical Properties. 32
Biophysical Journal. 2015 May;108(9):2137–47. 33
37. Ozawa H, Matsumoto T, Ohashi T, Sato M, Kokubun S. Comparison of spinal cord 34
gray matter and white matter softness: measurement by pipette aspiration method. 35
Journal of Neurosurgery: Spine. 2001 Oct;95(2):221–4. 36
38. Alshareef M, Krishna V, Ferdous J, Alshareef A, Kindy M, Kolachalama VB, et al. 37
Effect of Spinal Cord Compression on Local Vascular Blood Flow and Perfusion 38
Capacity. PloS one. 2014;9:e108820. 39