Critical requirements for NMDA receptors in experience-dependent plasticity in the visual cortex
by
Audrey Bing-Yu Chang
B.S., General Biology
University of California, San Diego, 1997
Submitted to the Department of Biology
in Partial Fulfillment of the Requirements for the Degree of Doctor of Philosophy in Biology
at the
Massachusetts Institute of Technology September 2007
© 2007 Audrey B Chang. All rights reserved.
The author hereby grants to MIT permission to reproduce and to distribute publicly paper and electronic copies of this thesis document in whole or in part.
Signature of A uthor... .... AudrefC hang Department of Biology C ertified by ... ... ... Susumu egawa Professor of Biology Thesis Supervisor A ccepted by ... ... ... ... .. ,... ... Stephen Bell Professor nf Rinlnov Chairman, Biology Graduate Committee
MASSACHUSETTS INSTITUTE.
t= T .F1dWNt"nI ev'"
SEP 0
7
2007
Critical requirements for NMDA receptors in experience-dependent plasticity in the visual cortex
by
Audrey Bing-Yu Chang
Submitted to the Department of Biology
in Partial Fulfillment of the Requirements for the Degree of Doctor of Philosophy in Biology
Abstract
NMDA receptors play an essential role in many forms of experience-dependent plasticity in the visual system. NMDA receptors support the ocular dominance (OD) shift,
development of receptive field properties in cortical neurons, and learning tasks associated with the visual cortex, as well as the cellular correlates of such plasticity measurements, ie long-term potentiation (LTP) and long-term depression (LTD).
Complete removal of NMDA receptors abolishes plasticity, while selective removal of NMDA receptors from distinct circuits in the visual system can reveal a more specific requirement and identify circuits required for plasticity. Using this approach, I aimed to delineate the brain circuits involved in two forms of experience-dependent plasticity.
First, I determined a layer-specific requirement for NMDA receptors in stimulus-specific response potentiation (SRP), which is a model for the plastic changes that may underlie perceptual learning. SRP acquisition requires NMDA receptors in the cortex, and it can be supported by expression of NMDA receptors in only deep layer 4 and layer 5. In contrast, this minimal expression of NMDA receptors did not support a paradigm for OD plasticity in adult mice. The contrasting requirements for NMDA receptors in these two forms of experience-dependent plasticity suggest that distinct forms of plasticity can be supported in separate cortical circuits.
Thesis Supervisor: Susumu Tonegawa Title: Professor of Biology
Acknowledgements
I am grateful to my thesis supervisors: Susumu Tonegawa, who gave me freedom and resources to explore modern neuroscience, and Mark Bear, who kindly became my advisor for these studies of plasticity in the visual cortex. I would also like to thank the members of my thesis committee: Dong-Feng Chen, David Housman, and Chip Quinn, who helped me to navigate through many projects over the years. I extend special thanks to Wenjiang Yu, for his technical assistance and spirited debates, and Mansuo Hayashi, a great bay-mate and friend who has given me years of valuable advice, both professional and personal. Thanks also go to members of the Tonegawa Lab, for discussions of science and life, and to members of the Bear Lab, who were exceptionally generous with their help and their equipment.
Finally, I thank my friends and my family. My graduate school classmates and my UCSD friend Valerie Sugiyama have helped to make graduate school an enjoyable time. Together, we have gone on many adventures and celebrated numerous holidays and life events. All my love to Fabian, Bruce, Sharon and especially Dad, who spent hours on the phone from California, giving me much-needed advice, insight and support throughout graduate school.
Table of Contents
Abstract
Chapter 1
General Introduction
Chapter 2
Experience-dependent visual response potentiation: a dissection of NMDA receptor function in distinct lamina of the visual cortex
Chapter 3
Spine morphology and ocular dominance: OD plasticity in dnPAK transgenic mice
Chapter 4
Layer-specific requirements for NMDA receptors in one measure of ocular dominance plasticity
Conclusions and Future Directions
Chapter 1
General Introduction
The brain responds rapidly to changes in experience. In the visual system, this feature is essential for adapting to changes in sensory experience. This adaptability, also called plasticity, is apparent when the visual system has been deprived of visual
experience or when the visual system has been exposed to new experiences in an
instructive manner. Both phenomena have been observed in humans, and the mechanisms underlying experience-dependent plasticity have been extensively studied in animal models. The visual system is well-suited to these experiments, because experience can be controlled by paradigms such as rearing an animal in darkness (dark rearing), or suturing the eyelid of one eye (monocular deprivation, or MD), or by exposing the animal to new visual patterns or scenes. In addition, the basic circuitry of the visual system is straightforward; information flows directly from the retina to the lateral geniculate nucleus (LGN) in the thalamus to the visual cortex. Inputs to the visual cortex generally converge on layer 4, which projects to layers 2/3. In turn, layers 2/3 project to other cortical areas, or to layer 5. Experience-dependent plasticity is thought to occur in the neurons and synapses in the visual cortex.
Ocular dominance plasticity
In the 1960's, David Hubel and Torsten Wiesel's pioneering experiments established ocular dominance (OD) plasticity as a model for experience-dependent changes. OD plasticity was first described in the visual cortex of juvenile cats (Wiesel
and Hubel, 1963b) and is characterized by the change in neuronal responsiveness after a period of monocular deprivation (MD). Under normal conditions, approximately 80% of cortical neurons in the cat are driven binocularly, although most neurons show an ocular dominance, and fire preferentially to input through one or the other eye (Hubel and Wiesel, 1959,, 1962). After MD, the neuronal response shifts to favor the non-deprived eye (Wiesel and Hubel, 1963b), even when the period of MD is as brief as 2 days (Olson and Freeman, 1975; Mower, 1991). Accompanying the functional shift in ocular
dominance are anatomical changes, which include shrinkage of LGN neurons that receive inputs from the deprived eye (Wiesel and Hubel, 1963a) and expansion of LGN afferents representing the non-deprived eye (Hubel et al., 1977; Shatz and Stryker, 1978). In the most simplistic model, these rearrangements at the LGN to layer 4 synapse are the basis for the OD shift, and instruct plastic changes in subsequent layers in an "inside out" sequence (Thompson, 2000).
Laminar analysis of cortical plasticity remains an active area of study. An alternate model postulates that reorganization begins in superficial layers of the cortex, and only later shapes the response in the input layer or subcortical structures
(Buonomano and Merzenich, 1998). Support for this model comes from several sources: in the visual cortex, brief MD causes an OD shift in the neurons in superficial layers, with no detectable change in layer 4 neurons (Trachtenberg et al., 2000). In addition,
functional changes in cortical neurons precede anatomical rearrangements of LGN axons, which are marked only 4-7 days after MD (Antonini and Stryker, 1993,, 1996). Finally, activity in horizontal connections between layer 2/3 neurons is thought to influence
formation of functional columns, independent of sensory experience (Ruthazer and Stryker, 1996; Crair et al., 1998).
OD plasticity is most robust during a brief period in early postnatal life (Hubel and Wiesel, 1970), after which the functional changes and anatomical rearrangements are not observed in layer 4. However, plasticity in superficial layers of the cortex is thought to mediate OD changes in adult animals. In older cats and monkeys, there are some reports that OD plasticity persists outside of layer 4 (Blakemore et al., 1978; Daw et al.,
1992). Superficial layers also show dramatic changes after retinal lesions in adult
animals, which are thought to be mediated by horizontal connections (Gilbert and Wiesel, 1992; Das and Gilbert, 1995) and not thalamocortical rearrangements (Darian-Smith and Gilbert, 1995). In addition, plasticity in the somatosensory cortex in adult animals seems to be mediated in superficial layers and not layer 4 (Fox, 2002).
Mechanisms of OD plasticity
What synaptic mechanisms underlie the OD shift? One possibility is that inputs from each eye compete for territory, and weak inputs from an eye deprived by MD lose the contest. A competitive mechanism could explain the effects of MD in juvenile animals, and is consistent with the observation that equal-sized eye-specific inputs are still formed after binocular deprivation (Hubel and Wiesel, 1965). On the other hand, a pure weak vs. strong competition would not explain how a deprived eye recovers during binocular visual experience (Mitchell and Gingras, 1998) or reverse suture, where the deprived eye is opened and the non-deprived eye is shut (Mitchell et al., 1977). Nor could competition between inputs explain why monocular inactivation, where the
non-deprived eye would be expected to win all, leads to a weaker shift than monocular deprivation (Rittenhouse et al., 1999).
Another possible mechanism invokes a homosynaptic learning rule, in which inputs from the 2 eyes are considered separately (Sengpiel and Kind, 2002; Bear, 2003). Here, the strengthening or weakening of inputs depends not on the relative strength of the two inputs, but rather on the activity and experience of the postsynaptic neuron. Thus, weak inputs from a deprived eye become depressed when the activity is too low, below a threshold of activity needed to strengthen the synapse. On the other hand, inputs from the non-deprived eye are active and correlated with the activity of the postsynaptic neuron, so these synapses are strengthened. The BCM theory expands the model further by postulating that the threshold of activity (or modification threshold, Om) needed for synaptic strengthening changes with prior experience (Bienenstock et al., 1982). Thus, a paradigm like dark rearing or a period of binocular deprivation lowers 0m such that less
activity is needed to strengthen the synapses. This is observed in long-term potentiation (LTP) and long-term depression (LTD) measurements, which are in vitro correlates for synaptic strengthening and weakening. Stimulation frequencies required to elicit LTP and LTD are different in dark-reared animals than in light-reared controls (Kirkwood et al., 1996). Finally, the BCM model can also explain the experimental observations that a deprived eye recovers after MD when the deprived eye is opened (Mitchell and Gingras,
1998) or when reverse suture is performed (Mitchell et al., 1977), although recovery depends on correlated inputs from the two eyes (Sengpiel and Kind, 2002).
LTP and LTD are correlates for the strengthening and weakening of eye inputs observed after MD. Thus, many of the cellular and molecular mechanisms are shared by
both systems. One mechanism is the requirement for NMDA receptors. NMDA receptors have a dual requirement of glutamate binding and sufficient depolarization to remove a Mg2+ ion from the channel pore, which means that pre and postsynaptic activity must be correlated. In the hippocampus, NMDA receptors were postulated to be coincident detectors for LTP, in a model for Hebbian plasticity. In the visual cortex, NMDA receptors are required for OD plasticity (Kleinschmidt et al., 1987; Bear et al.,
1990), as well as LTP (Artola and Singer, 1987,, 1990) and LTD (Kirkwood and Bear, 1994) in the visual cortex. Additional studies have monitored the expression of NMDA receptor subunits in different layers of the cortex across different ages (Fox et al., 1992; Catalano et al., 1997; Mower and Chen, 2003), in order to correlate NMDA receptors with juvenile and adult OD plasticity.
Insights from rodent models
Further understanding of the molecular mechanisms underlying OD plasticity has been enhanced by work in mice. The visual system in mice lacks some of the anatomical features found in the visual system of higher mammals, such as ocular dominance
columns (Drager, 1975). Also, 97% of projections are crossed, giving rise to a large monocular segment in the visual cortex, and a much smaller binocular region in which most neurons respond preferentially to the crossed, or contralateral, pathway.
Nonetheless, a brief period of MD in rodents shifts the ocular dominance in favor of the non-deprived eye (Drager, 1978), and, as in cats and monkeys, the OD shift is most easily elicited during a critical period in early postnatal life (Gordon and Stryker, 1996). Using genetically-modified mice, researchers have identified many molecules which are
required for OD plasticity. In addition to NMDA receptors (Sawtell et al., 2003), molecules associated with LTP and LTD have been shown to play a role (Daw et al,
2004). Other mechanisms implicated in juvenile OD plasticity include development of inhibitory neurons (Hanover et al., 1999; Huang et al., 1999), maintenance of
excitatory/inhibitory balance (Fagiolini and Hensch, 2000), and changes in structural plasticity that might correspond to synaptic rearrangements of deprived-eye inputs (Mataga et al., 2002; Mataga et al., 2004; Oray et al., 2004). Another mechanism related to structural rearrangements is the physical interactions of molecules in the extracellular matrix (Pizzorusso et al., 2002) and the presence of myelin (McGee et al., 2005), both of which appear to play a permissive role in OD plasticity. In particular, a juvenile-like OD
shift was uncovered in adult mice when these molecules were disrupted.
OD plasticity in adult rodents
OD plasticity in adult mice is an attractive model for experience-dependent
plasticity in mature animals, and could provide insight into adult learning, or recovery from disuse or injury. A robust response to MD in adult mice has been demonstrated using a variety of techniques, including single unit recordings (Fischer 2007), optical imaging of intrinsic signals (Hofer et al., 2006), induction of immediate-early genes (Pham et al., 2004; Tagawa et al., 2005) and visual evoked potentials (Sawtell et al., 2003; Lickey et al., 2004; Pham et al., 2004; Fischer et al., 2007). So far, studies in adult rodents have uncovered several mechanisms that restore juvenile-like plasticity to mature animals (Pizzorusso et al., 2002; Pham et al., 2004; McGee et al., 2005; He et al., 2006; Hofer et al., 2006). There are several differences between the adult and juvenile OD
shifts, indicating that adults require longer periods of MD to induce an OD shift (Frenkel et al., 2006; Hofer et al., 2006), that the shift is mediated by potentiation of non-deprived eye inputs rather than a loss of deprived eye inputs (Pham et al., 2004; Tagawa et al., 2005; Frenkel et al., 2006; Hofer et al., 2006), plasticity is sensitive to barbiturate
anesthesia, persistence of MD effects are reduced in adults (Pham et al., 2004). Some of these requirements, like length of MD, may depend on the technique used, for example Lickey et al (2004) measured a change in VEP amplitudes after only 2d of MD, while Hofer et al (2006) required 6-7d of MD before observing a change in optical signal. The strengthening and weakening of deprived-eye and non-deprived eye inputs depends on the number of days of MD (Frenkel and Bear, 2004), which may explain some of the variation in dynamics observed by different groups. There is also the possibility that each technique might measure different characteristics of the OD shift.
Visual Evoked Potentials
Of the techniques used to measure the OD shift in adults, VEP recordings have been the most commonly used. We also use this method in this thesis. There is some criticism that VEPs measure subthreshold activity, rather than the response properties of neurons, and changes in VEP amplitudes after MD may not have relevance to visual function (Hensch 2005). However, several reports suggest that VEPs reflect visual capability. (Porciatti et al., 1999) used VEPs to measure spatial resolution, whose behavioral counterpart is visual acuity. In humans, VEPs are used to measure functional properties of the visual cortex (Tyler et al., 1979). Notably, the VEP response in humans changes after monocular deprivation, caused by unilateral cataracts (Sloper and Collins,
1995), suggesting that VEP measurements reflect functional changes associated with impaired vision.
Stimulus-specific response potentiation (SRP), a correlate of perceptual learning. Another advantage of VEP recordings is the ability to implant chronic recording electrodes and take measurements in the same animal, before and after MD. The chronic recording technique led to the discovery of stimulus-specific response potentiation (SRP) (Frenkel et al., 2006), a novel plasticity paradigm in mice. SRP is characterized by an enhanced VEP response, upon repeated exposures to the same stimulus. This instruction-induced plasticity is a correlate for perceptual learning, which has been described in the visual system of higher primates (Fiorentini and Berardi, 1980; Karni and Sagi, 1993;
Schoups et al., 2001; Furmanski et al., 2004). SRP may be a mechanism for perceptual learning, so it is important to characterize molecular requirements and layer-specific requirements for this form of plasticity.
Summary
Here, I explore molecular mechanisms of two forms of experience-dependent plasticity in adult mice: SRP and OD plasticity. In Chapter 2, I describe spatial requirements for NMDA receptors in acquisition of SRP. Using genetically-modified mice in which NRI was deleted from specific cortical layers, I provide evidence that acquisition of SRP depends on NMDA receptors in the cortex, but SRP can still be acquired as long as NMDA receptors are expressed in deep layer 4 and layer 5. Chapters 3 and 4 address the molecular requirements of OD plasticity. In Chapter 3, I explore the
relationship between dendritic spine morphology and OD plasticity. Previous studies indicate that spine morphology and dynamics are affected by visual experience (Mataga et al., 2004; Oray et al., 2004; Wallace and Bear, 2004), but the functional significance of these changes, particularly in adult animals, is poorly understood. Here, I measured the
OD shift in adult mice from a transgenic line in which the dominant-negative form of the p21-activated kinase (dnPAK) was expressed late in postnatal life. In these mice, cortical neurons in layers 2/3 show abnormal spine morphology, which correlates with deficits in
LTD and enhanced LTP in the temporal cortex and corresponding memory deficits (Hayashi et al., 2004). The abnormal spine morphology did not, however, correlate with deficits in OD plasticity (see Chapter 3), suggesting that structural changes in spine morphology may have a more subtle effect on this form of plasticity. Another possibility
is that the OD shift is mediated by neurons in cortical layers where dnPAK was not expressed. In Chapter 4, I explore this possibility by using NMDA receptor mutant mice
in which the essential NR1 subunit has been removed from cortical layers 2/3, superficial layer 4, and layer 6. I present evidence that minimal expression of NMDA receptors in deep layer 4 and layer 5 is not sufficient to support OD plasticity, as measured by changes in induction of the immediate-early gene Arc. This finding indicates that deletion of NMDA receptors in superficial layers of the cortex has much more severe consequences for OD plasticity than does expression of dnPAK. In addition, this result highlights a major difference in spatial requirements for NMDA receptors in SRP and OD plasticity.
Chapter 2
Experience-dependent visual response potentiation: a dissection of NMDA receptor function in distinct lamina of the visual cortex
Abstract
The visual cortex in adult mice is highly responsive to changes in visual experience. One example of this experience-dependent plasticity is stimulus-selective response potentiation (SRP). SRP is an enhanced cortical response, measured by visual evoked potentials (VEPs), and observed only when awake, head-restrained mice are repeatedly exposed to the same visual stimulus. Here, we compare SRP measurements in 2 independent lines of conditional knockout mice to address critical requirements for SRP acquisition. In one knockout line, G35-3 NRI, the essential NRI subunit of the NMDA receptor is deleted from all layers of the cortex. SRP was absent in G35-3 NR1 mutant mice, indicating that SRP relies on NMDA receptor-mediated plasticity in the cortex. In a second knockout line, CW2-NRl, the NRI subunit is deleted in a layer-specific pattern that leaves NR1 signal only in deep layer 4 and layer 5 neurons. Interestingly, SRP is retained in CW2-NRI mice, suggesting that NMDA receptors in deep layer 4 alone are sufficient for SRP acquisition. These findings provide evidence of a layer-specific requirement for NMDA receptors in SRP in adult mice.
Introduction
A novel form of experience-induced plasticity was recently identified in the visual cortex of mice (Frenkel et al., 2006). Called Stimulus-specific Response Potentiation (SRP), this plasticity shares several qualitative similarities with perceptual learning (De Weerd et al., 2006). Both require repetitive exposure to a particular stimulus and are characterized by an enhanced response to the stimulus. In addition, the enhanced responses reach a plateau after repeated exposures, and the responses are retained in the absence of further stimulus presentation. Finally, the potentiation is specific to the orientation of the stimulus. Based on these similarities, Frenkel et al (2006) postulated that SRP is a correlate and possible mechanism for perceptual learning. A dissection of the neuronal circuits and molecules involved in SRP could also reveal critical elements of perceptual learning.
One molecular mechanism essential for SRP is signaling through the NMDA receptors. This was demonstrated by systemic injection of CPP, an NMDA receptor antagonist, which blocked SRP acquisition (Frenkel et al, 2006). The finding is consistent with other reports in which NMDA receptors are required for induction of synaptic plasticity in cortical slices (Kirkwood et al., 1993; Wang and Daw, 2003), and for evoked plasticity in anesthetized rats (Heynen and Bear, 2001; Clapp et al., 2006). More generally, NMDA receptors act as coincidence detectors and mediate numerous forms of synaptic plasticity all over the brain (Lynch, 2004). Although Frenkel et al's study (2006) confirmed that SRP is mediated by NMDA receptor signaling, it could not address which circuits in the visual system require them. In this study, we aimed to
identify the layers of the cortex where NMDA receptors play a crucial role in SRP. For this purpose, we adopted the strategy that has been used effectively in the dissection of mouse hippocampal functions (Tsien et al, 1996a; Nakazawa et al, 2003; McHugh et al, 2007). This spatially-restricted genetic deletion strategy resulted in a loss of plasticity at a specific set of hippocampal synapses and a behavioral impairment in specific aspects of learning and memory. Distinct memory processing could then be attributed to plasticity in specific regions of the hippocampus. Similarly, deletion of NMDA receptors in selected cortical layers was used here to identify the laminar site of the plasticity requirement for SRP.
Materials and Methods
Generation of Conditional NRI Knockout Mice
The CW2-NRI KO line was generated by crossing a forebrain-specific, aCaMKII promoter-driven Cre transgenic mouse line, referred to as CW2 (Zeng et al., 2001), with a second mouse line, the homozygous "floxed" NMDA receptor subunit-i (fNRI) line, in which two loxP sites flank the transmembrane domain and C-terminal region (exons 1 1-21), (Tsien et al., 1996). Founder mice (Cre/+, fNRI/fNRI) were crossed to homozygous fNRI mice (+/+, fNRI/fNR1) to produce CW2-NRI KO mutant (Cre/+, fNRI/fNRI) and CW2-NRI control (+/+, fNRI/fNR1) littermates. For this study, we used mutant mice at 4-5 months of age, in order to take advantage of the age-dependence of NR1 deletion in the cortex (Fukaya et al., 2003).
The G35-3 NRI KO mouse line was generated as described (Sawtell et al., 2003). In short, a Cre transgene driven by a BAC containing the promoter and upstream
-regulatory sequence of the kainate receptor subunit KA was crossed to the homozygous fNRI line. The progeny of this cross (Cre/+, fNR1/+) were then crossed to a third mouse line in which one allele of the NRI gene was deleted (Iwasato et al., 1997). These crosses produced G35-3-NRI KO mutants (Cre/+, fNRI/NRI null), and control
littermates (+/+, fNR1/NRI null). We used animals at 4-5 months old in order to match the age of the CW2-NRI mutant line.
In situ hybridization experiments.
In situ hybridization experiments for NR1 mRNA and orphan nuclear receptor RORP mRNA were performed on adjacent coronal sections from mice of all genotypes. Additional in situ hybridization experiments for Arc mRNA were also performed on neighboring coronal sections. Antisense oligonucleotide probes, corresponding to exon
11 of NRI, to the full-length cDNA of RORP (IMAGE Consortium Clone ID5358124, Open Biosystems), or to the first 200 bp coding sequence of Arc (generated by PCR, using the primers atggagctggaccatatgacc-3' and
5'-taatacgactcactatagggagaacctgtgcaaccctttcagc-3'), were generated by in vitro transcription (Riboprobe systems, Promega) and labeled with [33P]dUTP (Perkin Elmer). Probes were hybridized overnight to either cryostat sections (18 ýlm thick) or paraffin sections (8 [tm thick). Specificity of the hybridization was confirmed by an absence of signal when the
sense oligonucleotide was similarly labeled and hybridized. mRNA expression was verified by exposing the hybridized sections to a single x-ray film (Kodak BioMax) for 1 day. If the film indicated presence of hybridized probe, the sections were dipped in nuclear track emulsion (NTB-2, Kodak) and incubated at 40C in a light-sealed box for up
to 2 weeks. The sections were then developed in Kodak N 19 developer, fixed, counterstained with Mayer's hematoxyln and imaged under darkfield optics (Zeiss AxioVision).
Quantification ofNRI mRNA
NRI expression was quantified in the darkfield images using Matlab (The MathWorks, Natick, MA). We selected 5-8 coronal sections from 2 mice of each
genotype, selecting sections that contained V at comparable rostral/caudal levels. A laminar expression profile was constructed by averaging pixel intensities in a 300 Am wide region of V1. To control for variability across slides, each profile was normalized to the average pixel intensity of the superior colliculus of the same section. Based on reporter gene analysis in CW2-Cre mice (data not shown) and G35-3-Cre mice (Sawtell et al, 2003), NRI levels are not expected to change in the superior colliculus of either mutant line.
A similar procedure was followed to construct a laminar profile of RORP expression in adjacent sections. These profiles were normalized to the peak in layer 4.
The boundaries of the cortical layers were identified on the basis of cell morphology and RORP expression profile. As reported previously, the expression of RORP was largely restricted to layer 4 and a few scattered neurons in layer 5 (Schaeren-Wiemers et al., 1997). We defined the boundaries of layer 4 as the width of the peak at half maximum in the laminar RORP expression profile (see fig. I B). Layers 2/3 and the cell sparse layer 1 are positioned superficial to layer 4, while layers 5 and 6 are
positioned deep to layer 4. Additional subdivisions were approximated in layer 2/3, layer 4 for some of the analysis (see Results).
To facilitate comparison of expression profiles from individual sections, the average thickness of each layer was calculated for the whole dataset and each profile was scaled accordingly. To quantify the reduction of NR1 expression level in mutants, the averaged laminar profiles created for mutant slices was expressed as a percentage of the NRI levels in control animals, after subtraction of background signal in layer 1. Unless
otherwise indicated, the values are presented as pixel intensity values or percentages + standard error of the mean.
Arc induction assay
Under isofluorane anesthesia, mice were subjected to eyelid suture. Briefly, eyelids of the left eye were trimmed, and the eye was washed with saline and covered with opthalamic ointment. The eyelids were sutured with Vicryl, and secured with Vetbond. When the animals had recovered from anesthesia, they were placed in the dark for 24 hours, then exposed to light for 30 minutes to induce Arc expression. The animals were sacrificed, and the brains were removed immediately, embedded in OCT freezing media (TissueTek), and flash frozen on dry ice. The brains were stored at -800C, until cryostat sections of 18 prm were cut.
Electrode Implantation and Visual Evoked Potential Recordings.
We implanted adult mice (P120-P130) with tungsten microelectrodes (FHC, Bowdoinham, ME), as previously described (Sawtell et al., 2003). Mice were
anesthetized with Avertin (2-2-2 Tribromoethanol, dissolved in tert-amyl alcohol), and a local anesthetic of 1% lidocaine hydrochloride was injected subcutaneously. After trimming the scalp to expose the skull, a head post was affixed slightly anterior to bregma, and small burr holes were drilled in the skull bilaterally at approximately 3mm
lateral and I mm anterior to lambda (the intersection of the sagittal and lambdoid
450-500 microns from the surface of the exposed dura, and secured in place with cyanoacrylate.
Mice were allowed to recover for I day, and were habituated to the head restraint system for 15 minutes on the following day. Recording of visual evoked potentials (VEPs) in awake, head-restrained mice were initiated 3 days post-surgery. Each
recording session consisted of the presentation of a visual stimulus, which was a full-field sine wave grating of 100% contrast, 0.05 cycles/degree, and oriented at 00. The stimulus was presented in blocks of 100 presentations, in the following order: 1) 2 blocks
presented to both eyes of the mouse open, 2) 1 block presented to the right eye alone, 3) one block presented to the left eye alone, 4) 1 block presented to the right eye alone, 5)
one block presented to the left eye alone. In a given training session, each eye was exposed to 4 blocks of stimuli, of which 2 blocks were given to that eye alone. VEP measurements were collected from the binocular zone of Area V 1, quantified by
comparing the peak-trough amplitude (Sawtell et al., 2003), and averaged for the 2 blocks of stimulus presentation given to each eye.
Results
Spatially-restricted deletion of NRI in two independent mutant lines
In CW2-NRI and G35-3 NRI mutant mouse lines, the deletion of the NRI gene was restricted to the postnatal life (Zeng et al., 2001; Sawtell et al., 2003). We selected animals at 4-5 months of ages, based on a mutant similar to the CW2-NRI mouse (Fukaya et al., 2003), where NRI deletion spread to distinct layers of the cortex after 4 months. To determine the exact pattern of deletion of NR1 in the visual cortex, we performed in situ hybridization in both mouse lines and quantified levels ofNRI mRNA in each cortical layer.
In the G35-3 control mice, NRI mRNA was expressed in all layers of the visual cortex, except for layer 1 (see Fig. lA, 1B). Quantification of the NR1 signal showed that expression levels were uniform across all cell layers, except for a small dip in layer 5, (Fig. 1C), which likely reflects the lower density of neurons in layer 5 (Peters and Kara, 1985).
Similar to controls, NRI expression in the G35-3 mutant mice was present in all cortical layers, except for layer I (Fig. 1A, 1B). NRI mRNA levels were comparable across layers 2-6, but appeared lower than in controls. Indeed, direct comparison of the average laminar profile in G35-3 controls and mutants revealed a uniform decrease of NR1 mRNA over all cortical layers (Fig. I C). As shown in Figure ID, the reduction amounted to approximately 50% in all cortical layers. (Pixel intensity values for each layer: superficial layer 2/3, control = 0.62 ± 0.06, mutant 0.28 ± 0.03; deep layer 2/3, control = 0.66 ± 0.07, mutant = 0.32 ± 0.03; superficial layer 4, control = 0.64 ± 0.06,
mutant = 0.38 ± 0.03; deep layer 4, control = 0.65 ± 0.06, mutant 0.40 ± 0.04; layer 5, control = 0.50 ± 0.05, mutant 0.29 ± 0.03; layer 6, control = 0.58 + 0.04, mutant 0.31 + 0.02. n=17 sections for control, n=l 18 for mutant. p<0.001 for all comparisons between cortical layers in controls versus mutants, t-test).
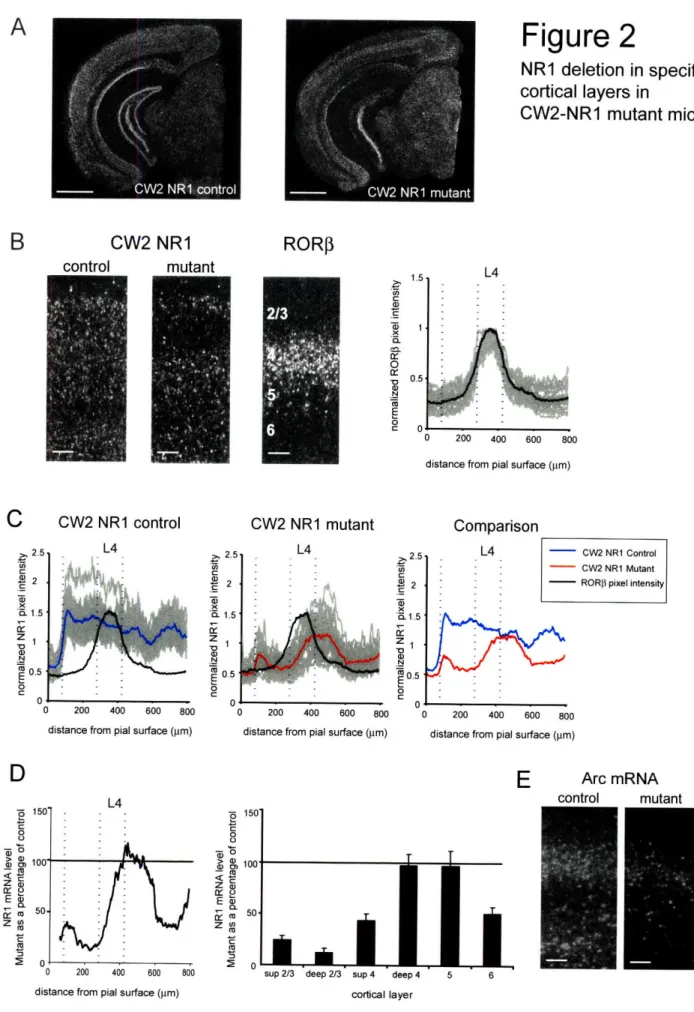
The NRI expression in CW2-NRI control mice was qualitatively (Fig. 2A, 2B) and quantitatively (Fig. 2C) similar to that of G35-3 NRI mice. In contrast, NRI
expression in CW2-NRI mutant mice was not uniform across all cortical layers (Fig. 2A, 2B). Comparison of laminar profiles from CW2-NRI controls and mutants showed a decrease in NRI levels in superficial and deep cortical layers, but no change in intermediate layers (fig. 2C). These intermediate layers were identified as layer 5 and deep layer 4, based on relative position to the RORP histogram, which encompasses all of layer 4. Other layers showed NR1 reduction by 50-80% of control levels, depending on the cortical layer (fig. 2D). (Pixel intensity values for each layer: superficial layer 2/3, control = 0.70 + 0.09, mutant 0.17 ± 0.03; deep layer 2/3, control = 0.71 ± 0.10, mutant = 0.09 ± 0.03; superficial layer 4, control = 0.67 + 0.09, mutant = 0.29 ± 0.04; deep layer 4, control = 0.61 + 0.09, mutant 0.60 ± 0.07; layer 5, control = 0.46 + 0.06, mutant 0.45 + 0.07; layer 6, control = 0.48 + 0.06, mutant 0.24 + 0.03. n=10 sections for control, n=12 for mutant. p<0.001 for superficial layer 2/3, deep layer 2/3, superficial layer 4; p<0.05 for layer 6; p>0.0 5 for deep layer 4 and layer 5; paired t-test).
To determine the boundaries of layer 4, we used a histogram of RORP signal (see methods). The RORP histogram encompasses signal from both layer 4 and layer 5, and it is possible that the peak of the histogram, used to define the boundaries of layer 4, might include RORP signal from layer 5. In that case, the width of layer 4 would be
overestimated, and the NRI signal measured in the CW2-NRI mutants could be attributed to NRI in layer 5 alone. To confirm the presence of NRI in deep layer 4 in CW2-NRI mutants, we subjected the mutant animals to an NMDA receptor-dependent assay. In this assay, the immediate-early gene Arc is induced in the visual cortex by placing mice in the dark for 24 hours and then briefly exposing them to light (Tagawa et al., 2005). Because Arc expression depends on NMDA receptors (Wang et al., 2006), Arc can be induced in CW2-NRI mutants only in the cortical layers where NMDA receptors remain. We probed Arc mRNA in cortical sections from control and mutant animals that were subjected to the Arc induction assay. Figure 2E shows that Arc levels are much diminished in CW2-NR1 mutants, but present in a middle band. As Arc expression is not induced in layer 5 (Tagawa et al., 2005), and see control section), we conclude that NRI remains in deep layer 4 and supports Arc induction there.
Correlation of NR1 deletion and SRP acquisition
To correlate loss of NRI mRNA in the cortex with function of the visual system, we measured SRP acquisition in both NR1 mutant lines. SRP is measured by the change in visual evoked potential (VEP) amplitudes after repeated exposures to a stimulus in the same orientation. In these experiments, we measured SRP acquisition through the contralateral and ipsilateral eyes separately. We used a stimulus oriented at 00 because the largest VEP amplitudes are observed at this stimulus orientation (Frenkel et al., 2006).
VEPs were measured in all genotypes, and no significant differences were observed between the VEP amplitudes on the first day of recording. (Figure 3a,
CW2-NRI control, n=6, contra 167.38 + 23.83 gpV, ipsi 60.04 + 4.51 gV; CW2-NRI mutant, n=l 1, contra 192.53 ± 20.69 lV, ipsi 63.08 ± 6.87 glV. G35-3 control, n=9, contra
163.49 ± 14.48 pV, ipsi 68.57 ± 10.80 gIV; G35-3 NRI mutant, n=4, contra 152.93 + 28.43 giV, ipsi 71.51 + 16.64 gV; ANOVA F(3,25), p = 0.53 for contra VEPs, p=0.74 for
ipsi VEPs).
SRP acquisition was observed in G35-3 control mice (final VEP amplitudes: contra 230.59 ± 18.48 [tV, ipsi 104.38 ± 13.70 tV; ANOVA F(5,8), p < 0.05 for contra
and ipsi VEPs), indicating that both contra and ipsi VEPs reached a maximum amplitude that was 1.5x the initial VEP amplitude (Fig. 3B). In contrast, no SRP was observed in G35-3 mutant mice (final VEP amplitudes: contra 152.30 ± 28.43 ptV; ipsi 71.51 ± 16.64
tV ; ANOVA F(5,3), p>0.05 for contra and ipsi VEPs) (Fig 3B). In G35-3 mutants, the
VEP amplitudes remained constant across repeated stimulus presentations, suggesting that a lack of 50% of NRI in the cortex could no longer support SRP.
To address whether NR1 in deep layer 4 and layer 5 alone would support SRP, we measured VEP amplitudes in CW2-NRI mutant mice. CW2-NRI control mice expressed SRP (final VEP amplitudes: contra 237.25 ± 40.52 1±V; ipsi 94.60 ± 13.44 giV; ANOVA
F(5,4), p <0.01 for contra and ipsi VEPs), reaching maximum VEP amplitudes that were
1.5X the initial amplitude (Fig 3C). Interestingly, CW2-NRI mutant mice showed SRP acquisition that was identical to that of control mice (final VEP amplitudes: contra 307.21
± 33.20 gIV; ipsi 107.10 ± 10.85 pV; ANOVA F(5,10o), p <0.01 for contra and ipsi VEPs),
suggesting that a NR1-mediated plasticity in a minimal circuit of deep layer 4 and layer 5 was sufficient to support SRP.
Discussion
Stimulus-selective response potentiation (SRP) bears qualitative similarities to perceptual learning, and we have used SRP as a model to study the mechanisms of NMDA receptor-mediated cortical plasticity that possibly underlie perceptual learning.
Here we report that SRP was blocked in G35-3 mutant mice, where cortical NRI is reduced by 50% throughout the cortical layers, except for layer 1. These data extend the observation that SRP is sensitive to systemic CPP administration (Frenkel et al., 2006), and show that NMDA receptors specifically in the cortex are required. Evidence for a cortical locus is supported by several features of SRP: first, there is no interocular transfer of SRP, suggesting that the modifications involve the LGN, where eye-specific inputs remain segregated. Second, the enhanced response in SRP is specific to stimulus-orientation, a feature that first appears in the primary visual cortex (Drager, 1975). Most significantly, SRP was blocked when cortical neurons were infected with a virus
containing a peptide inhibitor of GluRl insertion (Frenkel et al., 2006). Taken together, all the data suggest that geniculocortical synapses are involved in SRP, and NMDA receptors in the postsynaptic cortical neurons are required. In classic models of Hebbian plasticity, postsynaptic NMDA receptors function as coincidence detectors when both pre and postsynaptic sites are active (for review, see (Lynch, 2004). One example of this type of plasticity is long-term potentiation, or LTP, which has been demonstrated in the visual cortex in rodents (Heynen and Bear, 2001; Clapp et al., 2006). If NMDA receptors can function in this capacity in LTP, it is possible that they function similarly in SRP.
Data from G35-3 NR1 mutant mice address the role of cortical NMDA receptors, but SRP measurements could include potentiation of any synapses in the cortex, such as layer 4 to layer 2/3 or layer 2/3 to layer 5. However, data from CW2-NRI mutant mice suggests that NMDA receptor-dependent plasticity of other synapses in the cortex may not be required for SRP. In CW2-NRI mice, SRP acquisition was supported by NRI in layer 4 and layer 5. These were the only layers to retain normal levels of NRI; all other layers had a 50% or greater reduction in NRl. As the reduction of 50% ofNR1 was sufficient to block SRP in G35-3 mutants, we do not expect that any of the layers
showing this level of reduction in CW2-NRl mutants would support SRP. In particular, layer 2/3 shows an 80% reduction of NR 1, which may down-regulate synaptic plasticity to the levels too low to be physiologically functional at the postsynaptic sites of LGN-layer 2/3 and LGN-layer 4 to LGN-layer 2/3 synapses. In CW2-NRI mutants, NRI expression was not uniform across layer 4. We compared the NRI signal with a histogram of RORP signal made from adjacent coronal sections. Because strong RORP expression is confined to layer 4 neurons (Schaeren-Wiemers et al., 1997), we used the peak of the RORP histogram as a marker for layer 4. In estimating the boundaries of layer 4, we used only the width of the RORP peak where the signal was at half-maximum. This conservative estimate of layer 4 width is not expected to include contributions from other layers, particularly since RORP is only weakly expressed in layer 5 (see Figs. 1B, 2B). In CW2-NRI mutants, NRI was reduced in the superficial area of the RORP peak, and retained in the adjacent deep area. We confirmed that NRI signal in the deep area corresponded to layer 4, by using an Arc induction assay. Surprisingly, the loss of NRI in superficial layer 4 had no effect on SRP acquisition. One possible explanation would
be that total NRI levels in layer 4 were high enough to support SRP, even if the distribution was skewed towards deep layer 4. In rodents, layer 4 is a largely homogeneous layer of which approximately 90% of the neurons are small "star" pyramids (Peters and Kara, 1985). There are no apparent anatomical subdivisions between deep and superficial parts of layer 4, and no evidence that deep layer 4 contains a unique population of neurons that support orientation-specific tasks like SRP.
Nonetheless, it is interesting to note that orientation-selectivity in the cortical lamina of higher mammals is diverse. In monkeys, physiological evidence was recently found for a highly orientation-selective region within layer 4C, a sublayer that otherwise contains neurons with low orientation-selectivity (Gur et al., 2005). While primates and rodents clearly differ in both neuronal types and laminar organization of the cortex, it is tempting to speculate that rodents too could have more diversity within layer 4 than previously reported. Subtle differences between neurons in deep and superficial layer 4 in rodents might confer different requirements for orientation-specific tasks like SRP.
Figure 1
NR1 deletion across all cortical layers in G35-3 NR1 mutant mice G3 -3 coto.I RORP L4 C I a) ri I x, x a O n, a N 01 " 0 200 400 600
distance from pial surface (pm)
G35-3 NR1 control I4 2.5 -. 2 C . 1.5 Z 1 0o Vr n E "." 0 0 200 400 600
distance from pial surface (pm)
G35-3 NR1 mutant 2.5 -L4 2.5 2 .-1.5 S1 a , N M 0.5 E C01 0 200 400 600
distance from pial surface (prm)
2.5 2 L 1.5 z1 N. 00.5 E 0 C Comparison L4 I -- CW2 NR1 Control - CW2 NR1 Mutant
- RORP pixel intensity
0 200 400 600
distance from pial surface (pm)
150 .L4. 150 1 M o CL S100 C D 1 M0 so 0 5 2 0 2 0
0 200 400 600 Sup2/3 Deep2/3 Sup4 Deep 4 5 6
G35-3 NR1
r.nntrnl
G35-3 NRI mutant
i'
Ff"
Figure 2
NR1 deletion in specific cortical layers in CW2-NR1 mutant mice 0W 0R oto RORP IA 0 200 400 600 800 1.5 C0 'a 0.5 N 0distance from pial surface (pm)
CW2 NR1 control CW2 NR1 mutant 25 4 L4 ,2.5. , 2.5 2 a1.5 N E 0.5 0 200 400 600 800 0 200 400 600 800 0 200 400 600 800 0 200 400 600 800
distance from pial surface (im) distance from pial surface (plm)
Comparison
I - CW2 NRAl Cntrol
C- W2 NR1 Mutant
- RORP pixel intensity
0 200 400 600 800
distance from pial surface (pm)
Arc mRNA
control mutant
200 400 600 800 sup 2/3 deep 2/3 sup 4 deep 4 5 6
distance from pial surface (pm)
CW2 NR1 .ontrol C2 "E. 1.5 z 'a N 0.5 o .1 0 -o a, a)CO<mC•u z• E• C z ErU C 0 C-) > 0 a) 0D< zOCo CL Co Z, >a,
CW2 NR1 mutant
C 0v -0 ! cortical layerFigure 3
A. VEP Amplitudes, Day 1
CW2 control
LV"
CW2 mutant G35-3 control G35-3 mutant
AV/NV
* Contra Ipsi
CW2 control CW2 mutant G35-3 control G35-3 mutant
Genotype
250 -> 200 -~ s-= 150-E loo -o -.0 %4 11
Figure 3
SRP Acquisition in CW2-NR1 mutant mice
but not G35-3 NR1 mutant mice
B. G35-3 NR1 Mice
Control * Contralateral VEP O Ipsilateral VEP 0 1 2 3 4 5 6 Experimental DayC. CW2-NR1 Mice
Control 1 2 3 4 5 6 Experimental Day * Contralateral VEP O Ipsilateral VEP Mutant Experimental Day 0 1 2 3 4 5 6 Experimental Day Mutant--
¶.
0 1 2 3 4 5 6 --- - I- - - - - - -I I I I I I ...Figure Legend
Figure 1. NRI deletion across all cortical layers in G35-3 NRI KO mice.
A. Darkfield images, in situ hybridization on coronal sections from a 16-week old CW2-NR1 KO mouse and a control littermate, using a 33P-labeled NRI cRNA probe. Scale bar = 1 mm.
B. Laminar analysis of NR1 signal. Cortical cross-sections, probed with 33P-labeled NRI cRNA, were compared to adjacent sections probed with a RORP, a layer 4
enriched gene. Scale bar = 100 [tm. Densitiometric analysis of RORP signal, used to define boundaries of cortical layer 4 (dashed vertical lines). All values have been normalized to the maximal RORP signal. Black histogram represents an average of RORP signal in all individual sections.
C. Quantification ofNRI reduction in G35-3 NRI KO mice. Densitiometric
analysis of NR1 mRNA signal across the width of the cortex. The relative optical density of each section has been normalized to the signal level of the superior colliculus. Control (blue, n= 17) and mutant (red, n= 18) histograms represent an average of all individual sections. A histogram of RORO expression (black) was obtained from adjacent sections, and used to determine the boundaries of layer IV. Pixel intensity values for each layer: superficial layer 2/3, control = 0.62 + 0.06, mutant 0.28 ± 0.03; deep layer 2/3, control = 0.66 + 0.07, mutant = 0.32 ± 0.03; superficial layer 4, control =0.64 ± 0.06, mutant = 0.38 ± 0.03; deep layer 4,
control = 0.65 ± 0.06, mutant 0.40 ± 0.04; layer 5, control = 0.50 ± 0.05, mutant
control, n=l 18 for mutant. p<0.001 for all comparisons between cortical layers in controls versus mutants, t-test.
D. Summary of NRI quantification measurements. NRI signal in G35-3 NRI KO mice, expressed as a percentage of NRI signal in control mice. The NRI signal is significantly and uniformly reduced in all cortical layers.
Figure 2. NRI deletion in specific cortical layers in CW2-NRI KO mice.
A. Darkfield images of in situ hybridization on coronal sections from a 16-week old
G35-3 NRI KO mouse and a control littermate, using a 33P-labeled NRI cRNA
probe. Scale bar = 1 mm.
B. Laminar analysis of NR1 signal. Cortical cross-sections, probed with 33P-labeled
NR1 cRNA, were compared to adjacent sections probed with a RORP, a layer 4 enriched gene. Scale bar = 100 ltm. Densitiometric analysis of RORP signal, used to define boundaries of cortical layer 4 (dashed vertical lines). All values have been normalized to the maximal RORP signal. Black histogram represents an average of RORP signal in all individual sections.
C. Quantification of NRI reduction in CW2-NRI KO mice. Densitiometric analysis of NR1 mRNA signal across the width of the cortex. The relative optical density of each section has been normalized to the signal level of the superior colliculus. Control (blue, n=l 1) and mutant (red, n=13) histograms represent an average of all individual sections. A histogram of RORP expression (black) was obtained from adjacent sections, and used to determine the boundaries of layer IV. Pixel intensity values for each layer: superficial layer 2/3, control = 0.70 ± 0.09, mutant
0.17 + 0.03; deep layer 2/3, control = 0.71 + 0.10, mutant = 0.09 + 0.03; superficial layer 4, control =0.67 + 0.09, mutant = 0.29 ± 0.04; deep layer 4, control = 0.61 + 0.09, mutant 0.60 + 0.07; layer 5, control = 0.46 ± 0.06, mutant 0.45 ± 0.06; layer 6, control = 0.48 ± 0.06, mutant 0.24 ± 0.03. n=10 sections for control, n=12 for mutant. p<0.001 for superficial layer 2/3, deep layer 2/3, superficial layer 4; p<0.05 for layer 6; p>0.0 5 for deep layer 4 and layer 5; paired t-test.
D. Summary of NR1 quantification measurements. NRI signal in CW2-NRI KO mice, expressed as a percentage of NRI signal in control mice. The NR1 signal is significantly reduced in cortical layers 2/3, superficial layer 4, and layer 6.
E. Darkfield images of in situ hybridization, the Arc induction assay, using a 33p_ labeled Arc cRNA probe. Arc mRNA in the mutant (right) indicates the presence of NMDA receptors in layer 4.
Figure 3. SRP acquisition in CW2-NR1 KO mice but not G35-3 KO mice.
A. On the initial day of recording, VEP amplitudes from all genotypes are equal. Representative traces of contralateral and ipsilateral VEPs from each genotype, on initial day of recording. Scale bar, 50 pLV, 500 ms.
B. SRP acquisition is observed in both CW2-NRI control (n=5) and KO (n=l 1) mice. ANOVA, F(5, is, p<0.01 for both contralateral and ipsilateral VEPs in the control group, and ANOVA F(5,50), p<0.0001 for both contralateral and ipsilateral VEPs in the KO group.
C. SRP acquisition is not observed in G35-3 NRI KO mice (n=4), while SRP acquisition is observed in G35-3 NR1 control mice (n=9). ANOVA, F(5,40), p
<0.01 for both contralateral and ipsilateral VEPs in the control group, and ANOVA, F(5, 15), p>0.0 5 for both contralateral and ipsilateral VEPs in the KO
Chapter 3
Spine morphology and ocular dominance: OD plasticity in dnPAK transgenic mice
Abstract
Dendritic spines are likely to be the structural site of experience-dependent
plasticity in the sensory cortex. Dramatic changes in spine motility and morphology have been observed in the visual cortex during early postnatal development and beyond,
particularly in response to deprivation. The functional significance of these changes is not well-understood. To provide a link between altered spine morphology and plasticity in the visual cortex, we measured ocular dominance (OD) plasticity in transgenic mice that express a dominant-negative form of p21-activated kinase (PAK). dnPAK transgenic mice were reported to have abnormal spine morphology, consisting of increased numbers of large spines with wide heads, which correlated with altered synaptic plasticity and deficits in memory consolidation. The spine phenotype emerges only in adult dnPAK mice in cortical layers 2/3 and layer 6, offering a good model system for studying plasticity in the adult visual system, while avoiding effects of altered spine morphology on early brain development. Here, we measured OD plasticity in adult mice (P60), after 7 days of MD. The dnPAK mice showed a normal OD shift, as compared to control mice, suggesting that OD plasticity is not sensitive to consequences of altered spine morphology in layers 2/3 and layer 6.
Introduction
When rodents have been deprived of visual experience in one eye (monocular deprivation, or MD), neurons in the visual cortex shift their responsiveness to favor the non-deprived eye. This so-called ocular dominance (OD) shift is manifested in several ways, likely beginning with changes in the electrophysiological properties of cortical neurons (Gordon and Stryker, 1996; Sawtell et al., 2003; Frenkel and Bear, 2004; Fischer et al., 2007) and eventually leading to structural rearrangements of the thalamocortical afferents from the non-deprived eye (Antonini et al., 1999). At the same time, dramatic changes also occur in the dendritic spines of cortical neurons after MD (Mataga et al., 2004; Oray et al., 2004). Spines are highly-motile protrusions located along the dendrites of neurons, where they serve as the main postsynaptic component of excitatory synapses (Tada and Sheng, 2006). As such, spines have a close relationship with synaptic
plasticity; changes in spine size and shape often correlate with bidirectional synaptic changes such as LTP or LTD (Nagerl et al., 2004; Zhou et al., 2004), and with sensory experience in vivo (Trachtenberg et al., 2002; Majewska and Sur, 2003; Wallace and Bear, 2004; Holtmaat et al., 2006). Spine morphology may be the structural basis for synaptic plasticity (Alvarez and Sabitini, 2007). In the visual cortex, this model would link the increased spine motility (Oray et al., 2004) and spine pruning (Mataga et al., 2004) observed after MD with the electrophysiological changes that occur at the same time.
To date, no studies have provided definitive evidence that spine changes are involved in the OD shift in rodents. The closest evidence comes from mice that lack the tissue-type plasminogen activator (tPA) (Mataga et al., 2002; Mataga et al., 2004). A possible function of tPA is to prune spines in the apical dendrites of layer 5 neurons (Oray et al., 2004) or layer 2/3 neurons (Mataga et al, 2004), following MD. In tPA KO mice, the spine pruning after MD is gone (Mataga et al, 2004), as is the OD shift (Mataga et al, 2002). Both deficits were rescued by exogenously applied tPA, suggesting that tPA-mediated spine pruning might play a permissive role in the OD shift. While compelling, these results do not address the developmental consequences of early tPA deletion, which may be significant, considering that the endogenous tPA activity is highest just prior to the critical period (Mataga et al, 2004). If other functions of tPA (Melchor and Strickland, 2005) are impaired during development in the tPA KO mice, any of these deficits could also lead to the loss of the OD shift, independent of the spine pruning.
Stronger evidence that spine dynamics are a critical mediator of OD plasticity could be obtained from a mouse model in which spine characteristics were altered in adult life, after the critical period. To this end, we obtained transgenic mice that express a dominant-negative form of p21-activated kinase (PAK) in postnatal life. PAK mediates actin reorganization by functioning downstream from the small GTPases Rac and Cdc42, and inhibition of PAK by the transgene leads to altered spine morphology (Hayashi et al, 2004). In dnPAK mice, the transgene is expressed at low levels in early postnatal life so that PAK activity is not inhibited in mice at 3 weeks of age. By 8 weeks, however, increased levels of the transgene have led to preponderance of large spines in the cortex,
relative to control mice (Hayashi et al, 2004). We first aimed to confirm that OD plasticity was normal in juvenile mice (at 4 weeks of age). We then measured OD plasticity in adult mice (at 8 weeks of age) to determine how the adult-onset spine morphology phenotype would affect the OD shift.
Materials and Methods
Genetically-modified mice:
We obtained dnPAK transgenic mice, in which an 8.5 kb fragment of the
caCaMKII promoter drives expression of the autoinhibitory domain of the p21-activated kinase (PAK) gene (Hayashi et al., 2004). This transgene inhibits all 3 isoforms of PAK found in mice. Expression of the transgene at maximal levels leads to approximately
50% reduction of PAK activity in the cortex. The transgene expression is first detected at
P21, but the transgene levels remain low and no PAK inhibition is detected until P28. The striking spine morphology phenotype was observed in animals at P60 (Hayashi et al., 2004).
Electrode Implantation and Visual Evoked Potential Recordings.
We implanted adult mice with tungsten microelectrodes (FHC, Bowdoinham, ME), as previously described (Porciatti et al., 1999; Sawtell et al., 2003; Frenkel and Bear, 2004). Mice were anesthetized with Avertin (2-2-2 Tribromoethanol, dissolved in tert-amyl alcohol), and a local anesthetic of 1% lidocaine hydrochloride was injected subcutaneously. After trimming the scalp to expose the skull, a head post was affixed slightly anterior to bregma, and small burr holes were drilled in the skull bilaterally at approximately 3mm lateral and 1 mm anterior to lambda (the intersection of the sagittal and lambdoid sutures), above the binocular visual cortex. Electrodes were inserted approximately 450-500 microns from the surface of the exposed dura, and secured in place with cyanoacrylate.
Mice were allowed to recover for I day, and were habituated to the head restraint system for 15 minutes on the following day. Recording of visual evoked potentials (VEPs) in awake, head-restrained mice were initiated 3 days post-surgery. Each
recording session consisted of the presentation of a visual stimulus, which was a full-field sine wave grating of 100% contrast, 0.05 cycles/degree, and oriented at 00. The stimulus was presented in blocks of 100 presentations, in the following order: 1) 2 blocks
presented to both eyes of the mouse open, 2) 1 block presented to the right eye alone, 3) one block presented to the left eye alone, 4) 1 block presented to the right eye alone, 5) one block presented to the left eye alone.
One hemisphere was selected for OD analysis, and the eye contralateral to this hemisphere was sutured. For eyelid suture, the mice were anesthetized under isofluorane, and the upper and lower eyelids were trimmed. The eye was rinsed with saline and anti-bacterial opthalamic ointment was applied. The eyelids were then sewn shut with 3-4 mattress stitches, using Vicryl suture. Mice were allowed to recover from anesthesia, and returned to their home cage for 3d (mice at age P21) or 6-7 days (mice at age P60). Following the period of MD, the mice were again anesthetized under isofluorane and the sutures were removed. The eye was opened, cleaned, and the optics were checked for clarity. The mice were placed in the dark for 15-30 minutes to recover from anesthesia, and then exposed to 6 blocks of visual stimulus, in the same orientation as before MD. There was an additional recording session, in which the mice were exposed to 6 blocks of stimulus oriented at 900. VEPs were collected from the post MD recording session, as before, and compared to the pre-MD VEP measurements. Values are presented as VEP amplitudes (mV) + standard error of the mean.
Results
Ocular Dominance Plasticity
To assess the ocular dominance (OD) plasticity in dnPAK mice, we measured the change in visual evoked potentials (VEPs) that result from monocular deprivation (MD) (Porciatti et al., 1999; Sawtell et al., 2003; Frenkel and Bear, 2004). VEPs were recorded from the binocular zone of the visual cortex, in response to a sinuisoidal grating stimulus. The peak to trough amplitudes of the VEP waveform was measured both before and after MD. We used two experimental paradigms which have been shown previously to give different results (Sawtell et al., 2003; Frenkel and Bear, 2004; Frenkel et al., 2006). In the first paradigm, the orientation of the sinusoidal grating stimulus was the same before and after MD ("same orientation"). In the second, the orientation after MD was rotated by 900 ("different orientation") (Fig. 1). We used both experimental setups to probe for any differences between the plasticity in control and dnPAK mutant mice.
Normal OD plasticity in juvenile dnPAK mice
The dnPAK transgene is first detected in mutant mice one week after birth, although inhibition of the active form of PAK is not detected at 3 weeks of age.
Expression of the transgene reaches a maximum only at 8 weeks of age, corresponding to a 50% of active PAK (Hayashi et al., 2004). Presumably, the inhibition of PAK increases between 3-8 weeks of age, a time window that includes the critical period for sensitivity to monocular deprivation in mice (3-5 weeks of age, (Gordon and Stryker, 1996). We
first tested whether low or moderate levels of dnPAK expression would have any deleterious effects on OD plasticity at this critical age.
One measure of the OD shift is a change in the ratio of contralateral eye VEP amplitude to the ipsilateral eye VEP amplitude (C/I ratio), following MD (Porciatti et al, 1999; Frenkel and Bear, 2004). In normal mice, prior to MD, the VEP amplitudes obtained by stimulating the contralateral eye are 2.5-3 times higher than those obtained from the ipsilateral eye (Porciatti et al, 1999). This ratio reflects the contralateral eye dominance in the binocular zone of the visual cortex (Drager et al, 1975; Porciatti et al, 1999). Following MD of the contralateral eye, the ocular dominance shifts to favor the ipsilateral (open) eye inputs, and the C/I ratio drops close to 1. The decline in the C/I ratio can reflect a depression of contralateral (deprived) eye inputs, or a potentiation of
ipsilateral (open) eye inputs, or both.
In the "same orientation" paradigm, 3 days of MD in juvenile mice is reported to lead to a depression of contralateral eye VEPs (Sawtell et al., 2003). Starting with this paradigm, we measured the C/I ratio in juvenile control mice, using the same stimulus oriented at 00 for recordings performed before and after MD. After 3 days of MD, the C/I ratio was significantly reduced, indicating an OD shift (pre-MD, 2.68 ± 0.14; post-MD,
1.61 + 0.10; n = 20, Student's t-test, p <0.01) (Fig. 2A, left panel). Surprisingly, we found that the decline in C/I ratio was due to a potentiation of ipsilateral eye VEPs, while contralateral eye VEPs remained unchanged (VEP amplitudes: pre-MD, 191.21 ± 17.96 ALV; ipsi 71.58 ± 4.84 AiV; post MD, contra 187.48 ± 13.86 AiV, ipsi 120.55 ± 8.67 ApV, p =
Indeed, only when we used the "different orientation" paradigm (Frenkel and Bear, 2004) was the decline in the C/I ratio due to a depression of contralateral eye VEPs. Under these conditions, the shift in the C/I ratio after 3 days of MD was evident (C/I ratio: pre MD, 2.68 + 0.13; post-MD, 1.67 + 0.12; p << 0.01) (Fig. 3A, left panel). This time, the shift was due to a depression of contralateral eye VEPs, while ipsilateral eye VEPs remained unchanged (VEP amplitudes: pre-MD, contra 191.21 ± 17.96 jV and ipsi
71.58 ± 4.84 gV; post-MD, contra 106.54 ± 10.67 gV; ipsi 81.37 ± 7.54 gLV; p <0.01 for
contra; p = 0.18 for ipsi) (Fig. 3B, left panel).
After determining the dynamics of the C/I ratio in control mice, we tested juvenile dnPAK mutant mice. In the "same orientation" paradigm, dnPAK mutants showed a
shift in the C/I ratio that was slightly reduced, although this change was not significant (C/I ratio: pre-MD, 2.48 ± 0.10; post-MD, 1.88 ± 0.33; n=9; Student's t-test, p = 0.10) (Fig. 2A, right panel). Here, the reduction in C/I ratio was due to the significant potentiation of ipsilateral eye VEPs, as in control animals (VEP amplitudes: pre-MD, contra 165.33 ± 14.56 gV; ipsi 67.97 ± 7.31 tV; post-MD, contra 188.87 ± 27.16 iV; ipsi 142.13 ± 35.67 laV; p = 0.277 for contra; p < 0.05 for ipsi) (Fig. 2B, right panel).
Juvenile dnPAK mutant mice also showed a robust shift in the C/I ratio, in response to the "different orientation" paradigm (C/I ratio: pre-MD, 2.48 ± 0.10; post-MD, 1.44 ± 0.18, p<0.01) (Fig. 3A, right panel). Similar to control mice, the shift was
due to a depression of contralateral eye VEPs, (VEP amplitudes: pre-MD, contra 165.33
± 14.56 gV; ipsi 67.97 ± 7.31 pV; post-MD, contra 90.27 ± 15.08 1V; ipsi 70.53 ± 12.60