HAL Id: halshs-01655353
https://halshs.archives-ouvertes.fr/halshs-01655353
Preprint submitted on 4 Dec 2017
HAL is a multi-disciplinary open access
archive for the deposit and dissemination of sci-entific research documents, whether they are pub-lished or not. The documents may come from teaching and research institutions in France or abroad, or from public or private research centers.
L’archive ouverte pluridisciplinaire HAL, est destinée au dépôt et à la diffusion de documents scientifiques de niveau recherche, publiés ou non, émanant des établissements d’enseignement et de recherche français ou étrangers, des laboratoires publics ou privés.
Linking remittances with financial development and
institutions: a study from selected MENA countries
Imad El Hamma
To cite this version:
Imad El Hamma. Linking remittances with financial development and institutions: a study from selected MENA countries. 2016. �halshs-01655353�
Linking Remittances with FinanciaL
DeveLopment anD institutions: a
stuDy FRom seLecteD mena countRies
Documents de travail GREDEG
GREDEG Working Papers Series
Imad El Hamma
GREDEG WP No. 2016-38
http://www.gredeg.cnrs.fr/working-papers.html
Les opinions exprimées dans la série des Documents de travail GREDEG sont celles des auteurs et ne reflèlent pas nécessairement celles de l’institution. Les documents n’ont pas été soumis à un rapport formel et sont donc inclus dans cette série pour obtenir des commentaires et encourager la discussion. Les droits sur les documents appartiennent aux auteurs.
The views expressed in the GREDEG Working Paper Series are those of the author(s) and do not necessarily reflect those of the institution. The Working Papers have not undergone formal review and approval. Such papers are included in this series to elicit feedback and to encourage debate. Copyright belongs to the author(s).
Linking remittances with financial development
and institutions: a study from selected MENA
countries
Imad EL HAMMA⇤
GREDEG Working Paper No. 2016–38
Abstract
In this paper we reexamine the e↵ect of remittances on economic growth in Middle East and North Africa (MENA) countries. Using unbalanced panel data covering a sample of 12 MENA countries over the period 1984-2012, we studied the hypothesis that the e↵ect of remittances on economic growth varies depending on the level of financial development and institutional environment in recipient countries. We use GMM estimation in which we address the endogeneity of remittances. Our results reveal a complementary relationship among financial development and remittances to ensure economic growth. The estimations also show that remittances promote growth in countries with a developed financial system and a strong institutional environment.
Keywords: Remittances, economic growth, financial development, institutions quality. JEL codes: F24, F43, G29, O43
1
Introdcution
The increase in the volume of international migration over recent decades has led to an unprecedented increase in financial flows to labor-exporting countries. Indeed, inter-national migrant remittances have begun to be a significant source of external financing for developing countries. Only considering remittances passing through formal channels, the World Bank estimates that remittances reached US$ 440 billion in 2013 (World Bank, 2014). In fact, remittances sent to developing countries have increased spectacularly over the last three decades to represent the large majority of remittance flows today. Accord-ing to the World Bank (2014), formally recorded remittances sent to developAccord-ing countries reached US$ 325.5 billion in 2010. After a modest decline in 2009 because of the global financial crisis, the flow of remittances to developing countries was expected to grow at a lower but sustainable rate of 7-8 percent annually during 2013-2018 to reach US$ 550 billion by 2016. However, remittances benefit some regions more than others. With US$ 73 billion of remittances, the MENA region is one of the top remittance recipients in the world after East Asia and the Pacific, Latin America and the Caribbean.
However, the recorded data on remittances is imperfect and underestimates the true amount. On the one hand, many developing countries do not report remittance data in their balance of payments (e.g. Afghanistan, Cuba). On the other hand, since fees for sending money (for example, those of banking systems or established money transfer oper-ators) are relatively high, remittances are often sent via informal channels such as friends, relatives and the Hawala system. El-Qorchi, Munzele and Wilson (2003) argue that the informal flows are estimated to be very high, in the range of 10% to 50% of recorded remittances. Remittance fees are known to be high; the World Bank estimates the cost to be about 10% of the amount sent. At the same time, there is a huge variation in the fees depending on the. Migrants might access official services, but the high costs of operations may discourage others migrants with low revenue from sending small amounts. Moreover, financial services may be accessible to migrants, but this will not be the situation for the receivers. High costs are mostly due to socioeconomic factors, the financial market and government policy in the sending and the receiving countries.
In literature surveys, the macroeconomic e↵ects of remittances have been the subject of renewed attention in recent years. While some studies have provided evidence that remit-tances may increase investments (Woodru↵ and Zenteno, 2007 ; Giuliano and Ruiz-Arranz, 2009), make human capital accumulation easy (Edwards and Ureta, 2003 ; Rapoport and Docquier, 2005 ; Calero, Bedi and Sparrow, 2009 ; Combes and Ebeke, 2011), enhance to-tal factor productivity (Abdih et al., 2012) and alleviate poverty (Akobeng, 2016 ; Majeed, 2015 ; Adams Jr and Cuecuecha, 2013), other studies have pointed out that remittances may significantly reduce work e↵ort (Chami et al., 2005), create moral hazards (Gubert, 2002), accelerate inflation (Khan and Islam, 2013), and lead to Dutch disease e↵ects i.e. an appreciation in the real exchange rate accompanied by resource allocation from the traded sector towards the non-traded sector (Amuedo-Dorantes, Pozo and Vargas-Silva, 2010 ; Bourdet and Falck, 2006 ; Acosta, Lartey and Mandelman, 2009). However, the majority of these studies have only focused on the direct e↵ects of remittances and they do not incorporate the indirect e↵ects. In this literature, the authors regressed per capita growth on both the workers remittances and a set of control variables. Some of these control variables also include the channels through which remittances a↵ect growth. Such specifications are likely to give unreliable estimates because the channels may also capture
the growth e↵ects of remittances. Thus, migrants’ remittances may reduce the volatility of income, promote the financial sector and increase the quality of institutions. They can also promote both human and physical capital investment. The aim of this paper is to examine the indirect link between remittances and growth in MENA countries, looking specifically at the interaction between remittances and financial development, on the one hand, and between remittances and the level of institutional quality, on the other hand. To do this, a number of interaction variables have been included in the empirical investi-gations to gauge the best conditions in which remittances can involve economic growth.
Our several regressions show that a solid financial system and stable political environ-ment compleenviron-ment the positive e↵ect of remittances on economic growth. The remainder of this paper is organized as follows. The next section gives a literature survey of the relationships between remittances and economic growth. Section 3 describes the data, model specification and econometric technique. Section 4 discusses our empirical results, and finally, section 4 provides concluding remarks.
2
Literature survey
For the receiving countries, there are serval channels through which remittances may a↵ect economic growth. Remittances can increase the national disposable income, house-hold savings, domestic investment and the accumulation of physical and human capital. They can reduce the volatility of production and consumption. However, an excessive vol-ume of migrant’s remittances may a↵ect currency appreciation, which negatively a↵ects the competitiveness of exports or creates a moral hazard problem by inducing disincentives to work.
However, neither theoretical nor empirical studies have provided a conclusive answer regarding the e↵ect of remittances on economic growth. Faini (2002) provides evidence that remittances have a positive e↵ect on economic growth. However, Chami, Fullenkamp and Jahjah (2003) find a negative correlation between remittances and growth. The au-thors have argued that remittances are likely to substitute work for leisure, generally known as moral hazard. Lucas (2005) and the IMF World Economic Outlook (2005) crit-icize Chami’s study for not taking into account remittances’ endogeneity problem. In the Philippines, using Impulse Response Functions and annual data for 1985-2002, Burgess and Haksar (2005) report a negative indication between remittance and growth measured by the growth rate of the Gross Domestic Product (GDP) per capita. However, Ang (2009) concludes that the overall impact of remittances on growth is positive for the same country. Ziesemer (2012) provides a study suggesting that the e↵ect of remittances on economic growth is more visible in low-income countries (income lower than 1200 $US per capita). Moreover, the author shows that the growth rate is two percentage points higher in the presence of remittances. For Latin American countries, Mundaca (2009) uses the domestic bank credit as a regressor to examine the e↵ect of remittances on growth. She also finds a positive e↵ect of remittances on economic growth. According to the author, a 10% increase in remittances (as a percentage of the GDP) contributes to increasing the GDP per capita by 3.49%. When she removes domestic bank credit from the equation, the GDP per capita increases only by 3.18%.
that the impact of international remittances on economic growth is negative. However, countries with good governance have more opportunity to unlock the potential for re-mittances to improve economic growth. In a related study, using annual panel data for 64 African, Asian, and Latin American-Caribbean countries from 1987–2007, Fayissa and Nsiah (2012) find that there is a positive relationship between remittances and economic growth throughout the whole group. In contrast, Ahamada and Coulibaly (2013) report that there is no causality between remittances and growth in 20 SSA countries. Adams and Klobodu (2016) using the General Method of Moments estimation technique, examine the e↵ect of remittances and regime durability on economic growth find that remittances do not have a robust impact on economic growth in SSA.
Until the last decade, most empirical studies seemed to neglect other channels through which remittances can stimulate economic growth. As we stated above, remittances can increase the volume of disposable income and savings. Thus, they can stimulate the invest-ment rate and hence economic growth. In Pakistan, Adams, Jr (2003) shows that interna-tional remittances have a positive e↵ect on the saving rate. For the author, the marginal propensity to save for international remittances is 0.71, while the marginal propensity to save on rental income is only 0.085. Moreover, the author demonstrates that the Pakistani households receiving remittances have a very high propensity to save, and the e↵ect of remittances on growth could be amplified if remittances are channeled by the banking sector. In Kyrgyzstan, Aitymbetov (2006) finds also that remittances positively a↵ect economic growth because about 10% of transfers are invested. Woodru↵ (2007) confirms the finding since he finds a positive relationship between investment and the creation of micro-enterprises. For the author, 5% of remittances received are invested in this type of company. In long term, they can be seen as a ”growth locomotive” because they improve the labor supply. Finally, in five Mediterranean countries, Glytsos (2005) investigates the impact of exogenous shocks of remittances on consumption, investment, imports, and output. He builds a Keynesian model in which he includes the remittances as part of disposable income and finds a positive e↵ect of income on consumption and imports. For the author, the e↵ect of remittances on growth passes through the income disposable and investment channels.
These empirical studies investigate the direct e↵ect of remittances on the determinants of economic growth. However, other researchers have investigated the indirect e↵ect by incorporating an interaction terms between international remittances and other variables that could complement the direct e↵ect in stimulating growth. Fajnzylber et al. (2008) explores for Latin American countries the remittances’ e↵ect on real per capita growth. The authors include as a regressor a term of interaction between remittances and human capital, political institutions and the financial system depth. They find a negative indica-tion of the remittances’ coefficient and a positive indicaindica-tion of the interacindica-tion term when human capital and institutions are included. However, the remittances coefficient has a positive indication and the interaction term has a negative indication when financial sys-tem depth is included. Fajnzylber et al. (2008) conclude that human capital accumulation and improvement in institutional quality enhance the positive e↵ect of remittances on eco-nomic growth. But financial depth substitutes for international remittances in stimulating growth. On the basis of these findings, remittances are considered to be ine↵ective in en-hancing economic development in countries where institutions are weak or where there is low human capital accumulation. Giuliano and Ruiz-Arranz (2009) conducted a study similar to Mundaca’s. They used financial development in interaction with remittances
as regressor and found that remittances may ease credit constraints on the poor, increase the allocation of capital, and substitute for the absence of financial development. In addi-tion, Bettin and Zazzaro (2012) include an interaction variable (remittances multiplied by bank efficiency index) and find a complementary relation between remittances and finan-cial development (i.e. remittances have a positive indication and the interaction term has a negative indication). Like Giuliano and Ruiz-Arranz (2009), Catrinescu et al. (2009) use political and institutional variables as terms of interaction with remittance. The au-thors, using the Anderson-Hsio estimator, found a positive relation between transfers and growth. However, Barajas, Chami and Fullenkamp (2009) use microeconomics variables as instruments to thwarting potential endogeneity between remittances and growth. They find non-significant direct e↵ects of growth of remittances in an estimate for a panel of 84 developing countries.
The literature review reveals that the e↵ect of remittances on economic growth is influenced by the observed and in observed countries specific e↵ect, the endogeneity of remittances and by the econometric specification. Accordingly, we control for this factor in our analysis and also take into consideration the level of political environment in MENA countries. The model specification and the econometric technique are described next.
3
Model specification and econometric technique
3.1 Estimation method
To examine the links among remittances, financial development, institutional quality and economic growth, we have used an extended version of the growth model of Barro (1991 ; 1996) and Imai et al. (2014). The following reduced-form regression is used:
W GDPit= ↵0+ 1Remit+ ✓Xit+ ⌘t+ ⌫i+ ✏it (1)
Here, WGDPit indicates the (logarithm of) growth of real GDP per capita in country i
at time t. REMit is the key explanatory variable referring to the ratio of the remittances
to GDP. Remittances are the current transfers sent by resident or nonresident workers to the country of origin. ⌘tis the time specific e↵ect, ⌫i an unobserved country specific e↵ect
and ✏itis the error term. Xit contains a standard set of determinants of economic growth.
As a starting point, we do not include any variables for financial development or institutional quality. However, in a second set of regressions, we test the hypothesis that the responsiveness of economic growth to remittances depends on the level of financial development and the level of institutional quality. In other words, we explore how the financial depth or the institutional quality level of the recipient country a↵ects the impact of remittances on economic growth. The novelty of our paper lies in its estimation of the combined e↵ect of remittances and our conditional variables (financial development or the institutional quality). To this end, we introduce in Equation (1) an interaction term between remittances and the financial development level or the institutional quality. The modified versions of Equation (1) that include the interactive terms can be written as:
W GDPit= ↵i+ 1Remit+ 2(Remit⇥ F indvpit) + F indLit+ ✓Xit+ ⌘t+ ⌫i+ ✏it (2)
In Equation (2) we test whether remittances and financial development should com-plement or substitute for each other. However, in Equation (3) we test the hypothesis that the institutional quality of the recipient country influences the capacity of remit-tances to a↵ect economic growth. However, this paper is interested in 1 and 2, which
provide information on the marginal impact1 of remittances on growth conditional upon the financial development level or the institutional quality. 1 and 2 make it possible
to assess whether remittances have di↵erent influences on growth in countries with high values of financial development/ institutional quality. In Equation (2), if 2 is negative,
remittances are more e↵ective in promoting growth in countries with a shallower finance system. In other words, a negative interaction means that remittances have de facto acted as a substitute for financial services to enhance economic growth. However, a positive interaction suggests that remittances and the financial system are complements (a better functioning financial system would lead remittances towards growth-enhancement). In a similar way, in Equation (3), a positive interaction would indicate that the institutional quality enhances the positive e↵ect of remittances on growth2. Otherwise, when the in-teraction is negative, the institutional quality diminishes ( 1 > 0) or alleviates ( 1 < 0)
the negative impact of remittances on growth.
An important methodological challenge is related to the presence of endogenous regres-sors. Thus, the presence of a lag-dependent variable on the right hand of the equation, the inverse causality relationship between remittances and growth (i.e. remittances may a↵ect the growth of the receiving countries and thereby a↵ect the future amount of remittances received), reverse causality between the dependent variables and some of our explanatory variables (i.e. remittances, revenue, inflation, GDP growth and the quality of institutions) will lead to simultaneity bias of the regression’s coefficients. Analysts who consider this endogeneity problem often use the Generalized Method of Moments (GMM) estimation technique developed by Arellano and Bond (1991) and Blundell and Bond (1998). The GMM estimator has the advantage that it is more efficient than the OLS estimator. It is also widely known as a solution to measurement errors (errors in variables) and omitted-variable biases (Guillaumont S and Kpodar, 2006). For the endogenous omitted-variables, we rely on the internal instruments that are one lag variables. To check the validity of the instru-ments, the Sargan/Hansen test has been applied. In addition, a number of econometric tests have been investigated (tests of collinearity, causality and endogeneity).
Di↵erentiating equations (2) and (3) with respect to remittances, we can check if re-mittances have a di↵erent influence on growth in countries with high values of financial development3 (institutional quality4) as well as countries with low values. Moreover, ac-cording to Equations (4) and (5), Equation (6) captures the complete relationship between remittances and GDP per capita growth for di↵erent levels of financial development (in-stitutional quality).
@GDP/@REM = 1+ 2⇥ F indvpit (4)
@GDP/@REM = 1+ 2⇥ InstQit (5)
1
1 measures the direct e↵ect while 2 represents to the indirect e↵ect 2when
1 is negative, the institutional quality reduces the negative e↵ects of remittances on growth. 3Equation 4
4Equation 5
⌫ = 1+ 2⇥ F indvp(InstQ) ⇥ REM (6)
3.2 Variable definitions and data
To capture the role of financial development and institutional level on the e↵ect of remittances on growth, we use respectively three and four proxies. For the financial de-velopment proxy, all variables are related to the banking sector. First, to evaluate the financial intermediation, we use first domestic credit to the private sector by banks as a percentage of GDP. The second variable represents liquid liabilities (broad money) as part of GDP. This variable is defined as the sum of currency and deposits in the central bank liquid liabilities divided by GDP. It is used as a proxy of the size of financial intermediaries relative to the size of the economy. Finally, the bank efficiency ratio is also used. This proxy gives us an idea of banking productivity. The ratio is a quick and easy measure of a bank’s ability to turn resources into revenue. The ratio is defined as the sum of expenses (without interest expenses) divided by the revenue. The following variables have been chosen to form the financial indicator of World Development Indicators (WDI). Similarly, institutional quality level is proxied by International Country Risk Guide index of political risk. In accordance with Bekaert et al. (2006), we use the Political Institutions Index, wich the sum of the subcomponents military in politics and democratic accountability. The quality of the Institutions Index is used to capture corruption, law and order, and bureaucratic quality. We also use the Socioeconomic Environment Index that is indica-tive of stability, socioeconomic conditions, and the investment profile. Finally, we use the Conflict Risk Index to capture the internal and external conflict.
As mentioned above, remittances include personal transfers and compensation of em-ployees. Personal transfers consist of all current transfers in cash or in kind made or received by resident households to or from nonresident households. Personal transfers thus include all current transfers between resident and nonresident individuals. Compen-sation of employees refers to the income of border, seasonal, and other short-term workers who are employed in an economy where they are not resident, and of residents employed by nonresident entities. The remittances variable is scaled by the home country’s GDP. The choice of the variables and the proxies of the detriments of growth is guided by the literature (Barro, 1996; Giuliano and Ruiz-Arranz, 2009 ; Combe and Ebeke, 2010 ; Imai, K. et al., 2014). These variables consist of past GDPt 1to test the convergence hypothesis
(Barro, 1996). Investment represent the gross fixed capital formation as a percentage of real GDP is used as a proxy for investment in physical capital. Trade openness is de-fined by the ratio of the sum of exports and imports over GDP is used to evaluate the country’s degree of openness. The inflation rate is a proxy to monetary discipline and macroeconomic stability. Government consumption is defined as the ratio of government consumption to GDP.
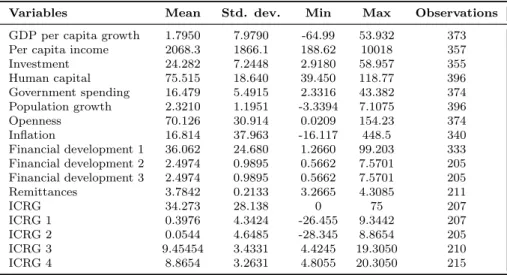
The full sample dataset comprises an unbalanced panel of 12 countries and both four-year average and annual data covering the period 1984 – 2012. The initial four-year is chosen due to availability. The summary statistics, the variable definitions as well as data sources are provided in the appendix A (Table 1 and Table 2).
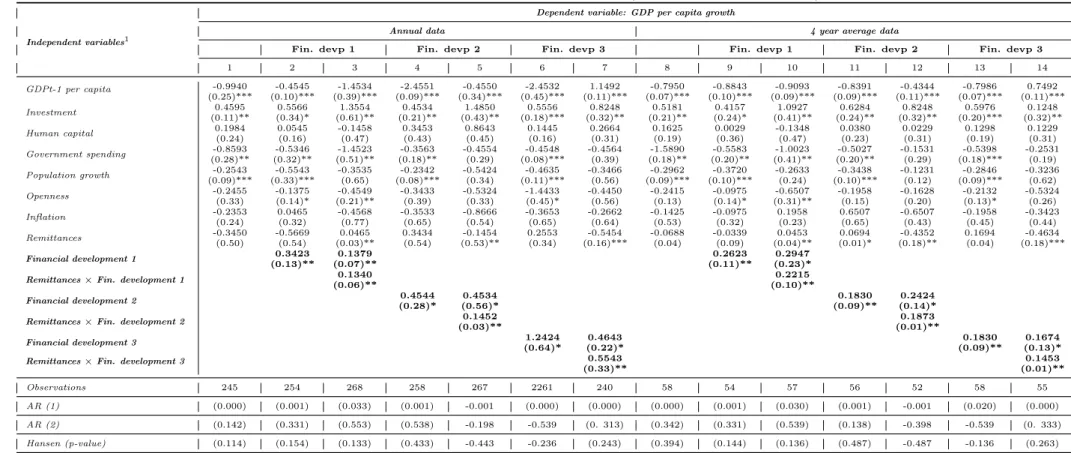
Table 1: Remittances, financial development and growth (GMM-System estimation)
Independent variables1
Dependent variable: GDP per capita growth
Annual data 4 year average data
Fin. devp 1 Fin. devp 2 Fin. devp 3 Fin. devp 1 Fin. devp 2 Fin. devp 3
1 2 3 4 5 6 7 8 9 10 11 12 13 14 GDPt-1 per capita -0.9940 -0.4545 -1.4534 -2.4551 -0.4550 -2.4532 1.1492 -0.7950 -0.8843 -0.9093 -0.8391 -0.4344 -0.7986 0.7492 (0.25)*** (0.10)*** (0.39)*** (0.09)*** (0.34)*** (0.45)*** (0.11)*** (0.07)*** (0.10)*** (0.09)*** (0.09)*** (0.11)*** (0.07)*** (0.11)*** Investment 0.4595 0.5566 1.3554 0.4534 1.4850 0.5556 0.8248 0.5181 0.4157 1.0927 0.6284 0.8248 0.5976 0.1248 (0.11)** (0.34)* (0.61)** (0.21)** (0.43)** (0.18)*** (0.32)** (0.21)** (0.24)* (0.41)** (0.24)** (0.32)** (0.20)*** (0.32)** Human capital 0.1984 0.0545 -0.1458 0.3453 0.8643 0.1445 0.2664 0.1625 0.0029 -0.1348 0.0380 0.0229 0.1298 0.1229 (0.24) (0.16) (0.47) (0.43) (0.45) (0.16) (0.31) (0.19) (0.36) (0.47) (0.23) (0.31) (0.19) (0.31) Government spending -0.8593 -0.5346 -1.4523 -0.3563 -0.4554 -0.4548 -0.4564 -1.5890 -0.5583 -1.0023 -0.5027 -0.1531 -0.5398 -0.2531 (0.28)** (0.32)** (0.51)** (0.18)** (0.29) (0.08)*** (0.39) (0.18)** (0.20)** (0.41)** (0.20)** (0.29) (0.18)*** (0.19) Population growth (0.09)***-0.2543 (0.33)***-0.5543 -0.3535(0.65) (0.08)***-0.2342 -0.5424(0.34) (0.11)***-0.4635 -0.3466(0.56) (0.09)***-0.2962 (0.10)***-0.3720 -0.2633(0.24) (0.10)***-0.3438 -0.1231(0.12) (0.09)***-0.2846 -0.3236(0.62) Openness -0.2455(0.33) (0.14)*-0.1375 (0.21)**-0.4549 -0.3433(0.39) -0.5324(0.33) -1.4433(0.45)* -0.4450(0.56) -0.2415(0.13) (0.14)*-0.0975 (0.31)**-0.6507 -0.1958(0.15) -0.1628(0.20) -0.2132(0.13)* -0.5324(0.26) Inflation -0.2353(0.24) 0.0465(0.32) -0.4568(0.77) -0.3533(0.65) -0.8666(0.54) -0.3653(0.65) -0.2662(0.64) -0.1425(0.53) -0.0975(0.32) 0.1958(0.23) 0.6507(0.65) -0.6507(0.43) -0.1958(0.45) -0.3423(0.44) Remittances -0.3450(0.50) -0.5669(0.54) (0.03)**0.0465 0.3434(0.54) (0.53)**-0.1454 0.2553(0.34) (0.16)***-0.5454 -0.0688(0.04) -0.0339(0.09) (0.04)**0.0453 (0.01)*0.0694 (0.18)**-0.4352 0.1694(0.04) (0.18)***-0.4634 Financial development 1 (0.13)**0.3423 (0.07)**0.1379 (0.11)**0.2623 (0.23)*0.2947
Remittances⇥ Fin. development 1 (0.06)**0.1340 (0.10)**0.2215
Financial development 2 (0.28)*0.4544 (0.56)*0.4534 (0.09)**0.1830 (0.14)*0.2424 Remittances⇥ Fin. development 2 (0.03)**0.1452 (0.01)**0.1873
Financial development 3 (0.64)*1.2424 (0.22)*0.4643 (0.09)**0.1830 (0.13)*0.1674
Remittances⇥ Fin. development 3 0.5543 0.1453
(0.33)** (0.01)**
Observations 245 254 268 258 267 2261 240 58 54 57 56 52 58 55 AR (1) (0.000) (0.001) (0.033) (0.001) -0.001 (0.000) (0.000) (0.000) (0.001) (0.030) (0.001) -0.001 (0.020) (0.000) AR (2) (0.142) (0.331) (0.553) (0.538) -0.198 -0.539 (0. 313) (0.342) (0.331) (0.539) (0.138) -0.398 -0.539 (0. 333) Hansen (p-value) (0.114) (0.154) (0.133) (0.433) -0.443 -0.236 (0.243) (0.394) (0.144) (0.136) (0.487) -0.487 -0.136 (0.263) Financial development 1: Financial intermediation. Financial development 2: Liquid liabilities. Financial development 3 : Bank efficiency ratio. For the Sargan test, the null hypothesis is that the instruments do not correlate with the residuals. The Hansen statistic tests the validity of our instruments. For the test for autocorrelation AR (2), the null hypothesis is that the errors in the first di↵erence regression exhibit no second-order serial correlation. Standard errors in parenthesis. ***, **, * refer to the 1, 5 and 10% levels of significance, respectively.
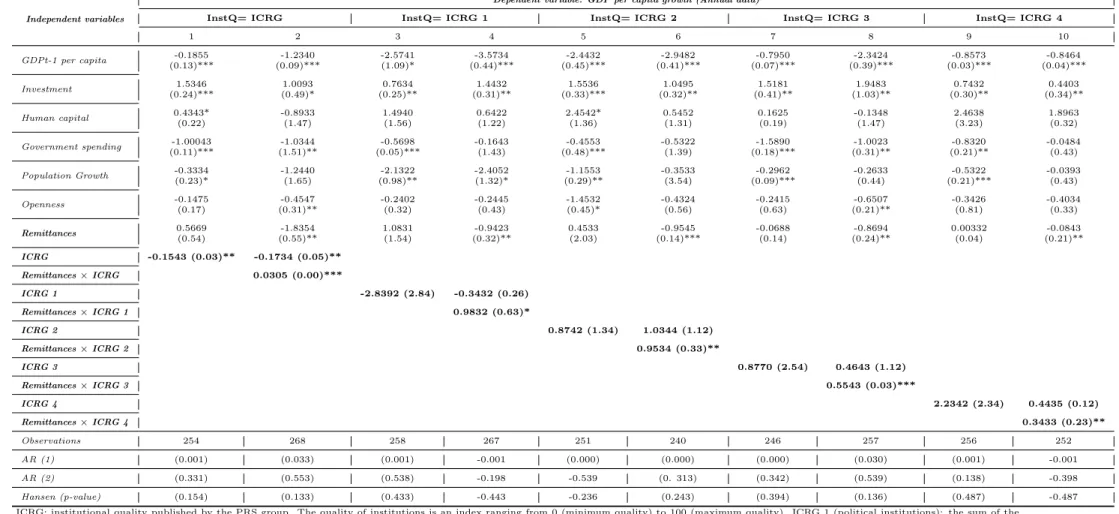
Table 2: Add caption
Independent variables
Dependent variable: GDP per capita growth (Annual data)
InstQ= ICRG InstQ= ICRG 1 InstQ= ICRG 2 InstQ= ICRG 3 InstQ= ICRG 4
1 2 3 4 5 6 7 8 9 10 GDPt-1 per capita (0.13)***-0.1855 (0.09)***-1.2340 -2.5741(1.09)* (0.44)***-3.5734 (0.45)***-2.4432 (0.41)***-2.9482 (0.07)***-0.7950 (0.39)***-2.3424 (0.03)***-0.8573 (0.04)***-0.8464 Investment (0.24)***1.5346 (0.49)*1.0093 (0.25)**0.7634 (0.31)**1.4432 (0.33)***1.5536 (0.32)**1.0495 (0.41)**1.5181 (1.03)**1.9483 (0.30)**0.7432 (0.34)**0.4403 Human capital 0.4343*(0.22) -0.8933(1.47) 1.4940(1.56) 0.6422(1.22) 2.4542*(1.36) 0.5452(1.31) 0.1625(0.19) -0.1348(1.47) 2.4638(3.23) 1.8963(0.32) Government spending -1.00043 -1.0344 -0.5698 -0.1643 -0.4553 -0.5322 -1.5890 -1.0023 -0.8320 -0.0484 (0.11)*** (1.51)** (0.05)*** (1.43) (0.48)*** (1.39) (0.18)*** (0.31)** (0.21)** (0.43) Population Growth -0.3334(0.23)* -1.2440(1.65) (0.98)**-2.1322 -2.4052(1.32)* (0.29)**-1.1553 -0.3533(3.54) (0.09)***-0.2962 -0.2633(0.44) (0.21)***-0.5322 -0.0393(0.43) Openness -0.1475(0.17) (0.31)**-0.4547 -0.2402(0.32) -0.2445(0.43) (0.45)*-1.4532 -0.4324(0.56) -0.2415(0.63) (0.21)**-0.6507 -0.3426(0.81) -0.4034(0.33) Remittances 0.5669(0.54) (0.55)**-1.8354 1.0831(1.54) (0.32)**-0.9423 0.4533(2.03) (0.14)***-0.9545 -0.0688(0.14) (0.24)**-0.8694 0.00332(0.04) (0.21)**-0.0843 ICRG -0.1543 (0.03)** -0.1734 (0.05)** Remittances⇥ ICRG 0.0305 (0.00)*** ICRG 1 -2.8392 (2.84) -0.3432 (0.26) Remittances⇥ ICRG 1 0.9832 (0.63)* ICRG 2 0.8742 (1.34) 1.0344 (1.12) Remittances⇥ ICRG 2 0.9534 (0.33)** ICRG 3 0.8770 (2.54) 0.4643 (1.12) Remittances⇥ ICRG 3 0.5543 (0.03)*** ICRG 4 2.2342 (2.34) 0.4435 (0.12) Remittances⇥ ICRG 4 0.3433 (0.23)** Observations 254 268 258 267 251 240 246 257 256 252 AR (1) (0.001) (0.033) (0.001) -0.001 (0.000) (0.000) (0.000) (0.030) (0.001) -0.001 AR (2) (0.331) (0.553) (0.538) -0.198 -0.539 (0. 313) (0.342) (0.539) (0.138) -0.398 Hansen (p-value) (0.154) (0.133) (0.433) -0.443 -0.236 (0.243) (0.394) (0.136) (0.487) -0.487 ICRG: institutional quality published by the PRS group. The quality of institutions is an index ranging from 0 (minimum quality) to 100 (maximum quality). ICRG 1 (political institutions): the sum of the
subcomponents ‘military in politics’ and ‘democratic accountability’. ICRG2 (quality of institutions): is the sum of corruption, law and order, and bureaucratic quality. ICRG3 (socioeconomic environment): sum of government stability, socioeconomic conditions, and investment profile. ICRG4 (conflicts): internal and external conflict, ethnic and religious tensions. Standard errors in parenthesis.***, **, * refer to the 1, 5 and 10% levels of significance respectively.
4
Evaluation of the results
In this section, we present the results obtained from the estimations of our models. This analysis will primarily focus on our variables of interest (remittances, financial de-velopment, and institution quality), although we analyze the results obtained from the variables of control. Tables 3 and 4 present the results of the GMM dynamic estimations. The estimation regressions satisfy mutually the Sargan test of over-identifying restrictions and the serial correlation test. In all our results, the Hansen test shows that our instru-ments are valid (do not reject the null hypothesis). Moreover, AR(1) and AR(2) are tests for first order and second order serial correlation in the first di↵erenced residuals under the null of no serial correlation.
The results of the benchmark model are reported in table 3, columns 1 (annual data) and 8 (4-year average data). The estimations show that the coefficient of the GDP lag is negative and indicate the presence of a convergence process. The poor countries grow faster than rich economies, once the determinants of their steady state are held constant. These results are consistent with the standard growth theory which suggests that the economy tends to approach its long run position if the starting per capita is low (Barro and Sala-I-Martin, 1995 ; Easterly and Levine, 1995). As expected, a positive correlation between investment and economic growth is found. A higher level of private investment leads to higher economic growth. However, population growth rate, trade openness and government spending negatively a↵ect the rate of economic growth (Jongwanich, 2007 ; Acosta et al., 2009). This finding seems to validate the idea that higher involvement of the government in the economy will have significate consequences on the growth performance ( (F¨olster and Henrekson, 2001). Finally, the e↵ects of human capital and inflation are insignificant although the coefficients change from one specification to another.
Moving to our key variables, we can see that all our measures of financial develop-ment are positive and statistically di↵erent to zero. However, the estimated coefficients of remittances are not statistically di↵erent from zero (remittances do not have a strong impact on economic growth). These findings are consistent with Barajas, Chami and Ful-lenkamp (2009), but in contrast to the literature reviews that have found a positive e↵ect of remittances on consumption, investment, and health outcomes. These results lead to a question about the nature of the relationship between remittances and growth. This relationship seems to be nonlinear. In other words, the e↵ect of remittances on economic growth may depend on other variables. Thus, we explore this avenue by investigating whether the financial development and the institutional level of the receiving countries influence the e↵ect of remittances on the performance of economic growth.
First, we estimate Equation (2) in which a number of interaction variables have been added. We explore whether there is a substitutability or complementarity relationship between remittances and financial development in promoting economic growth in MENA countries. Columns 3 to 14 present the outcomes of the regression models for both annual and four-year average data. In each column, we use one proxy of financial development. The estimated coefficients of remittances and the interaction term are significantly nega-tive. As we explain above, the remittances and the financial development have a comple-mentary e↵ect in boosting the growth of GDP. This finding suggests that remittances have a positive e↵ect on economic growth only if the domestic banking system is sufficiently sound. Similar findings were also obtained by Bettin and Zazzaro (2012) and Nyamongo
et al.(2012). However, these results are not in line with Barajas, Chami and Fullenkamp (2009), and Giuliano and Ruiz-Arranz’s (2009) studies which supported the complemen-tary view. Unlike our study, Giuliano and Ruiz-Arranz use only measures of the size of the financial sector, ignoring its efficiency.
Otherwise, taking the ratio of domestic credit provided by the banking sector to GDP as the measure of financial development, the threshold from which remittances could have a positive e↵ect on economic growth is 2.32 while the sample mean is 2.49. This means that only a few countries can concretely benefit from remittances. Based on column 12, the direct e↵ect is -0.4352. This is much larger than the indirect e↵ect in absolute terms 0.1830 (the elasticity of economic growth with respect to remittances). For example, in the case of Turkey, the total e↵ect is 0.034, obtained by multiplying 0.1830 by the Turkish financial development mean and adding -0.4352. This indicates that a 1% increase in the share of remittances in GDP leads to a 0.034% increase in the GDP per capita growth ratio. However, in Egypt, a 1% increase in remittances leads to a 0.20% decrease in the GDP per capita growth ratio. Figures 1 in the appendix shows the impact of remittances on GDP per capita computed for each country at the mean level of the ratio of domestic credit provided by the banking sector to GDP. Out of 12 countries considered in the analy-sis, only Turkey, Tunisia and Morocco seem to benefit overall from remittances (Appendix B, Figure 1).
Finally, in table 4 we report the estimates of Equation (2) to test the interaction between remittances, economic growth, and the institutional environment. In other words, the specification allows us to test the hypothesis that the e↵ect of remittances on growth is conditioned by the institutional quality. We present five specifications. In the first, we use the composite institutional index (ICRG). This index published by the PRS group is composite Political, Financial, Economic Risk rating. It’s ranging from 0 for very high risk to 100 for very low risk. In the other specifications, we only use the four components of this composite index (ICRG 1, ICRG2, ICRG3, ICRG4). The estimates show two very important results. First, the results show that the interaction variables and remittances are negative and significant (column 2, table 4). This suggests that the marginal e↵ect of remittances is higher in countries with a more stable political environment. Second, for our sample, the results illustrate the presence of a threshold e↵ect beyond which remittances can be a growth enhancer. In order for remittances to contribute to economic growth, MENA countries must possess a level of institutional quality greater than the threshold level of 60%. Out of 12 countries considered in the analysis, only Tunisia, Jordan and Morocco seem to benefit overall from remittances (Appendix B, Figure 2). These findings are consistent with Catrinescu et al. (2009). For the authors, a low level of ethnic tension, good governance, the prevalence of law and order and good socioeconomic conditions are preconditions for the successful use of migrant remittances.
5
Conclusion
This paper examines the interaction between remittances, financial development, level of the institutional environment and economic growth in 12 MENA countries. The study covers the period of 1984-2012. After controlling the endogeneity bias of remittances by using GMM estimation, our results suggest that the impact of remittances on economic growth depends on the level of financial development and the institutional environment. More precisely, a high level of financial development and a strong institutional environment
are required to enable remittances to enhance growth.
Appendix
Table 3: Summary statistics
Variables Mean Std. dev. Min Max Observations GDP per capita growth 1.7950 7.9790 -64.99 53.932 373 Per capita income 2068.3 1866.1 188.62 10018 357 Investment 24.282 7.2448 2.9180 58.957 355 Human capital 75.515 18.640 39.450 118.77 396 Government spending 16.479 5.4915 2.3316 43.382 374 Population growth 2.3210 1.1951 -3.3394 7.1075 396 Openness 70.126 30.914 0.0209 154.23 374 Inflation 16.814 37.963 -16.117 448.5 340 Financial development 1 36.062 24.680 1.2660 99.203 333 Financial development 2 2.4974 0.9895 0.5662 7.5701 205 Financial development 3 2.4974 0.9895 0.5662 7.5701 205 Remittances 3.7842 0.2133 3.2665 4.3085 211 ICRG 34.273 28.138 0 75 207 ICRG 1 0.3976 4.3424 -26.455 9.3442 207 ICRG 2 0.0544 4.6485 -28.345 8.8654 205 ICRG 3 9.45454 3.4331 4.4245 19.3050 210 ICRG 4 8.8654 3.2631 4.8055 20.3050 215
Table 4: Variable definitions
Variable Description and source Source
Growth Real per capita growth (WDI-Word Bank) Lagged GDP Lagged real per capita income, expressed in log form WDI-Word Bank Remittances Workers’ remittances and compensation of employees, received (% of
GDP) expressed in log-form
WDI-Word Bank Investment Gross capital formation (% of GDP) expressed in log-form WDI-Word Bank Inflation Measured by CPI (annual %) (WDI-Word Bank) Human capital Age dependency ratio (% of working-age population) WDI-Word Bank Government spending General government final consumption expenditure (% of GDP) WDI-Word Bank Population growth Population growth (annual %) WDI-Word Bank Openness The sum of exports and imports of goods and services as share of
gross domestic product (GDP) in log form
WDI-Word Bank Financial development 1 Domestic credit to the private sector by banks as a percentage of GDP WDI-Word Bank Financial development 2 The sum of currency and deposits in the central bank liquid liabilities
divided by GDP
WDI-Word Bank Financial development 3 Bank’s efficiency ratio is a measure of a bank’s overhead as a
percent-age of its revenue (the sum of expenses (without interest expenses) divided by the revenue)
ICRG ICRG political risk index (0 : highest risk, 100 : lower risk) ICRG , PRS Group ICRG 1 The sum of the subcomponents ‘military in politics’ and ‘democratic
accountability
ICRG , PRS Group ICRG 2 The sum of corruption, law and order, and bureaucratic quality ICRG , PRS Group ICRG 3 The sum of government stability, socioeconomic conditions, and
in-vestment profile
ICRG , PRS Group ICRG 4 The sum of internal and external conflict, ethnic and religious tensions ICRG , PRS Group
Figure 1: Marginal E↵ect of Remittances on Economic Growth based on each country’s Financial Development index value
Figure 2: Marginal E↵ect of Remittances on Economic Growth based on each country’s institutional index value
Bibliography
Abdih, Y., Chami, R., Dagher, J., Montiel, P., 2012. Remittances and institutions: Are remittances a curse? World Dev. 40, 657–666. doi:10.1016/j.worlddev.2011.09.014
Acosta, P.A., Baerg, N.R., Mandelman, F.S., 2009a. Financial Development, Remit-tances, and Real Exchange Rate Appreciation. Fed. Reserv. Bank Atlanta Econ. Rev. 94, 14. doi:10.1016/j.jinteco.2009.06.007
Acosta, P.A., Lartey, E.K.K., Mandelman, F.S., 2009b. Remittances and the Dutch disease. J. Int. Econ. 79, 102–116. doi:10.1016/j.jinteco.2009.06.007
Adams, Jr, R., 2003. International migration, remittances, and the brain drain: A study of 24 labor-exporting countries (No. 3069), Policy Research Working Paper.
Adams, S., Klobodu, E.K.M., 2016. Remittances, regime durability and economic
growth in Sub-Saharan Africa (SSA). Econ. Anal. Policy 50, 1–8. doi:10.1016 /j.
eap.2016.01.002
Adams Jr, R.H., Cuecuecha, A., 2013. The Impact of remittances on investment and poverty in Ghana. World Dev. 50, 24–40. doi:10.1016/j.worlddev.2013.04.009
Ahamada, I., Coulibaly, D., 2013. Remittances and growth in sub-saharan african coun-tries: Evidence from a panel causality test. J. Int. Dev. 25, 310–324. doi:10.1002/jid.2830 Aitymbetov, S., 2006. Emigrant remittances: impact on economic development of Kyrgyzstan (No. 31), ICEG European Center Working Paper. Akobeng, E., 2016. Out of inequality and poverty: Evidence for the e↵ectiveness of remittances in Sub-Saharan Africa. Q. Rev. Econ. Financ. 60, 207–223. doi:10.1016/j.qref.2015.10.008
Amuedo-Dorantes, C., Pozo, S., Vargas-Silva, C., 2010. Remittances in Small Island Developing States. J. Dev. Stud. 46, 941–960. doi:10.1080/00220381003623863.
Ang, A., 2009. Workers’ remittances and its impact on rural development in the Philip-pines. Asia-Pacific Soc. Sci. Rev. 9, 63–77. Arellano, M., Bond, S., 1991. Some tests of specification for panel data: Monte Carlo evidence and an application to employment equations. Rev. Econ. Stud. 58, 277–297. doi:10.2307/2297968
Barajas, A., Chami, R., Fullenkamp, C., 2009. Do workers’ remittances promote eco-nomic growth? (No. 09/153), IMF Working Paper. Washington, DC. Barro, R.J., 1996. Determinants of Economic Growth: A Cross-Country Empirical Study. NBER Work. Pap. Ser. w5698.
Barro, R.J., 1991. Economic Growth in a Cross Section of Countries. Q. J. Econ. 106, 407–443.
Barro, R.J., Sala-I-Martin, X., 1995. Economic Growth, European psychiatry the jour-nal of the Association of European Psychiatrists. doi:10.1016/j.eurpsy.2009.07.013
Bekaert, G., Harvey, C.R., Lundblad, C., 2006. Growth volatility and financial
alization. J. Int. Money Financ. 25, 370–403. doi:10.1016/j.jimonfin.2006.01.003
Bettin, G., Zazzaro, A., 2012a. Remittances and financial development: substitutes or complements in economic growth. Bull. Econ. Res. 64, 509–536.
Bettin, G., Zazzaro, A., 2012b. Remittances and financial development: Substitutes or complements in economic growth. Bull. Econ. Res. 64, 509–536. doi:10.1111/j.1467-8586.2011.00398.x
Blundell, R., Bond, S., 1998. Initial conditions and moment restrictions in dynamic panel data models. J. Econom. 87, 115–143. Bourdet, Y., Falck, H., 2006. Emigrants’ remittances and Dutch Disease in Cape Verde. Int. Econ. J. 20, 267–284.
Burgess, R., Haksar, V., 2005. Migration and Foreign Remittances in the Philippines (No. WP/05/111), IMF Working Paper. Calero, C., Bedi, A.S., Sparrow, R., 2009. Re-mittances, Liquidity Constraints and Human Capital Investments in Ecuador. World Dev. 37, 1143–1154.
Catrinescu, N., Leon-Ledesma, M., Piracha, M., Quillin, B., 2009a. Remittances, Insti-tutions, and Economic Growth. World Dev. 37, 81–92.doi:10.1016/ j.worlddev.2008.02.004 Catrinescu, N., Leon-Ledesma, M., Piracha, M., Quillin, B., 2009b. Remittances, in-stitutions, and economic growth. World Dev., Discussion Paper 37, 81–92. doi: 10.1016/j. worlddev. 2008.02.004
Chami, R., Fullenkamp, C., Jahjah, S., 2003. Are immigrant remittances flows a source of capital for development (No. 03/189), International Monetary Fund Sta↵ Papers.
Chami, R., Jahjah, S., Fullenkamp, C., 2005. Are immigrant remittance flows a source of capital for development (No. WP/03/189). Washington, DC. Combes, J.-L., Ebeke, C., 2011. Remittances and Household Consumption Instability in Developing Countries. World Dev. 39, 1076–1089. doi:10.1016/j.worlddev.2010.10.006
Easterly, W., Levine, R., 1995. Africa’s Growth Tragedy: A Retrospective, 1960-89. Policy Res. Work. Pap.
Edwards, A.C., Ureta, M., 2003. International migration, remittances, and schooling: Evidence from El Salvador. J. Dev. Econ. 72, 429–461. doi:10.1016/S0304-3878(03)00115-9
El-Qorchi, M., Munzele, M.S., Wilson, J.F., 2003. An Analysis of the Informal Hawala System (No. IMF Occasional Paper 222). Washington, DC.
Fajnzylber, P., Lopez, J.H., Boschi, R., Gait´an, F., Fainzylber, P., Acosta, P.A., 2008. Remittances and Development: Lessons from Latin America, Brazilian Political Science Review. doi:10.1596/978-0-8213-6870-1
Fayissa, B., Nsiah, C., 2012. Financial development and remittances in Africa and the Americas: a panel unit-root tests and panel cointegration analysis.
F¨olster, S., Henrekson, M., 2001. Growth e↵ects of government expenditure and taxa-tion in rich countries. Eur. Econ. Rev. 45, 1501–1520. doi:10.1016/S0014-2921(00)00083-0
Giuliano, P., Ruiz-Arranz, M., 2009. Remittances, financial development, and growth. J. Dev. Econ. 90, 144–152. doi:http://dx.doi.org/10.1016/j.jdeveco.2008.10.005
Glytsos, N.P., 2005. The contribution of remittances to growth: A dynamic approach and empirical analysis. J. Econ. Stud. 32, 468–496. doi:10.1108/01443580510631379
Gubert, F., 2002. Do migmrants insure those who stay behind? evidence from the Kayes Area (Western Mali). Oxford Dev. Stud. 30, 267–287. doi:10.1080/13600810 22000012699
Guillaumont S, J., Kpodar, K.R., 2006. D´eveloppement financier, instabilit´e financi`ere et croissance ´economique. Econ. pr´evision 174, 87–111. Imai, K.S., Gaiha, R., Ali, A., Kaicker, N., 2014. Remittances, growth and poverty: NEW evidence from Asian coun-tries. J. Policy Model. 36, 524–538. doi:10.1016/j.jpolmod.2014.01.009
Jongwanich, J., 2007. Workers’ Remittances, Economic Growth and Poverty in De-veloping Asia and the Pacific Countries (No. WP/07/01), UNESCAP Working Paper. United Nations Publications, New York.
Khan, Z.S., Islam, S., 2013. The E↵ects of Remittances on Inflation: Evidence from Bangladesh. J. Econ. Bus. Res. 19, 198–208. Majeed, M.T., 2015. Poverty e↵ects of remittances: A comparative analysis. J. Int. Dev. 27, 1–14. doi:10.1002/jid.3055
Mundaca, B.G., 2009. Remittances, financial market development, and economic growth: The case of Latin America and the Caribbean. Rev. Dev. Econ. 13, 288–303. doi:10.1111/j.1467-9361.2008.00487.x
Nyamongo, E.M., Misati, R.N., Kipyegon, L., Ndirangu, L., 2012. Remittances,
financial development and economic growth in Africa. J. Econ. Bus. 64, 240–260. doi:10.1016/j.jeconbus.2012.01.001
Rapoport, H., Docquier, F., 2005. The Economics of Migrants’ Remittances, in: Ythier, M., Kolm, S.. (Eds.), Handbook on the Economics of Giving, Reciprocity and Altruism. pp. 1135–1198.
Woodru↵, C., 2007. Mexican Microenterprise Investment and Employment: The Role of Remittances. Integr. Trade 11, 185–209.
Woodru↵, C., Zenteno, R., 2007. Migration networks and microenterprises in Mexico. J. Dev. Econ. 82, 509–528. doi:10.1016/j.jdeveco.2006.03.006
World Bank, 2014. Migration and development Brief 23, Migration and Remittances Team, Development Prospects Group.
Ziesemer, T.H.W., 2012. Worker remittances and government behaviour in the receiv-ing countries. East. J. Eur. Stud. 3, 37–59.