HAL Id: halshs-00564821
https://halshs.archives-ouvertes.fr/halshs-00564821
Preprint submitted on 10 Feb 2011HAL is a multi-disciplinary open access archive for the deposit and dissemination of sci-entific research documents, whether they are pub-lished or not. The documents may come from teaching and research institutions in France or abroad, or from public or private research centers.
L’archive ouverte pluridisciplinaire HAL, est destinée au dépôt et à la diffusion de documents scientifiques de niveau recherche, publiés ou non, émanant des établissements d’enseignement et de recherche français ou étrangers, des laboratoires publics ou privés.
Back to baseline in Britain: Adaptation in the BHPS
Andrew E. Clark, Yannis Georgellis
To cite this version:
Andrew E. Clark, Yannis Georgellis. Back to baseline in Britain: Adaptation in the BHPS. 2010. �halshs-00564821�
WORKING PAPER N° 2010 - 02
Back to baseline in Britain:
Adaptation in the BHPS
Andrew E. Clark Yannis Georgellis
JEL Codes: I31, J12, J13, J63, J64
Keywords: Life satisfaction, anticipation, adaptation, baseline satisfaction, labour market and life events
P
ARIS-
JOURDANS
CIENCESE
CONOMIQUES48,BD JOURDAN –E.N.S.–75014PARIS TÉL. :33(0)143136300 – FAX :33(0)143136310
www.pse.ens.fr
CENTRE NATIONAL DE LA RECHERCHE SCIENTIFIQUE –ECOLE DES HAUTES ETUDES EN SCIENCES SOCIALES ÉCOLE DES PONTS PARISTECH –ECOLE NORMALE SUPÉRIEURE –INSTITUT NATIONAL DE LA RECHERCHE AGRONOMIQUE
Back to Baseline in Britain: Adaptation in the BHPS*
Andrew E. Clark (Paris School of Economics, France and IZA, Germany) Yannis Georgellis (Brunel University, UK)
January 2010
Abstract
We look for evidence of adaptation of well-being to major life events in sixteen waves of British panel data. We find that, with the exception of unemployment, adaptation to other life events including marriage, divorce, birth of a child and widowhood is rapid and complete. These findings are remarkably similar to those found in previous analysis of German panel data. Equally, the time profiles of well-being as measured by life satisfaction data are very close to those from the analysis of a twelve-item scale of psychological functioning. As such, the phenomenon of adaptation may be a general one, rather than being only found in German data or using single-item measures. Last, we uncover some systematic differences in adaptation profiles according to “Big Five” personality measures.
JEL Codes: I31, J12, J13, J63, J64.
Keywords: Life Satisfaction; Anticipation; Adaptation; Baseline Satisfaction; Labour Market and Life
Events.
Address for Correspondence: Andrew Clark, PSE, 48 Boulevard Jourdan, 75014 Paris, France. Tel:
+33-1-43-13-63-29. E-mail: [email protected].
* This paper is part of a long-run project using subjective well-being information in panel data to look for evidence of anticipation and adaption to labour-market and life events. We are grateful to Ed Diener and Rich Lucas for their participation in this project. We also thank seminar participants at the 9th ISQOLS Conference (Florence) for useful comments. Data from the British Household Panel Survey (BHPS) were supplied by the ESRC Data Archive. Neither the original collectors of the data nor the Archive bear any responsibility for the analysis or interpretations presented here.
Back to Baseline in Britain: Adaptation in the BHPS
Andrew E. Clark and Yannis Georgellis
1. Introduction
Economists have becoming increasingly interested in adaptation over recent years. Many of the questions that arise are central to the understanding of individual behaviour and welfare: Are there welfare effects from the anticipation of future events? Do individuals get used to unemployment, marriage or higher incomes? And if they do, were their prior decisions informed ones, or did they not foresee this adaptation?
With our current state of knowledge, it is not possible to answer all of these questions at the same time, although a number of papers have contributed parts of answers to one or more of the questions. A recent paper (Clark et al., 2008) was arguably one of the first to trace out systematically the pattern of well-being leading up to and following a number of significant labour-market and life events, using large-scale long-run panel data. Their analysis sample of over 130,000 person-year observations in twenty waves of German Socio-Economic Panel (GSOEP) data revealed significant lag and lead effects. However, while the patterns in well-being were reasonably similar for men and women, they did differ noticeably between events. Complete adaptation was found for marriage, divorce, widowhood, birth of child, and layoff. The exception is unemployment, for which there was only little evidence of adaptation.
The information provided in Clark et al. is novel, but inspires a number of questions. First, are these striking patterns of adaptation (or not) specific to Germany, or are they broadly representative? Second, the analysis was based on a single-item measure of well-being (life satisfaction). In the light of the strong preference expressed by Psychologists for multi-item measures of individual well-being, should single-item results then be regarded with some suspicion? Third, while this (and subsequent) papers have traced out the average changes in well-being consequent to some event, is there any evidence that these profiles differ systematically across groups?
This paper brings some responses to all of these questions. While we do not have harmonised data over a variety of countries that would allow us to replicate the analysis in Clark et al. (which requires relatively long-run panel data including a measure of individual overall subjective well-being), we can apply the method used for the GSOEP data to another well-known long-run panel survey: the British Household Panel Survey (BHPS). This latter does include (at least from Wave Six onwards) an overall life satisfaction question similar to that used by Clark et al. for the analysis of the GSOEP data. However, it also includes at every wave a psychological measure of mental stress (the 12-item General Health Questionnaire, or GHQ-12).
Our results suggest that the phenomenon of adaptation may be a general one, rather than being only found in German data or using single-item measures. Specifically, the adaptation graphs that result
from our analysis of the BHPS data are remarkably similar to those found in previous analysis of the GSOEP. Last, we also appeal to the Big Five personality measures available in wave 15 of the BHPS to show that there are some systematic differences in adaptation between personality groups. Our results suggest that extraverts seem to suffer less psychologically than intraverts from the events of unemployment and divorce; however, they do seem to have more negative well-being reactions to the birth of a new child. Extraversion is therefore not an unmitigated boon in well-being terms.
The remainder of the paper is organised as follows. Section 2 briefly reviews the existing GSOEP results and some other previous findings on adaptation, and Section 3 lays out the regression methodology and the BHPS data. Section 4 describes the new anticipation and adaptation results in the BHPS from single- and multiple-item subjective well-being scores, and Section 5 shows that these profiles exhibit some systematic differences between personality types. Last, Section 6 concludes.
2. Some Previous Findings
The growing interest shown by Economists and other social scientists in the analysis of subjective well-being data has been reflected in a sharp increase in publications in this domain in recent years. While it continues to be true that the vast majority of work has analysed the relationship between well-being at time t and individual explanatory variables measured at the same point in time, there is a small but growing literature that has taken the idea of the profile of well-being around an event seriously.
Lucas et al. (2004) use longitudinal data for Germany (GSOEP) to examine whether individuals recover from the negative well-being effect of unemployment. They find that any adaptation to unemployment is at best incomplete. Similarly, using the British Household panel Survey (BHPS), the European Community Household Panel (ECHP) and the GSOEP, Clark (2006) finds that the negative effect of unemployment does not dissipate rapidly with the duration of the unemployment spell. Unlike unemployment, other events have a more transient effect on individuals. Lucas et al. (2003) and Stutzer and Frey (2006) explore adaptation patterns to changes in marital status concluding that any positive well-being effect does not last beyond the early years of marriage. Lucas (2005) and Gardner and Oswald (2006) provide evidence of a rapid adaptation to divorce using the GSOEP and BHPS data respectively. Oswald and Powdthavee (2008) track individuals’ levels of reported life satisfaction in the years leading up to, and after, disability. Although their results show a significant degree of recovery in reported life satisfaction, adaptation to pre-disability levels of well-being is only incomplete.
These studies explore adaptation patterns for one single event, and do not necessarily inform us about adaptation patterns across events. Clark et al. (2008) are an exception here in that they apply the same analytical techniques to GSOEP data in order to provide standardised information on how individuals’ well-being develops in the approach to and aftermath of six major life events: unemployment, marriage, divorce, widowhood, birth of child, and layoff. While their results provide
strong evidence of both anticipation and adaptation, they find that for all events, bar unemployment, there is a rapid return to a baseline level of well-being. In the same spirit of providing large-scale standardised evidence of adaptation to major life and economic events, Frijters et al. (2010) use six waves of the Household, Income and Labour Dynamics in Australia Survey (HILDA) to examine adaptation to marriage, divorce, birth of child, injury/illness, death of spouse or child, being a victim of crime, redundancy, change in financial situation, and change in residence. They find that whilst for all events the well-being effect two years after the event is smaller than the contemporaneous effect, for many events the effect two years later is roughly zero, implying complete adaptation. Angeles (2009) analyses life satisfaction in the same BHPS data as in the current paper, and finds evidence of adaptation to the majority of the life events under consideration (marriage, couple formation, separation, divorce, widowhood, unemployment, birth of a child, and changes in health).
Focusing on the question of adaptation to income, Ferrer-i-Carbonnel and Van Praag (2008) emphasise the importance of asymmetries in adaptation patterns, as income rises seem to have a larger impact on life and financial satisfaction than income falls. Their results suggest that adaptation of life satisfaction to income changes is only partial, depends on the specification of the utility model used and, if it occurs at all, is only for income falls. In contrast, they find no evidence of adaptation in terms of financial satisfaction, implying that money does buy financial satisfaction in the long run. Extending their analysis to explore adaptation to life events, they uncover some evidence of an asymmetry to changes in partnership. Losing a partner has a significant negative effect on well-being while the positive effect of acquiring a partner is not statistically significant. Ferrer-i-Carbonnel and Van Praag (2008) conclude that the adaptation phenomenon is more intricate than previously thought and that adaptation patterns differ for the various life events and for different satisfaction domains. Lucas (2007) makes the same point, arguing that evidence based on large-scale panel studies rejects the notion that adaptation is inevitable. Reviewing recent findings in the adaptation literature, Lucas (2007) concludes that whilst it is possible for long-run subjective well-being to change, heterogeneity in patterns of adaptation across events and across individuals cannot be ignored. One of the aims of our paper is to provide some systematic evidence regarding this latter point
3. Methodology and Data
We here use data from sixteen waves of the British Household Panel Survey (BHPS) covering the period 1991-2006. We evaluate the extent of adaptation in well-being via two measures of the latter. The first is satisfaction with life, based on responses to the question of “How dissatisfied or satisfied
are you with your life overall”? The responses to this question are on a scale from one to seven, where
1 means completely dissatisfied and 7 means completely satisfied. This question is available from wave six onwards, effectively limiting our analysis period to 1996-2006. Focusing on respondents aged from 16 to 60 yields an unbalanced panel of 46662 and 54511 person-year observations for men
and women respectively. For the analysis of birth of child we limit our sample to include only those less than 40 years of age. For the analysis of widowhood we include respondents up to the age of 80.
The second well-being measure is the GHQ-12 measure of mental well-being (see Goldberg, 1972), based on responses to the General Health Questionnaire. This latter consists of twelve questions (administered via a self-completion questionnaire) covering feelings of strain, depression, inability to cope, anxiety-based insomnia, and lack of confidence, amongst others (see Appendix A). Responses are made on a four-point scale of frequency of a feeling in relation to a person's usual state: "Not at all", "No more than usual", "Rather more than usual", and "Much more than usual". The GHQ is widely used in medical, psychological and sociological research, and is considered to be a robust indicator of the individual's psychological state. The GHQ has previously been used in Economics to examine the psychological impact of unemployment (Clark and Oswald, 1994, and Clark, 2003).
This paper uses the Caseness GHQ score, which counts the number of questions for which the response is in one of the two "low well-being" categories. This count is reversed so that higher scores indicate higher levels of well-being, running from 0 (all twelve responses indicating poor psychological health) to 12 (no responses indicating poor psychological health). The GHQ question is available for all waves, thus increasing the effective sample for the analysis to 69326 and 80329 person-year observations for men and women respectively.
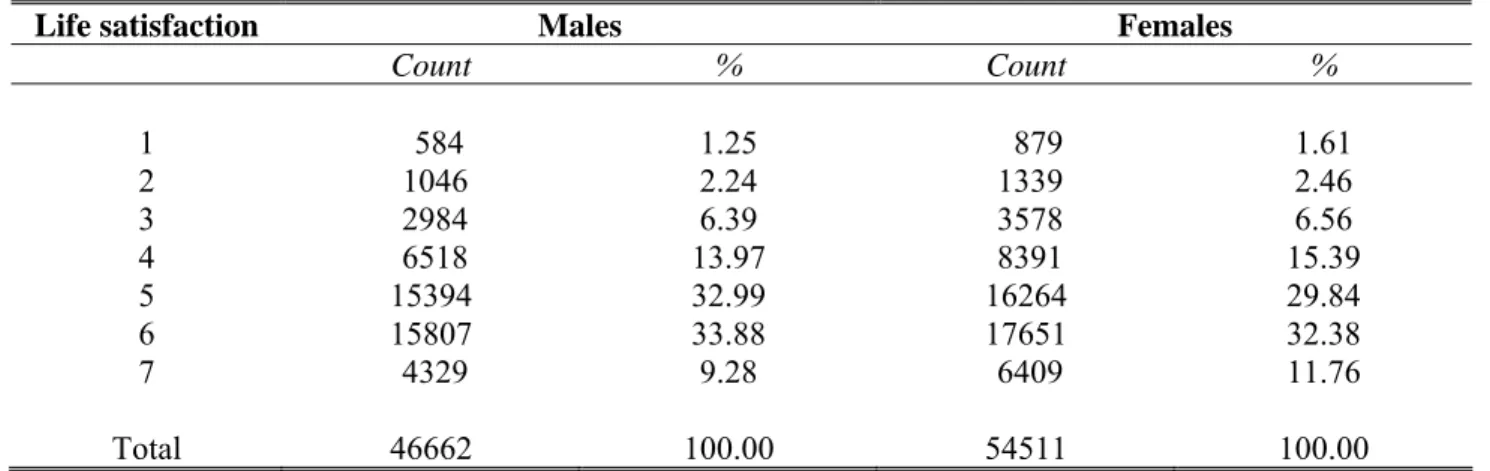
Tables 1a and 1b show the distribution of these two measures in our sample. Median life satisfaction is five on the one-to-seven scale, and median GHQ is 12 for men and 11 for women on the zero-to-twelve scale. There are however long tails in all of the well-being distributions here: 10% of individuals have life satisfaction scores of three or less, and ten per cent of men and sixteen per cent of women have GHQ scores of six or less.
[Tables 1a and 1b about here]
We here apply exactly the same methodology as in Clark et al. (2008),1 and appeal to a
within-subject (fixed-effect) approach to examine how unemployment, marriage, divorce, birth of a child and widowhood are associated with life satisfaction and GHQ scores before and after the event in question takes place. Specifically, we look for evidence of both anticipation and adaptation by using a series of appropriate dummies in a fixed-effects regression. We concentrate on the four years preceding the event in question with respect to anticipation, and the five individual years following the event in order to identify adaptation. For each event we consider only the first occurrence per individual that we observe within the BHPS sample period. For example, to trace out any adaptation to marriage, we follow the individual’s reported well-being scores for each year during the first observed marriage spell during the duration of this spell; we drop from the sample any observations for subsequent marriage
spells. Any left-censored spells are also excluded from the analysis (i.e. we have to observe the transition under consideration).
We model adaptation to unemployment, for example, via the regression below:
WBit = αi + β’Xit + θ0U0it + θ1U1it + θ2U2it + θ3U3it + θ4U4it + θ5U5it + εit (1)
Here, WB stands for some measure of individual well-being, and X is a vector of standard controls. To pick up adaption, we split the unemployed up into six groups: those who have been unemployed 0-1 years, 1-2 years, 2-3 years, and so on up to the last group who have been unemployed five years or more. With no adaptation, all of the values of θ will be roughly the same; with adaptation the later values of θ will be less negative – we will observe individuals “bouncing back” from unemployment; with complete adaptation some of the later values of θ will be insignificant. Equation
(1) includes an individual fixed effect, αi, so that we test adaptation by comparing, for example, the
well-being of those who have been unemployed for 1-2 years to the well-being scores reported by the same individuals in their first year of unemployment.
A similar approach is taken to model anticipation. The U dummies now show whether the individual will enter unemployment in the next 0-1 years, 1-2 years, 2-3 years, or 3-4 years, and we estimate:
WBit = αi + β’Xit + θ-4U-4,it + θ-3U-3,it + θ-2U-2,it + θ-1U-1,it + εit (2)
We estimate equations (1) and (2) separately.
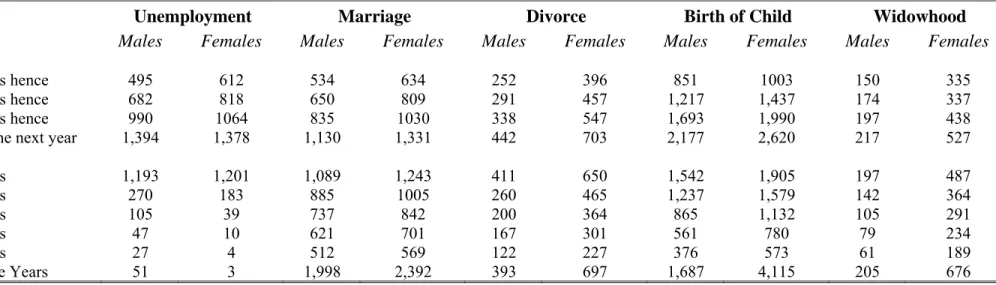
Table 2 summarises the number of occurrences of each event in our sample after imposing the above restrictions. These refer to the number of events that can be matched to GHQ scores, which are available at every wave of the BHPS; the number of events that can be matched to life satisfaction scores is necessarily somewhat lower.
[Table 2 about here]
4. Regression results
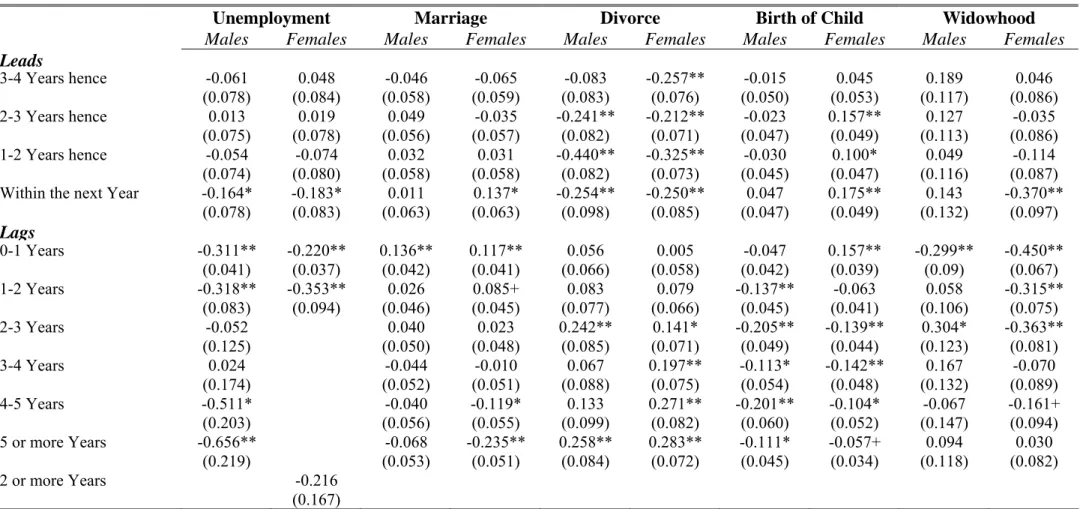
Table 3 summarises the key estimated coefficients on the lags and leads variables when life satisfaction is the dependent variable. The first two columns refer to the results for unemployment. As the estimated leads coefficients suggest, both men and women who will enter unemployment within the next year report significantly lower levels of life satisfaction. The estimated lag coefficients for men suggest that unemployment is generally associated with significantly lower well-being. The negative and statistically significant coefficient of unemployment of five or more years’ duration suggests that
there is little evidence of quick adaptation to unemployment: unemployment starts off bad and pretty much stays bad (see also Clark, 2006). The estimated lag coefficients for women reveal a significant negative well-being effect of unemployment for at least the first two years. Unfortunately, the very small sample cell sizes do not allow us to analyse life satisfaction adaptation to unemployment for women beyond these first two years.
[Table 3 about here]
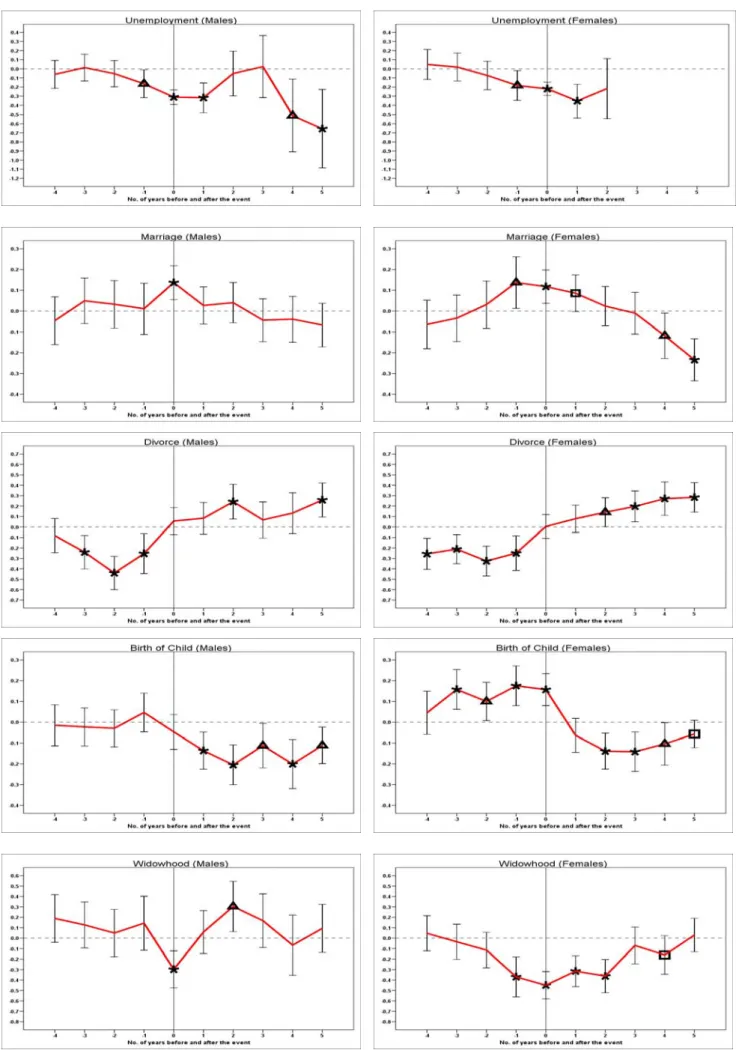
The remaining columns of Table 3 present the analogous estimated lag and lead coefficients for the four other life events under consideration. For ease of reading, these results are summarised graphically in Figure 1. The dashed horizontal line corresponds to an effect of zero, representing no effect of the event on life satisfaction. The vertical bars around each point refer to the 95% confidence interval. The top two graphs in Figure 1 trace out these within-subject movements in life satisfaction around the entry into unemployment for men and women. As discussed previously, there is little evidence of habituation (although we cannot explain the blip at around three to four years for men), and lower life satisfaction precedes the transition from employment to unemployment.
The following pair of graphs in Figure 1 refers to a positive event: marriage. As might be expected (or hoped), the correlation between marriage and life satisfaction is positive. The peak life-satisfaction effect of marriage occurs around the year that it happens. However, this well-being boost is not permanent in nature. In this data, we cannot reject the hypothesis of full adaptation to marriage, and indeed the longer-run correlation between marriage and life satisfaction is negative for women. There is also some evidence of a lead effect one year prior to marriage for women.
[Figure 1 about here]
The dynamic effect of divorce in the third set of graphs in Figure 1 is to some extent the mirror image of that of marriage. Habituation to divorce would appear to be both fairly rapid and complete. There is even evidence that both men and women who divorced five or more years ago are currently significantly more satisfied with their lives. There are strong lead effects: for two years for women and four years for men.
The next event is more positive: birth of child. A very recent arrival has a positive effect on women’s life satisfaction, but no significant effect on men’s. However, by the time the child is two or more years old, the estimated coefficients turn negative for both sexes and remain so thereafter. There are significant positive lead effects of the birth of a child for women, but none for men.
The last set of results refers to widowhood. Whilst for men the longer-run effect is zero, or even positive, the short-run effects are large and negative. The Figure for men shows that widowhood has a
sharp impact effect, which however largely dissipates after two years. There thus seems to be complete habituation to widowhood in the BHPS data. However, widowhood seems to have a longer lasting impact for women. The figure for women shows a statistically significant one-year lead effect for women.
Thus far, the results regarding adaptation in the BHPS are remarkably similar to those obtained in
the GSOEP data by Clark et al. (2008).2 However, both of these analyses used a single-item measure of
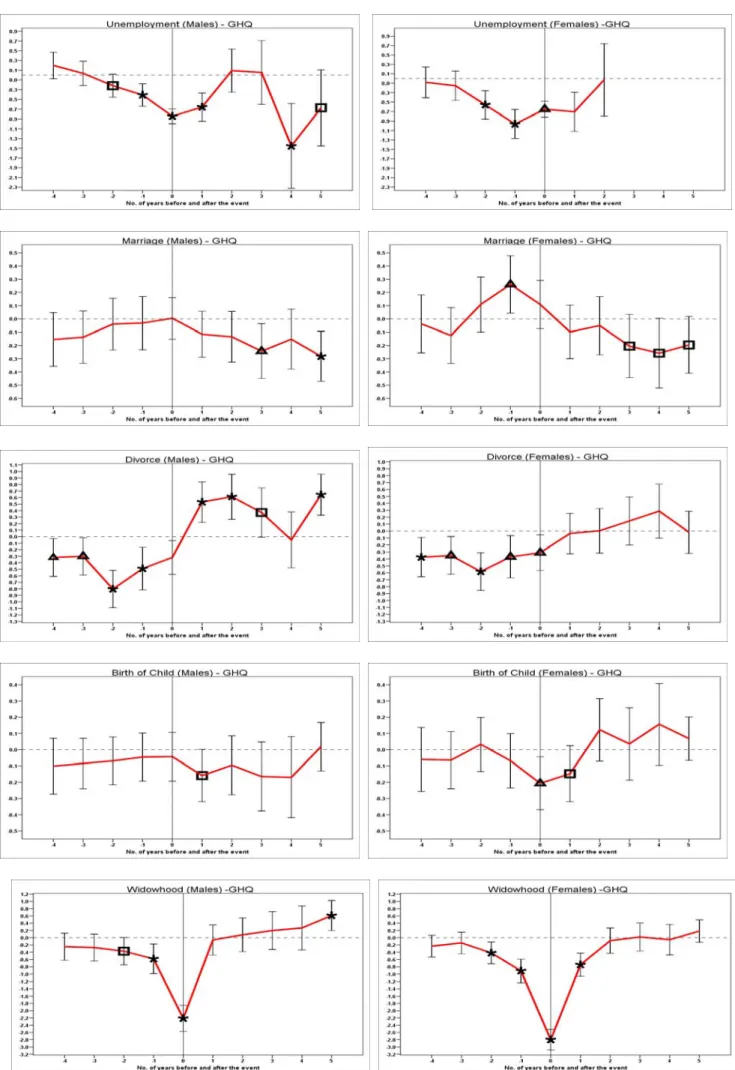
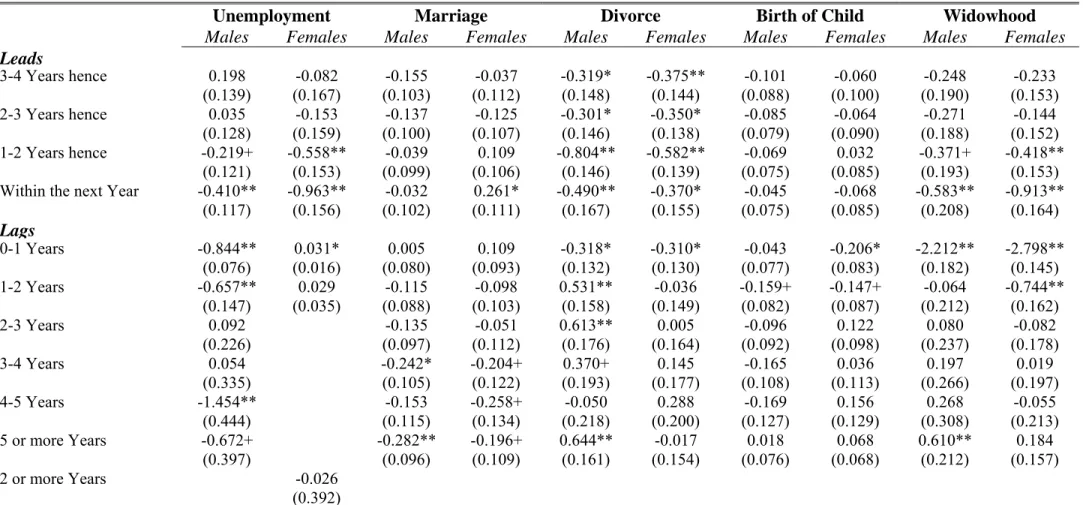
well-being, overall life satisfaction. One of the advantages of the BHPS data used here is that it also contains a widely-used multiple-item measure of well-being, the GHQ-12. The empirical results in Table 4 and Figure 2 then show whether the same kind of lags and leads patterns are found using this different measure of individual well-being.
The results using the GHQ turn out in fact to be qualitatively very close to those from the analysis of life satisfaction. The negative well-being effect of unemployment does not dissipate quickly for men (although we do see the same blip at durations of three to four years as noted above for life satisfaction). Men who have been unemployed for five or more years continue to report statistically significant lower GHQ scores. For women, the effect persists for at least two years. The estimated lead effects suggest that such a negative impact of unemployment is anticipated for at least a year before the entry into unemployment (one year prior to the event for men and two years for women).
[Table 4 about here]
Figure 2 summarises the GHQ findings for all five of the life events that we consider here. Overall, the results are similar to those based on the analysis of life satisfaction. For all events bar unemployment there is evidence of habituation and adaptation towards baseline levels. There are three points for which the GHQ results differ somewhat from those obtained for life satisfaction in Figure 1. First, the coefficient on marriage of five or more years’ duration is negative and significant for both sexes in the GHQ analysis, whereas this only held for women with respect to life satisfaction. Second, the positive effects of divorce which were significant for women regarding life satisfaction remain positive, but insignificant, in the GHQ analysis. Last, and perhaps most telling, the significant negative effects of children on life satisfaction are sharply attenuated for the GHQ score. One interpretation of this result is that children may well reduce hedonic enjoyment of life, but improve other more eudaimonic aspects of life (such as purpose and meaning) which are picked up by the questions that
2 The results are not, however, totally consistent with those in Angeles (2009) using the first fifteen waves of the BHPS.
Apart from the number of waves of data used, there are differences in the control variables used in the life satisfaction equations, and Angeles estimates a single equation for both anticipation and adaptation (whereas we estimate these phenomena separately), Last, Angeles seems to put those who enter and then leave unemployment back into the control group, whereas we drop observations on individuals once they leave the state in question. One reason for doing so is that those who return to employment after unemployment have systematically lower levels of well-being than those who did not enter unemployment (Clark et al., 2001). This may well mechanically produce an adaptation effect over time.
form the GHQ score.3
[Figure 2 about here]
5. Personality and Adaptation
In Wave 15 of the BHPS, an attempt was made to measure individual personalities. These were captured by five broad dimensions that are known as the “Big Five”, reflecting the traits of Extraversion, Agreeableness, Conscientiousness, Neuroticism, and Openness to Experience. Extraversion refers to individual differences in sociability, gregariousness, level of activity, and the
experience of positive affect.4 Concretely, these were picked up by fifteen questions, asking individuals
to what extent they saw themselves as someone who: • Is sometimes rude to others
• Does a thorough job • Is talkative
• Worries a lot
• Is original, comes up with new ideas • Has a forgiving nature
• Tends to be lazy • Is outgoing, sociable • Gets nervously easily
• Values artistic, aesthetic experiences • Is considerate and kind to almost everyone • Does things efficiently
• Is reserved
• Is relaxed, handles stress well • Has an active imagination
Each of the fifteen questions is answered on a one to seven scale, where one refers to "Does not apply" and seven to "Applies perfectly". The five personality traits are picked up by three each of these fifteen questions. For example, that of agreeableness is reflected by the respondent's answers to the
3 The psychology literature has, for example, specifically argued that eudaimonia, which captures functional aspects of
well-being, plays a separate role to the hedonic part of well-being (happiness or life satisfaction). These functionings include autonomy, competence, personal growth, positive relationships, self-acceptance, engagement and meaning (see Deci and Ryan, 2000, Ryff, 1989, and Ryff and Singer, 1998).
4 The BHPS Users’ Manual Volume A describes Agreeableness as individual differences in altruistic behaviour, trust,
warmth, and kindness. Conscientiousness refers to individual differences in self-control, task-orientation, and rule-abiding. Neuroticism refers to individual differences in the susceptibility to distress and the experience of negative emotions such as anxiety, anger, and depression. Finally, Openness to Experience refers to individual differences in the propensity for originality, creativity, and the acceptance of new ideas.
questions above referring to rudeness, being forgiving, and being considerate and kind. We here ask whether individual personality, as measured at Wave 15, is correlated with the adaptation process. We have five different life events, two different sexes, and five different personality measures, so it is obviously possible to come up with a great deal of numbers here.
We have decided to concentrate on only one personality measure, extraversion. This is picked up by the questions on being talkative, outgoing and sociable, and being reserved. The assumption that we make here is that personality is to a great extent fixed over time, so that we can interact adaptation profiles, which are by definition measured over a number of consecutive waves of the BHPS, with the personality measures that were collected at Wave 15 only.
Personality has been shown to predict many important job-related behaviors and attitudes, including job performance, job satisfaction, training performance, and leadership. Among the Big Five personality traits, extraversion is considered in the psychological literature to be related to career success overall, especially in jobs requiring a high degree of interpersonal work. As Barrick and Mount (1991) argue, individuals high in this trait are more likely to engage in learning experiences that enhance their performance at work. In a meta-analysis of European studies on the link between personality and job performance, Saldago (1997) finds, for example, that extraversion is a valid predictor of performance for managers and the police, two occupations in which interpersonal characteristics are likely to be important. However, his findings suggest that extraversion is not a valid predictor for training proficiency, contrary to Barrick and Mount (1991). Economists have also shown interest in exploring how personality traits affect labour market outcomes and in particular wages (see e.g. Goldsmith et. al. 1997, Bowles et. al. 2001, Nyhus and Pons 2005, among others). Nandi and Nicoletti (2009) examine how the Big Five personality traits affect wages using the BHPS data, finding that openness and extraversion are rewarded in the workplace, in terms of higher earnings, while agreeableness and neuroticism are penalised. However, Heineck (2007) does not find a significant
monotonic relationship between extraversion and hourly wage in the BHPS sample.5
However, extraversion has not to our knowledge specifically been considered in relation to the
time profile of well-being around significant life-events.6 We here do so by separately running the
regressions in Table 3 for extraverts and intraverts. Our definition of an extravert here is someone who reports a high score (greater than five) for both questions E1 (talkative) and E2 (outgoing and sociable). Conversely, an intravert is someone who reports a lower score (less than or equal to five) for
both questions E1 and E2.7
We do not here produce the tables of regression results for space reasons. The estimated coefficients are illustrated graphically. Not all of these separate regressions produced particularly
5 For a summary of the main explanations in the literature of why personality traits may affect wages see Nandi and
Nicoletti (2009).
6 Donnellan and Lucas (2008) consider the general intertemporal relationship between age and personality, using
information from both the BHPS and the GSOEP. They in particular show that extraversion tends to fall with age.
salient results; those that are more so are depicted in Figures 3a through 3c. Figure 3a shows that the life satisfaction profile around entry into unemployment differs for extraverts and intraverts. In particular, at least after a couple of years of unemployment, male extraverts seem to do rather better
than do intraverts.8 No such relationship is found for unemployed women.
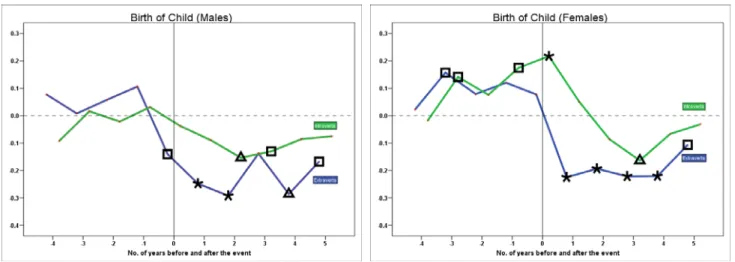
Figure 3b reproduces this analysis for the birth of a child, this time for both men and women. The suggestive evidence here is that the birth of a child is a less hedonically satisfying event for extraverts, whether they be the mother or the father. While the same broad life satisfaction profile is seen for both intraverts and extraverts, it is much more muted for the former. Extraverts would seem to take a particularly large life satisfaction hit on the birth of a child.
Last, Figure 3c traces out movements in life satisfaction upon divorce. Figure 2 had suggested that the general profile here was U-shaped, with satisfaction bottoming out in the year or two preceding divorce and then (especially for men) being significantly higher after divorce. Figure 3c brings more detail to these overall shapes. The tempting conclusion from this Figure is that extraverts suffer less from divorce. Here the distinction would seem particularly clear for women: the bottoming-out preceding divorce is significantly attenuated for extraverts, and the rise in satisfaction following divorce is both greater in magnitude and more significant. The picture for men here is somewhat more mixed. While male extraverts report almost no lower life satisfaction figures before divorce, as opposed to a sharp fall for intraverts, the picture post-divorce is fairly similar for the two personality types.
6. Conclusion
This paper has used sixteen waves of British panel data to examine the relationship between subjective well-being and past, contemporaneous, and future labour market and life events. We have three main conclusions.
The first is that the remarkably similar patterns of adaptation from our analysis of the BHPS data compared to those found in Clark et al.’s (2008) analysis of the GSOEP suggest that adaptation is a general phenomenon, rather than being only found in German data.
The second is that the BHPS allows us to compare movements in subjective well-being using both a commonly-found single-item measure (life satisfaction), and a multiple-item measure of psychological functioning (the GHQ-12). While some differences in the well-being profiles are apparent, the overall conclusion is that the profiles are qualitatively fairly similar. The phenomena of anticipation and adaptation would then seem to be fairly general, and not the preserve of any specific well-being measure.
Last, we have presented some novel evidence that personality may modify the adaptation profiles
8 If extraversion is indeed linked to labour-market success, then extraverts may exit from unemployment faster than
intraverts. As such, after a number of years of unemployment, the extravert sample will be more selected than is that of intraverts. If overall psychological functioning is a predictor for unemployment duration (with those who are "doing better" leaving sooner), then the profile of extraverts will be biased downwards more than is that of intraverts.
associated with life events. We have here only looked at one personality aspect, extraversion. This was shown to be associated with adaptation profiles that were more positive for men with respect to unemployment, and more positive for both sexes with respect to divorce. Extraversion does not however seem to be a totally unpoisoned chalice. The analysis of life satisfaction profiles around the time of the birth of a child indicated that extraverts exhibited more negative life satisfaction profiles than did intraverts.
The time profile of well-being around significant life events will likely continue to be the subject of lively research in Social Science. The research presented here has suggested that the same broad anticipation and adaptation profiles can be found in panel datasets from two different countries, and furthermore do not seem to be artificial constructs of the well-being questions used, as the same profiles are by and large found in the analysis of two very different well-being measures in the BHPS data.
While there may then be broad agreement regarding the concepts of anticipation and adaptation, much of the research to date has traced out average adaptation profiles. The current paper has made a small step forward here, in showing that individuals with different personality types exhibit different kinds of adaptation profiles. The identification of different groups that do better or worse in the face of significant life events not only informs us directly about the changing distribution of well-being over time, but may also provide some clues about why different groups do not adapt in the same way. While there is no clear optimal degree of adaptation (in well-being terms, we would probably like individuals not to adapt to good events, but to adapt to bad events), any adaptation that we do observe might be determined by variables that are to some extent under the control of policy-makers. The extent to which we can, and should wish to, affect the degree of adaptation to life events remains an open question.
APPENDIX A
The 12 questions used to create the GHQ-12 measure appear in the BHPS questionnaire as follows: 1. Here are some questions regarding the way you have been feeling over the last few weeks. For each
question please ring the number next to the answer that best suits the way you have felt.
Have you recently . . .
a) been able to concentrate on whatever you’re doing?
Better than usual . . . 1
Same as usual . . . .2
Less than usual . . . .3
Much less than usual . . . 4
then b) lost much sleep over worry? e) felt constantly under strain? f ) felt you couldn’t overcome your difficulties? i) been feeling unhappy or depressed? j) been losing confidence in yourself? k) been thinking of yourself as a worthless person? with the responses: Not at all . . . 1
No more than usual . . . 2
Rather more than usual . . . . 3
Much more than usual . . . . .4
then c) felt that you were playing a useful part in things? d) felt capable of making decisions about things? g) been able to enjoy your normal day-to-day activities? h) been able to face up to problems? l) been feeling reasonably happy, all things considered? with the responses: More so than usual . . . .1
About same as usual . . . .2
Less so than usual . . . .3
REFERENCES
Angeles, L. (2009). ‘Adaptation and anticipation effects to life events in the United Kingdom’. University of Glasgow, mimeo.
Barrick, M.R. and Mount, M.K. (1991). ‘The big five personality dimensions and job performance: a meta-analysis’, Personnel Psychology, 44, pp 1-26.
Bowles, S., Gintis, H. and Osborne, M. (2001). ‘Incentive-enhancing preferences: Personality, behaviour and earnings’, American Economic Review, 91(2), pp. 155-158.
Clark, A.E. (2003). "Unemployment as a Social Norm: Psychological Evidence from Panel Data".
Journal of Labor Economics, 21, 323-351.
Clark, A.E. (2006). ‘A Note on Unhappiness and Unemployment Duration’. Applied Economics
Quarterly, vol. 52, pp. 291-308.
Clark, A.E., Diener, E., Georgellis, Y. and Lucas, R. (2008). “Lags and Leads in Life Satisfaction: A Test of the Baseline Hypothesis”, Economic Journal, vol.118, pp. F222–F243.
Clark A.E., Georgellis, Y., and Sanfey, P. (2001). ‘Scarring: The psychological impact of past unemployment’. Economica, vol. 68, pp. 221-241.
Clark A.E. and Oswald, A.J. (1994). ‘Unhappiness and unemployment’. Economic Journal, vol. 104, pp. 648-59.
Deci, E. and Ryan, R. (2000), ‘The "what" and "why" of goal pursuits: Human needs and the self-determination of behaviour’, Psychological Inquiry, vol. 11, pp. 227-268.
Donnellan, B. and Lucas, R. (2008), ‘Age differences in the big five across the life span: evidence from two national samples’, Psychology and Aging, vol. 23, pp. 558-566.
Ferrer-i-Carbonell, A., and Van Praag, B. (2008). ‘Do people adapt to changing circumstances? The discussion is not finished yet’. ICREA, mimeo.
Frijters, P., Johnson, D., Shields, M.A. (2010), ‘Happiness Dynamics with Quarterly Life Event Data’,
Scandinavian Journal of Economics, forthcoming.
Gardner, J. and Oswald, A.J. (2006). ‘Do Divorcing Couples Become Happier By Breaking Up?’
Journal of the Royal Statistical Society Series A, vol. 169, pp. 319-336.
Goldberg, D.P. (1972). The Detection of Psychiatric Illness by Questionnaire. Oxford: Oxford University Press.
Goldsmith, A. Veum, J. and Darity, W. (1997). ‘The impact of psychological and human capital on wages’, Economic Inquiry, 35(4), pp.815-829.
Heineck, G. (2007), ‘Does it pay to be nice? Personality and earnings in the UK’, University of Erlangen-Nuremberg, LASER Discussion Paper No. 3.
Lucas, R. (2005). ‘Time does not heal all wounds - A longitudinal study of reaction and adaptation to divorce’. Psychological Science, vol. 16, pp. 945-950.
Lucas, R. (2007). ‘Adaptation and the set-point model of subjective well-being: Does happiness change after major life events?’ Current Directions in Psychological Science, vol. 16 (2), pp. 75-79. Lucas, R. and Clark, A.E. (2006). ‘Do People Really Adapt to Marriage?’ Journal of Happiness
Studies, vol. 7, pp. 405-426.
Lucas, R.E., Clark A.E., Georgellis, Y. and Diener E. (2003). ‘Re-examining adaptation and the set point model of happiness: reactions to changes in marital status’, Journal of Personality and
Social Psychology, vol. 84, pp. 527-539.
Lucas, R.E., Clark A.E., Georgellis, Y. and Diener E. (2004). ‘Unemployment Alters the Set-Point for Life Satisfaction’. Psychological Science, vol. 15, pp. 8-13.
Nandi, A. and Nicoletti, C. (2009), ‘Explaining personality pay gaps in the UK’, University of Essex, ISER Discussion Paper No. 2009-22.
Nyhus, E. and Pons, E. (2005). ‘The effects of personality on earnings’, Journal of Economic
Psychology, 26, pp. 363-384.
Oswald, A. and Powdthavee, N. (2008). ‘Does happiness adapt? A longitudinal study of disability with implications for economists and judges’. Journal of Public Economics, Vol. 92, pp. 1061-1077 Ryff, C. (1989), ‘Happiness is everything, or is it? Explorations on the meaning of psychological
well-being’, Journal of Personality and Social Psychology, vol. 57, pp. 1069-1081.
Ryff, C. and Singer, B. (1998), ‘The contours of positive human health’, Psychological Inquiry, vol. 9, pp. 1-28.
Saldago, J. (1997). ‘The five factor model of personality and job performance in the European Community’, Journal of Applied Psychology, 82(1), pp. 30-43.
Stutzer, A. and Frey, B.S. (2006). ‘Does Marriage Make People Happy, Or Do Happy People Get Married?’ Journal of Socio-Economics, vol. 35, pp. 326-347.
Figure 1. The Dynamic Effect of Life and Labour Market Events on Life Satisfaction
Figure 2. The Dynamic Effect of Life and Labour Market Events on GHQ well-being
Figure 3a. Extraversion and Adaptation to Unemployment: Life Satisfaction
Figure 3b. Extraversion and Adaptation to Birth of Child: Life Satisfaction
Figure 3c. Extraversion and Adaptation to Divorce: Life Satisfaction
Table 1a. The distribution of life satisfaction in the analysis sample of the BHPS
Life satisfaction Males Females
Count % Count % 1 584 1.25 879 1.61 2 1046 2.24 1339 2.46 3 2984 6.39 3578 6.56 4 6518 13.97 8391 15.39 5 15394 32.99 16264 29.84 6 15807 33.88 17651 32.38 7 4329 9.28 6409 11.76 Total 46662 100.00 54511 100.00 Note: These numbers refer to the sample aged 16-60.
Table 1b. The distribution of the GHQ-12 measure of well-being in the analysis sample of the BHPS
GHQ-12 Males Females Count % Count % 0 853 1.23 1695 2.11 1 665 0.96 1391 1.73 2 690 1.00 1492 1.86 3 867 1.25 1596 1.99 4 1020 1.47 1804 2.25 5 1231 1.78 2147 2.67 6 1651 2.38 2485 3.09 7 2066 2.98 3028 3.77 8 2640 3.81 3732 4.65 9 3617 5.22 4928 6.13 10 5513 7.95 6817 8.49 11 9976 14.39 10839 13.49 12 38537 55.59 38375 47.77 Total 69326 100.00 80329 100.00
Table 2. The Number of Lags and Leads Observations
Unemployment Marriage Divorce Birth of Child Widowhood
Males Females Males Females Males Females Males Females Males Females
Leads
3-4 Years hence 495 612 534 634 252 396 851 1003 150 335
2-3 Years hence 682 818 650 809 291 457 1,217 1,437 174 337
1-2 Years hence 990 1064 835 1030 338 547 1,693 1,990 197 438
Within the next year 1,394 1,378 1,130 1,331 442 703 2,177 2,620 217 527
Lags 0-1 Years 1,193 1,201 1,089 1,243 411 650 1,542 1,905 197 487 1-2 Years 270 183 885 1005 260 465 1,237 1,579 142 364 2-3 Years 105 39 737 842 200 364 865 1,132 105 291 3-4 Years 47 10 621 701 167 301 561 780 79 234 4-5 Years 27 4 512 569 122 227 376 573 61 189 5 or more Years 51 3 1,998 2,392 393 697 1,687 4,115 205 676
Note: The number of events is calculated for those aged 16-60, with the exception of birth of child, based on the sample of those aged 16-40 and widowhood which is based on a sample
Table 3. The Effect of Life and Labour Market Events on Life Satisfaction. Fixed Effect “Within” Regressions.
Unemployment Marriage Divorce Birth of Child Widowhood
Males Females Males Females Males Females Males Females Males Females
Leads 3-4 Years hence -0.061 0.048 -0.046 -0.065 -0.083 -0.257** -0.015 0.045 0.189 0.046 (0.078) (0.084) (0.058) (0.059) (0.083) (0.076) (0.050) (0.053) (0.117) (0.086) 2-3 Years hence 0.013 0.019 0.049 -0.035 -0.241** -0.212** -0.023 0.157** 0.127 -0.035 (0.075) (0.078) (0.056) (0.057) (0.082) (0.071) (0.047) (0.049) (0.113) (0.086) 1-2 Years hence -0.054 -0.074 0.032 0.031 -0.440** -0.325** -0.030 0.100* 0.049 -0.114 (0.074) (0.080) (0.058) (0.058) (0.082) (0.073) (0.045) (0.047) (0.116) (0.087)
Within the next Year -0.164* -0.183* 0.011 0.137* -0.254** -0.250** 0.047 0.175** 0.143 -0.370**
(0.078) (0.083) (0.063) (0.063) (0.098) (0.085) (0.047) (0.049) (0.132) (0.097) Lags 0-1 Years -0.311** -0.220** 0.136** 0.117** 0.056 0.005 -0.047 0.157** -0.299** -0.450** (0.041) (0.037) (0.042) (0.041) (0.066) (0.058) (0.042) (0.039) (0.09) (0.067) 1-2 Years -0.318** -0.353** 0.026 0.085+ 0.083 0.079 -0.137** -0.063 0.058 -0.315** (0.083) (0.094) (0.046) (0.045) (0.077) (0.066) (0.045) (0.041) (0.106) (0.075) 2-3 Years -0.052 0.040 0.023 0.242** 0.141* -0.205** -0.139** 0.304* -0.363** (0.125) (0.050) (0.048) (0.085) (0.071) (0.049) (0.044) (0.123) (0.081) 3-4 Years 0.024 -0.044 -0.010 0.067 0.197** -0.113* -0.142** 0.167 -0.070 (0.174) (0.052) (0.051) (0.088) (0.075) (0.054) (0.048) (0.132) (0.089) 4-5 Years -0.511* -0.040 -0.119* 0.133 0.271** -0.201** -0.104* -0.067 -0.161+ (0.203) (0.056) (0.055) (0.099) (0.082) (0.060) (0.052) (0.147) (0.094) 5 or more Years -0.656** -0.068 -0.235** 0.258** 0.283** -0.111* -0.057+ 0.094 0.030 (0.219) (0.053) (0.051) (0.084) (0.072) (0.045) (0.034) (0.118) (0.082) 2 or more Years -0.216 (0.167)
Notes: Standard errors in parentheses; + significant at 10%; * significant at 5%; ** significant at 1%; other controls include marital status, health, education, number of children, age,
Table 4. The Effect of Life and Labour Market Events on GHQ. Fixed Effect “Within” Regressions.
Unemployment Marriage Divorce Birth of Child Widowhood
Males Females Males Females Males Females Males Females Males Females
Leads 3-4 Years hence 0.198 -0.082 -0.155 -0.037 -0.319* -0.375** -0.101 -0.060 -0.248 -0.233 (0.139) (0.167) (0.103) (0.112) (0.148) (0.144) (0.088) (0.100) (0.190) (0.153) 2-3 Years hence 0.035 -0.153 -0.137 -0.125 -0.301* -0.350* -0.085 -0.064 -0.271 -0.144 (0.128) (0.159) (0.100) (0.107) (0.146) (0.138) (0.079) (0.090) (0.188) (0.152) 1-2 Years hence -0.219+ -0.558** -0.039 0.109 -0.804** -0.582** -0.069 0.032 -0.371+ -0.418** (0.121) (0.153) (0.099) (0.106) (0.146) (0.139) (0.075) (0.085) (0.193) (0.153)
Within the next Year -0.410** -0.963** -0.032 0.261* -0.490** -0.370* -0.045 -0.068 -0.583** -0.913**
(0.117) (0.156) (0.102) (0.111) (0.167) (0.155) (0.075) (0.085) (0.208) (0.164) Lags 0-1 Years -0.844** 0.031* 0.005 0.109 -0.318* -0.310* -0.043 -0.206* -2.212** -2.798** (0.076) (0.016) (0.080) (0.093) (0.132) (0.130) (0.077) (0.083) (0.182) (0.145) 1-2 Years -0.657** 0.029 -0.115 -0.098 0.531** -0.036 -0.159+ -0.147+ -0.064 -0.744** (0.147) (0.035) (0.088) (0.103) (0.158) (0.149) (0.082) (0.087) (0.212) (0.162) 2-3 Years 0.092 -0.135 -0.051 0.613** 0.005 -0.096 0.122 0.080 -0.082 (0.226) (0.097) (0.112) (0.176) (0.164) (0.092) (0.098) (0.237) (0.178) 3-4 Years 0.054 -0.242* -0.204+ 0.370+ 0.145 -0.165 0.036 0.197 0.019 (0.335) (0.105) (0.122) (0.193) (0.177) (0.108) (0.113) (0.266) (0.197) 4-5 Years -1.454** -0.153 -0.258+ -0.050 0.288 -0.169 0.156 0.268 -0.055 (0.444) (0.115) (0.134) (0.218) (0.200) (0.127) (0.129) (0.308) (0.213) 5 or more Years -0.672+ -0.282** -0.196+ 0.644** -0.017 0.018 0.068 0.610** 0.184 (0.397) (0.096) (0.109) (0.161) (0.154) (0.076) (0.068) (0.212) (0.157) 2 or more Years -0.026 (0.392)
Notes: Standard errors in parentheses; + significant at 10%; * significant at 5%; ** significant at 1%; other controls include marital status, health, education, number of children, age,