HAL Id: hal-02119534
https://hal.archives-ouvertes.fr/hal-02119534
Submitted on 24 Nov 2020
HAL is a multi-disciplinary open access
archive for the deposit and dissemination of sci-entific research documents, whether they are pub-lished or not. The documents may come from teaching and research institutions in France or abroad, or from public or private research centers.
L’archive ouverte pluridisciplinaire HAL, est destinée au dépôt et à la diffusion de documents scientifiques de niveau recherche, publiés ou non, émanant des établissements d’enseignement et de recherche français ou étrangers, des laboratoires publics ou privés.
Deposition and characterization of (Ti, Al)N coatings
deposited by thermal LPCVD in an industrial reactor
Florent Uny, Sofiane Achache, Salim Lamri, Jaafar Ghanbaja, Evelyne Fischer,
Michel Pons, Elisabeth Blanquet, Frédéric Schuster, Frédéric Sanchette
To cite this version:
Florent Uny, Sofiane Achache, Salim Lamri, Jaafar Ghanbaja, Evelyne Fischer, et al.. Deposition and characterization of (Ti, Al)N coatings deposited by thermal LPCVD in an industrial reactor. Surface and Coatings Technology, Elsevier, 2019, 358, pp.923-933. �10.1016/j.surfcoat.2018.12.014�. �hal-02119534�
Florent Uny, Sofiane Achache, Salim Lamri, Jaafar Ghanbaja, Evelyne
Fischer, Michel Pons, Elisabeth Blanquet, Frederic Schuster Frederic Sanchette,
Deposition and characterization of (Ti, Al)N coatings deposited by
thermal LPCVD in an industrial reactor.
Surface and Coatings Technology, Elsevier, 2019, 358, pp.923-933.
10.1016/j.surfcoat.2018.12.014
ABSTRACT
The increased need for protecting cutting tools has led to the development of more and more efficient coatings. Ti-Al-N is one of the most studied systems in the hard coating industry due to the high hardness and good oxidation resistance of Ti1−xAlxN coatings. The development of LPCVD processes has led to the discovery of new
microstructures and morphologies. In this study, we discuss the microstructural and morphological changes caused by varying the aluminum content in films deposited by low pressure thermal CVD in an industrial reactor at low carrier gas flow and relatively high pressure (> 4 kPa). Coatings were characterized using FE-SEM, XRD and TEM analysis, revealing the growth of nanolamellae with modulated Al and Ti contents for the lowest Al containing coatings. The coatings with the highest Al contents were also found to show particular cube-shaped grains with a micromodulation of composition. Experimental Al content values are higher than the calculated one and their evolutions with the AlCl3/(AlCl3 + TiCl4) molar ratio are similar. The hardness and oxidation resistance were
characterized and compared with available data in literature. Higher hardness is obtained for coatings having an Al content up to x = 0.65 and a hardness drop is found for higher Al contents. The oxidation resistance of the coatings rises continuously with an increasing Al content.
Introduction
For several decades, increasing productivity in many industrial domains has led to a significant and ever increasing interest for protective and hard coatings. In this context, nitrides and particularly titanium nitrides were widely used, especially for applications such as machining operations, for which chemical and mechanical stability at high temperatures are needed. An enhancement of the thermal stability and mechanical properties can be achieved by adding aluminum as an alloying element in the metastable fcc-structure. The deposition of Ti1−xAlxN coatings near to
equilibrium conditions leads to the formation of stable fcc-TiN and hcp-AlN [1]. Moreover, the thermodynamic data also shows that fcc-TiN and the metastable fcc-AlN phase are im- miscible over almost the whole range of Al content, and that the de- position of fcc-Ti1−xAlxN solid solution is thermodynamically unexpected [2,3]. It was then
demonstrated that the growth of metastable fcc-Ti1−xAlxN coatings with various Al contents mainly results from
kinetic factors [4,5]. These coatings show particular spinodal decomposition, leading to the formation of fcc-TiN and fcc-AlN domains during annealing and then to a hardness enhancement due to the lattice parameter mismatch between these two phases [6–8]. Aluminum addition also allows an increase of the oxidation onset temperature of about 300 °C; from ≈500 °C for TiN coatings to ≈800 °C for Ti1−xAlxN coatings [9]. Researches have generally
focused on coatings with ever- increasing Al content in the fcc structure. While fcc-Ti1−xAlxN coatings obtained by
various Physical Vapor Deposition (PVD) techniques seem to be limited up to an aluminum content x of about 0.67–0.7 [10–12], the development of Low Pressure Chemical Vapor Deposition (LPCVD) techniques has shown x values up to 0.8–0.9, achieving hardness values higher than 30 GPa and oxidation resistance up to 1000 °C [13]. The growth of nanolamellae microstructures for high aluminum contents, obtained at pressure below 3.5 kPa and
high carrier gas flow rates in order to minimize the residence time of the species were thus reported by numerous studies. Keckes et al. first show the deposition of fcc- Ti0.05Al0.95N coatings with spontaneous growth of
hcp-AlN/fcc-TiN nanolamellae [14]. The fcc-Al(Ti)N (solid solution of Ti in the fcc-AlN phase) nanolamellae microstructure with a modulation of the Al and Ti contents and showing grains oriented along the [111] direction was later reported [15]. These coatings show promising mechanical prop- erties and oxidation resistance. More recently, the deposition of (111)- and (100)-oriented coatings with high thermal stability was reported [16]. These studies mainly concern Al-rich coatings. Relatively poor literature concerns the microstructural changes related to various Al contents in CVD thin films. Ishigaki et al. have thus deposited fcc- Ti1−xAlxN coatings with various Al content at a pressure of 5 kPa
without mentioning the carrier gas flow rate (H2) [17]. The proposal of this work is to investigate the microstructural
and morphological changes obtained by varying x in Ti1−xAlxN coatings, at 4 kPa and low carrier gas flow rates (H2
flow rate). Indeed, a low H2 flow rate favors the Al content homogeneity in our reactor. The measured Al content in
the coatings is then compared with thermodynamic calculations. Mechanical properties and oxidation resistance are
also discussed and compared to the state-of-the-art LPCVD Ti1−xAlxN coatings.
Fig. 1. Diagram of the reactor layout
1. Experimental details
Table 1
Summary of the parameters used for the deposition of Ti1−xAlxN with various Al contents.
Temperature 800 °C
Pressure 4 kPa
Deposition time 30 min
H2 flow 40 lpm
NH3 flow 0.75 lpm
AlCl3/TiCl4 molar ratio 0.5–2.8
NH3/(TiCl4 + AlCl3) molar ratio 0.88
Ti1−xAlxN coatings have been deposited with various Al contents WC/Co-11%, Al2O3 and M2 substrates (Fig. 1).
these conditions, even if a slight inhomogeneity in Al- content (< 15%) was found between the upper and bottom zones of the reactor. The deposition chamber is about 1250 mm in height and 300 mm in diameter. It consists of graphite plates on which the substrates are positioned. The gas injection is provided by mean of a graphite pipe passing through the trays and distributing gas onto each plate. Coatings were obtained from a mixture of TiCl4, AlCl3, NH3, N2
and H2. Titanium chloride is generated by dosing and vaporizing TiCl4 liquid. AlCl3 results from the in-situ chlorination of
aluminum pellets by using an adjusted HCl flow. Temperature and pressure used for chlorination are adjusted to generate almost only AlCl3 and its dimer Al2Cl6. H2 is used as a carrier gas and NH3 is injected directly into the reactor to
avoid unwanted reactions. The AlCl3/TiCl4 molar ratio was varied by adjusting the AlCl3 and TiCl4 flows to keep the
total molar amount constant. The other gas flows were fixed in order to have a NH3/ (TiCl4 + AlCl3) molar ratio of
0.88 and a NH3/H2 molar ratio of 0.02. These ratios were determined considering a chlorination yield (amount of
AlCl3 formed to the inlet HCl amount) of 1. Table 1 shows the main parameters used for Ti1−xAlxN deposition.
Pumping is carried out by a LRVP (Liquid Ring Vacuum Pump). Process by-products are treated in an alkaline solution (Fig. 1).
Thermodynamic calculations were carried out using the FactSage software with TiCl4, AlCl3, NH3, H2 and N2 gas as input
parameters. The molar amount of reactants used for these calculations was the same that those used for deposition, except for AlCl3, for which the molar amount was fixed at one third of the HCl value, assuming that all the HCl is
consumed to form AlCl3 during chlorination.
Coatings morphology was studied using Scanning Electron Microscopy (SEM) analysis in a Hitachi SU-8030 FE-SEM system and the composition was determined by mean of Electron Probe MicroAnalysis (EPMA) analysis, using a Jeol JXA 8530-F. Crystallographic structure was investigated by Grazing Angle X-Ray
Diffraction (GAXRD), using a Bruker D8 Advance diffractometer with the Kα1 radiation of Cu (λ = 0.1541 nm). The
system is equipped with a 2.0 mm collimator and an Axial Soller slit with an axial divergence of 2.5°. The incidence angle during the GAXRD analysis was determined experimentally to ensure that no signal from the WC/Co substrate was observed. Assuming the density of the coating plays a role in the X-rays absorption, the incidence angle was varied from 3° for the Ti-rich coatings to 1° for the Al-rich coatings. The structure and microstructure of the coatings were also studied by Transmission Electron Microscopy (TEM) and Scanning Transmission Electron Microscopy (STEM) ana- lyses, using a JEM-ARM 200F cold FEG TEM/STEM system. Elemental distribution in the TEM samples was analyzed using Energy Dispersive X-ray spectroscopy (EDX). An almost homogeneous distribution of Nitrogen in the coating is always found and the corresponding cartography is thus not presented. Prior to TEM analysis, the samples were prepared by Focus Ion Beam (FIB), using a MEB-FIB FEI Helios Nanolab 600i. The phases identification of the oxidized samples was also per- formed by GAXRD with an incidence angle of 5°, in order to increase the signal intensity. Hardness measurements were carried out on the sur- face of M2 pins by mean of a nanoindenter XP, MTS system corporation, using a Berkovitch diamond tip with 300 nm of penetration depth. Prior to the hardness measurements, the surface of the samples was polished with a silicon carbide paper (granulometry P4000). Twenty indents were performed on each sample and the average hardness value was considered. Oxidation resistance was investigated between 500 °C and 1000 °C in ambient air and during 1 h with a heating rate of 15 °C/ min and natural cooling to room temperature.
2. Results and discussions
2.1. Compositional analysis and thickness Table 2
EPMA chemical analysis of the Ti1−xAlxN coatings with various Al contents.
AlCl3/TiCl4 ratio 0.52 0.84 2.03 2.8
N (at.%) 45.7 6 46.80 46.68 46.71 Al (at.%) 3.88 31.8 1 41.37 42.11 Ti (at.%) 42.1 9 16.62 7.49 7.13 Cl (at.%) 0.68 0.32 1.20 0.90
x in Ti1−xAlxN 0.08 0.65 0.84 0.86
Chemical analyses of our coatings are summarized in Table 2. The Al content, x, in Ti1−xAlxN coatings, is defined as
the Al/(Al + Ti) (at.%) ratio. By varying the AlCl3/TiCl4 ratio from 0.52 to 2.8, the Al contents in the coatings are in
the range from x = 0.08 to x = 0.86. The coatings thickness is about 5 μm for the coating with the lowest Al-content (Ti0.92Al0.08N) to about 2.3 μm for the highest Al-containing coating (Ti0.14Al0.86N). The Cl contents (≤1.2
at.%) was found to be higher in coatings having the highest Al content. These results are consistent with those found in literature. This higher Cl content in the coatings (about 1.2 at.%) can result from an incomplete dissociation of AlCl3. As AlCl3 is considered as less reactive with NH3 than TiCl4, an increase of the AlCl3 amount in
the gas phase can result in higher Cl contents in the coatings [18].
2.2. Morphology, structure, and microstructure
SEM analyses are shown in Fig. 2 and give the surface coatings morphology for different aluminum contents. The Ti0.92Al0.08N film (Fig. 2-a) shows a globular morphology while a morphology showing top of cubes is found in the
Ti0.35Al0.65N coating (Fig. 2-b). By further increasing the Al content, cube-shaped grains seem to appear in Ti0.16Al0.84N
and become predominant for the Ti0.14Al0.86N coating (Fig. 2-c and 2-d, respectively).
Although the microstructural and morphological evolution is relatively poorly described in literature, the observation of globular grains for the Ti-rich coatings is consistent with the results obtained by Ishigaki et al. [17]. However, they reported the presence of this globular morphology on the full range of Al content. The growth of LPCVD films having tetrahedral and octahedral morphologies has recently been observed by some researchers [16,19]. Their Al-rich Ti0.2Al0.8N and Ti0.18Al0.82N coatings were found to have columnar grains with oriented growth of fcc-Al(Ti)N lamellae in
the [111] and [100] directions, respectively. However, there was no mention of the presence of cube- shaped grains as those found in Fig.2-c and -d. The reason of the growth of these cubes is not clear. The number of these cubes seems to increase in the coating containing the highest amount of aluminum. Further investigations are needed in order to establish hypotheses regarding the growth of these cubes.
Fig. 3-A-a shows the STEM – High Angle Annular Dark Field (STEM- HAADF) image corresponding to the cross-section of the Ti0.92Al0.08N coating. The EDX analyses performed on this Ti0.92Al0.08N coating are presented in Fig. 3-A-b and -A-c
and show the distribution of aluminum and titanium respectively.
The dark domains observed between the globular grains (Fig. 3-A-a) show the presence of cubes, that look like those observed in the high Al containing Ti0.14Al0.86N coating (see Fig. 2-d). These dark domains contain a higher Al content
than in the globular grains (Fig. 3-A-b and 3-A-c). These observations are consistent with the morphology, showing that the cube-shaped grains are observed in the coatings having a high Al content (Fig. 2-c and 2-d).
It is also clearly shown that the coating is composed of a stack of globular grains constituted of bright and dark lamellae (Fig. 3Aa), which correspond to a modulation of the composition inside these globular grains (Fig. 2c and -d). The dark and bright lamellae observed on the Bright Field (BF) STEM image (Fig. 3-A-b and 3-A-c) are a modulation of Ti-rich (97 at.%) and Ti-depleted (90 at.%) lamellae.
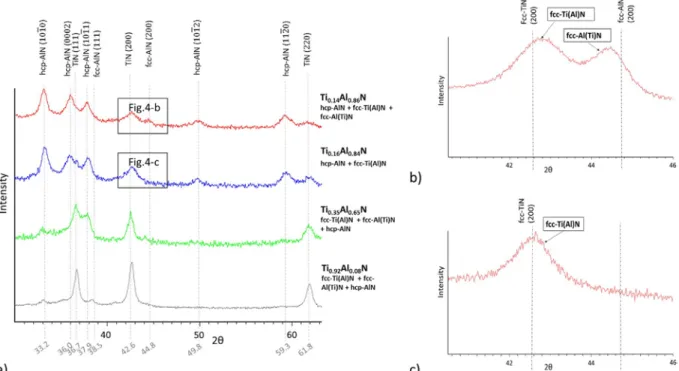
The XRD analysis performed on the Ti0.92Al0.08N coating (Fig. 4-a) shows mainly the {111}, {200} and {220} peaks of
the fcc-Ti(Al)N phase which is assumed to be the solid solution of Al in fcc-TiN. However, the peaks corresponding to this phase appear exactly at the position of the pure fcc-TiN peaks (PDF file 00–038-1420). The Al content in these grains is probably too low to create a significant shift of the fcc-Ti(Al)N peaks towards the high angles on our GAXRD experiments. This fcc-Ti(Al)N phase can then correspond to the globular grains shown in Fig. 3-A-a. A small peak is also detected at 38.3° and can be attributed to the fcc-Al(Ti)N {111} planes. Only a very weak reflection of the {1010} planes of the hcp-AlN is observed at a 2θ angle of 33.2°. The BF TEM micrograph of this Ti0.92Al0.08N coating is
shown in Fig. 5-A-a. The associated Selected Area Electron Diffraction (SAED) pattern seems to be representative of the globular grains in the coating. It only shows the presence of the fcc-Ti(Al)N phase while fcc-Al(Ti)N as well as hcp-AlN are not observed by this TEM analysis. Thus, this coating seems to be mainly constituted of the fcc-Ti(Al)N phase, even if some traces of the hcp-AlN and fcc-Al(Ti)N phases are detected by GAXRD. These phases should correspond to the dark domains observed in Fig. 3-A-a. Fig. 5-A- b shows the HRTEM image of the Ti0.92Al0.08N
coating and highlights the crystallized microstructure. The associated Fast Fourier Transformation (FFT) image confirms the presence of the fcc structure and shows the {111} and {200} planes with a [110] zone axis. The interplanar distances are evaluated to be ≈0.24 nm and ≈0.21 nm for the {111} and {200} planes respectively,
confirming the presence of fcc-Ti (Al)N with a very low Al content.
Fig. 2. Surface morphology of coatings deposited at 800 °C and 4 kPa; a) Ti0.92Al0.08N; b) Ti0.35Al0.65N;
c) Ti0.16Al0.84N; d) Ti0.14Al0.86N.
Several researchers reported the lamellae microstructure with modulation of the composition of aluminum and titanium but it was observed for coatings with higher Al contents [14,17,19]. The present results seem to mean that this particular lamellae microstructure is not dependent on the Al content. A fcc-Al(Ti)N nanolamellae micro- structure with a modulation of the Al and Ti contents was found for coatings with an overall Al content between x = 0.62 to x = 0.82 [17,19], while an hcp-AlN/fcc-TiN modulation was found for coatings with an Al content of x = 0.95 [14]. We can expect that the observation of this lamellae microstructure in our coating having an Al content of only x = 0.08 is due to the deposition conditions used here, which are closer to the equilibrium conditions than those found in literature. The relatively high pressure and the low H2 flow rate, thus leading to a higher residence time of the species, allow a
better mobility of the atoms at the surface and then promote the demixing of the solid solution associated with the growth of a modulated microstructure.
In summary, the dark domains should be hcp-AlN or fcc-Al(Ti)N and the globular grains are fcc-Ti(Al)N with a modulation of composition.
Fig. 3-B-a shows the STEM HAADF image of the Ti0.35Al0.65N coating cross section. The EDX cartographies
corresponding to aluminum and titanium are shown in Fig. 3-B-b and 3-B-c. Bright grains and grains constituted of bright and dark lamellae are observed (Fig. 3-B-a). The bright grains are almost exclusively com- posed of titanium (and nitrogen) (Fig. 3-B-c). The XRD pattern of the Ti0.35Al0.65N coating (Fig. 4-a) shows that the peaks corresponding to
the fcc-Ti(Al)N phase with a very low Al content are still predominant. Thus, it is assumed that the structure of these grains is fcc-Ti(Al)N with a very low Al content.
Fig. 3-B-b and -B-c also show that the bright and dark lamellae are respectively aluminum-rich and titanium-rich. The composition of the bright lamellae are 23 at.% Al and 30 at.% Ti, while that of the dark lamellae are 49 at.% Al and 5 at.% Ti. XRD analysis shows, in addition to the fcc-Ti(Al)N peaks, a strong reflection that can correspond to the {1011} peak of the hcp-AlN phase or to the {111} peak of the fcc-Al(Ti) N. The shift of this peak, compared to the position of the pure fcc-TiN peak, corresponds to an Al content x of about 0.67. This value is consistent with the
overall Al content found in this coating. So, this peak is probably associated with the fcc-Al(Ti)N phase. Moreover, a reflection that can be attributed to the fcc-Al(Ti)N phase is also observed at 44°. The BF TEM image and the associated diffraction pattern obtained on a grain constituted of bright and dark lamellae (Fig. 5-B) highlights only a fcc structure. These observations suggest the presence of a coherent fcc- Al(Ti)N lattice constituted of lamellae with a modulation of the Al and Ti contents.
Thus, the following assumptions can be made. (i) The XRD peak that can be indexed as the {1011} plane of hcp-AlN is actually the {111} peak of the fcc-Al(Ti)N phase, forming a nanostructured lattice with compositional modulation of aluminum and titanium. (ii) It is also possible that hcp-AlN domains, which are evidenced by a peak at 33.2° in the GAXRD pattern (Fig. 4), are distributed elsewhere in the coating. Unfortunately, these zones were not detected by these TEM analyses.
In summary, Ti0.35Al0.65N contains bright grains (Fig. 3-B), which are Ti(Al)N and nanolamellae, which are
fcc-Al(Ti)N with a mod- ulation of Al and Ti contents. Some traces of hcp-AlN are detected by XRD.
Fig. 3-C-a shows the BF STEM image of the Ti0.14Al0.86N coating cross section. The coating seems to be constituted of a
stack of particles composed of bright and dark domains. Regarding the square shape of the particle in the upper right frame on Fig. 3-C-a, it can be assumed that these particles can correspond to the cube-shaped grains observed on the surface morphology analyses (Fig. 2-d).
This Ti0.14Al0.86N coating shows a strong compositional modulation of aluminum and titanium (Fig. 3-C-b). EDX
analyses actually revealed the presence of Al-rich and Al-depleted zones, with an Al content of about 85 at.% in the bright domains while a Al content of about 95 at.% was found in the dark zones. This observation is consistent with the high Al overall content in the Ti0.14Al0.86N. The XRD patterns obtained for the Ti0.16Al0.84N and
Ti0.14Al0.86N films (Fig. 4-a) show broad and poorly defined peaks, corresponding mainly to the presence of the hcp-
AlN structure with some traces of the fcc-Al(Ti)N and fcc-Ti(Al)N phases. Evidence of the {200} peaks corresponding to both fcc-Ti(Al)N and fcc-Al(Ti)N phases in the Ti0.14Al0.86N coating is shown in Fig. 4-b. The shift of
the fcc-Ti(Al)N and fcc-Al(Ti)N peaks, compared to the fcc- TiN and fcc-AlN peaks positions (PDF files 00–038-1420 for fcc-TiN and 00–046-1200 for fcc-AlN), can correspond to an Al content x of about 0.08 in the fcc-Ti(Al)N phase and 0.85 in the fcc-Al(Ti)N phase. This last value is consistent with the Al content in the Ti0.14Al0.86N coating. Fig.
5-C-a shows the TEM im5-C-age 5-C-and the 5-C-associ5-C-ated diffr5-C-action p5-C-attern obt5-C-ained on the Ti0.14Al0.86N co5-C-ating. The diffraction pattern shows the presence of the {1010}, {0002}, {1011}, {1012} and {1120} planes of the hcp-AlN phase and the {200} planes of the fcc-Ti(Al)N phase. These observations confirm the XRD results, showing the pre- dominance of the hcp-AlN phase in the Ti0.14Al0.86N coating.
Fig. 5-C-b shows the HRTEM image of a particle that can correspond to a cube-shaped grain (Fig. 2-d) at the surface of the Ti0.14Al0.86N coating (upper left frame). The FFT pattern associated with this HRTEM image reveals the
presence of the {111} and {002} planes of a fcc structure, with a [110] zone axis. Interplanar distances of ≈0.23 nm and ≈0.20 nm were found for the {111} and {200} planes, respec- tively. This particle can be attributed to the fcc-Al(Ti)N metastable phase with a low Ti content.
It could be possible that the higher amount of cube-shaped grains in the Ti0.14Al0.86N compared to the Ti0.16Al0.84N
(Fig. 2-c and -d) is re- lated to the presence of the fcc-Al(Ti)N highlighted by XRD as well as by HRTEM analyses in the highest Al containing coating (x = 0.86).
Coatings deposited by Atmospheric Pressure CVD (APCVD) showing a mixture of fcc-TiN, fcc-AlN and hcp-AlN were also found by Wagner et al. with an Al content of x = 0.40 and x = 0.45 [18]. At higher Al contents, a mixture of the stable phases fcc-TiN and hcp-AlN was found. This result is consistent with those found in our work, except that the hcp-AlN phase seems to be significantly present above an Al content of x = 0.65 in our coatings. These observations clearly confirm that high pressure and/or low carrier gas flow rates promote the growth of the stable phases.
The growth of the lamellae microstructure is assumed to be associated to spinodal decomposition or as the result of kinetic growth, where it should be preferable for the system to stabilize the fcc structure by adjusting the composition of the lamellae [15,16]. However, these hypotheses are not sufficient to explain the micromodulation forming the Al depleted domains (“bright” domains) and Al-rich domains (“dark” domains) in the Ti0.14Al0.86N
substrate surface. If, for example, the reaction of TiCl4 with NH3 is favored compared to that of AlCl3, this can lead to
a local fluctuation of the AlCl3/TiCl4 ratio near the surface and finally leads to the formation of domains showing a
modulation of the Al and Ti contents. This hypothesis can also explain the growth of Al-rich domains in the Ti0.92Al0.08N
coating and the growth of the fcc-Ti(Al)N grains (“bright” grains) in the Ti0.35Al0.65N coating.
In summary, the Ti0.14Al0.86N coating contains bright and dark do- mains, which are a micromodulation of the Al and Ti
contents. This coating is mainly composed of the hcp-AlN phase with some evidences of the fcc-Ti(Al)N and fcc-Al(Ti)N phases. The distribution of these phases is difficult to clarify. Fig. 6 gives a diagram summarizing the structures observed in this work.
Fig. 3. A-a) BF STEM cross section of the Ti0.92Al0.08N coating; A-b) EDX cartography of Al; A-c) EDX cartography
of Ti; B-a) BF STEM cross-section of the Ti0.35Al0.65N coating; B-b) EDX cartography of Al; B-c) EDX cartography of
Ti; C-a) BF STEM cross-section of the Ti0.14Al0.86N coating, the particle in the upper right frame is one of the
Fig. 4. a) GAXRD patterns obtained for the Ti1−xAlxN for x ratios from 0.08 to 0.86; b) GAXRD pattern of the
Ti0.14Al0.86N coating between 40° and 46°; c) GAXRD pattern of the Ti0.16Al0.84N coating between 40° and 46°.
3.3. Thermodynamic calculations
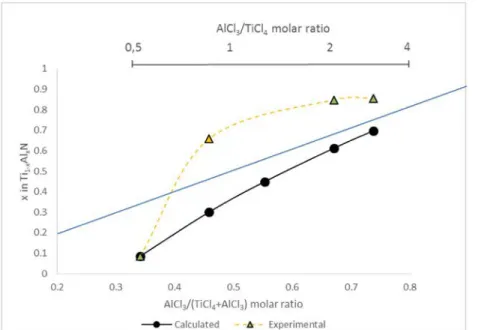
Thermodynamic calculations were performed using the FactSage software to find the stable phases at given parameters (temperature, pressure, molar amount of each reactant in the gas mixture) and to estimate the Al content in the coatings. The phase stability was calcu- lated by minimizing the Gibb's free energy. Calculations were carried out with the same molar quantity as those used during experimental deposition and at 800 °C and 4 kPa. Fig. 7 shows the evolution of the calculated Al content in the coating (x in Ti1−xAlxN) as a function of the
AlCl3/(AlCl3 + TiCl4) ratio. The Ti-Al-N system being immiscible in almost the entire aluminum content range, the
growth of the metastable fcc-Ti1−xAlxN is considered as the result of a kinetic issue more than of a
thermodynamic metastability [5]. It is thus assumed that only the stable fcc-TiN and hcp-AlN phases will be formed experimentally. Data for the different phases is based on the work of Chen and Sundman [20], defining the thermodynamic parameters of the stable phases in the Ti-Al-N system. The calculated Al contents (solid black curve of Fig. 7, Table 2) are compared to the experimental values (dashed orange curve of Fig. 7). The experimental as well as calculated Al contents are found to have the same evolution. The solid blue line (Fig. 7) is the calculated theoretical Al content in the coating in the case of all AlCl3 being used to form AlN.
As the AlCl3/(AlCl3 + TiCl4) ratio increases, the calculated Al con- tent in the coating progressively gets closer to
the theoretical maximum value that can be obtained. Except for the lowest Al content, it is clear that the experimental values are above the other values (Fig. 7).
Yield calculations for the formation of hcp-AlN (not presented here) were carried out in order to explain the calculated curve evolution. Hcp-AlN yield is defined as the ratio of the AlCl3 inlet to the amount of hcp-AlN
formed. Results show that, at an AlCl3/(AlCl3 + TiCl4) flow ratio of 0.34, only 26% of the injected AlCl3 in the
calculations thus explain that calculated Al contents progressively approach the theoretical value given by the blue line.
The experimental Al contents are higher than the calculated values for the coatings with an AlCl3/(AlCl3 + TiCl4)
ratio above 0.46. As we use a relatively low H2 flow rate and considering that the reactivity of TiCl4 with NH3 is
higher than that of AlCl3 (the mixing enthalpy at 800 °C for the formation of fcc-TiN from NH3 and TiCl4 is about
−100 KJ/mol while that of hcp-AlN from AlCl3 and NH3 is about −48 KJ/mol), fcc-TiN may already be formed in the
injection pipe. Then, a lower TiCl4 amount is available for deposition, leading to higher Al contents in the
coatings. This assumption is supported by the observation, after the deposition process, of a yellow layer on the inner wall of the injection pipe.
Concerning the lowest Al-containing coatings (with the corresponding ratio: AlCl3/(AlCl3 + TiCl4) of 0.34), it is
assumed that, even if a small amount of fcc-TiN is already deposited in the injection gas pipe, the gas mixture in the deposition zone will still be mainly com- posed of TiCl4. So, the amount of AlCl3 may be insufficient to react
strongly with NH3. A low Al content is then expected in the coating. This can explain that the experimental value
is almost the same as the calculated one (for low Al contents).
For the Al-rich coating (AlCl3/(AlCl3 + TiCl4) of 0.74), the experi- mental value is closer to the calculated curves. It
can be considered in this case that the amount of TiCl4 in the gas mixture is not sufficient to deposit on the wall
Fig. 5. A-a) BF TEM image of the Ti0.92Al0.08N coating and the corresponding diffraction pattern; A-b) HRTEM
image of the Ti0.92Al0.08N coating associated to its FFT pattern; B-a) BF TEM image of the Ti0.35Al0.65N coating and
the associated diffraction pattern; C-a) BF TEM image of the Ti0.14Al0.86N and the corresponding diffraction
pattern; C-b) HRTEM image corresponding to a cube-shaped grain at the surface of the Ti0.14Al0.86N coating. The
Fig. 6. Diagram of the microstructures obtained in our coatings as a function of the Al content. The Ti0.92Al0.08N
coating is mainly constituted of fcc-Ti(Al)N nanolamellae with a modulation of the Ti content (globular grains). Some traces of the hcp-AlN and fcc-Al(Ti)N phase are also present (dark domains).
The Ti0.35Al0.65N coating is constituted of fcc-Ti (Al)N grains (bright grains) and fcc-Al(Ti)N nanolamellae with a
modulation of the Al content (bright lamellae and dark lamellae). Some traces of hcp-AlN are also detected in the coating.
The Ti0.14Al0.86N coating is constituted of Al- rich and Al-depleted domains. This coating is mainly constituted of the
hcp-AlN phase with some evidences of the fcc-Ti(Al)N and fcc-Al(Ti) N phases. The distribution of theses phases cannot be determined.
Fig. 7. Evolution of the experimental and calculated value of the x ratio in Ti1−xAlxN coatings as a function of
the AlCl3/ (AlCl3 + TiCl4) ratio. The blue line is the calculated Al con- tent in the coating if all AlCl3 is used to
form AlN. (For interpretation of the references to colour in this figure legend, the reader is referred to the web version of this article.)
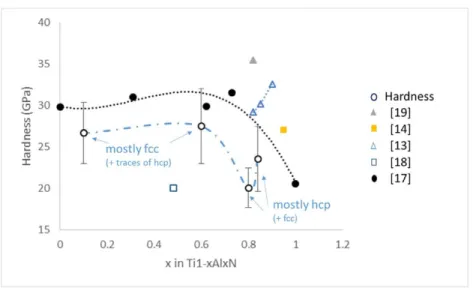
Fig. 8. Hardness evolution as a function of x in Ti1−xAlxN coatings deposited at 800 °C and 4 kPa.
3.3. Hardness
Fig. 8 shows the evolution of the coatings hardness as a function of Al content. Hardness value is 26.6 GPa for the Ti0.92Al0.08N coating and a weak hardness increase is observed for x = 0.65. Above this value, a hardness drop is
observed, with a value of 20.0 GPa for Ti0.16Al0.84N. Finally, hardness seems to increase slightly for Ti0.14Al0.86N.
According to the low Al content in the Ti0.92Al0.08N coating, its hardness (26.6 GPa) seems to be quite high compared
to the typical values reported for fcc-TiN coatings (about 20 GPa) [18,21]. This relatively high value can be attributed to the nanolamellae micro- structure. The coherent lattice along lamellae associated with a slight modulation of composition can generate stresses at the interfaces be- tween these lamellae and then reduce dislocations motion, leading to higher hardness [22]. An increase of the Al content in the fcc-Ti1−xAlxN phase generally leads to an increase
in hardness. Here, the slight rise in hardness between the Ti0.92Al0.08N and the Ti0.35Al0.65N coatings could be related
to the higher amount of Al in the Ti0.35Al0.65N coating. In- deed, no fcc-Ti(Al)N peak shift is detected for Ti0.92Al0.08N,
whereas a shift is observed for Ti0.35Al0.65N. However, this apparent increase in hardness could also be due to the
high deviation of the hardness values. The hardness drop observed by further increasing the Al content in the coatings is related to the predominant formation of hcp-AlN, as shown by the XRD analyses. The increase of hardness observed for the Ti0.14Al0.86N coating could be related to the presence of fcc-Al(Ti)N domains in this coating which is
not observed in Ti0.16Al0.84N. The fcc- Al(Ti)N phase is notably reported to have a high hardness and can thus be
responsible for this increase in hardness. However, this higher hardness for the Ti0.14Al0.86N coating could also be due
to the high deviation of the hardness values.
The hardness measurements of this work are compared with literature data. Ishigaki et al. have recently deposited Ti1−xAlxN coatings with various Al contents [17]. The same hardness evolution (black dotted curve) was observed
for their coatings. Nevertheless, higher hardness values were obtained due to the presence of the fcc-structure in a wider Al content range as well as to the formation of the nanolamellae microstructure up to an Al content of x = 0.82 [17]. In a general way, the nanolamellae microstructures are associated with a significantly higher hardness than that of our coatings, with values of about 35 GPa [19,23]. In our case, the presence of fcc-Ti(Al)N phase with a very low Al content (bright grains) in the Ti0.35Al0.65N can ex- plain the lowest hardness. Most of the other
hardness values found in literature are higher than those found in our work. A value of 35 GPa was found in a Ti0.18Al0.82N coating showing the presence of a fcc-Al (Ti)N nanolamellae microstructure with modulated Al and Ti
contents (grey triangle mark) [19]. Values between 28 GPa and 32 GPa were reported in single phase Ti1−xAlxN
coatings (empty blue triangle marks) [13], and a hardness of about 27 GPa was found in Ti0.05Al0.95N coatings
literature, only coatings deposited at atmospheric pressure (blue empty square mark) were found to have lower hardness, confirming the strong influence of deposition pressure on the properties of the Ti1−xAlxN coatings [18].
3.4. Oxidation resistance
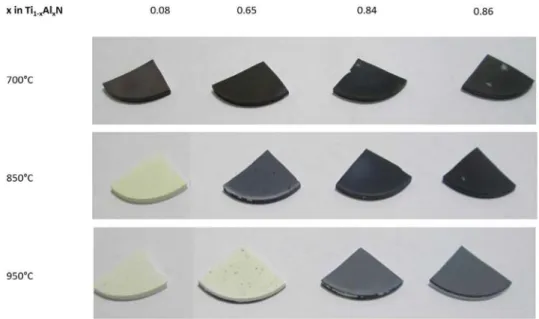
Oxidation resistance was investigated between 500 °C and 1000 °C. Fig. 9 shows an overall view of coated Al2O3
samples after 1 h of oxidation at 700 °C, 850 °C and 950 °C. At a temperature of 700 °C, no sample shows significant oxidation. At 850 °C, the coating with the lowest Al content (Ti0.92Al0.08N) is completely oxidized and
delamination is observed. The coatings with higher Al contents do not show strong oxidation, with only a thin white layer that seems to appear on the Ti0.35Al0.65N. After 1 h of oxidation at 950 °C, the coatings with an Al
content up to x = 0.65 are completely oxidized whereas the two films with higher Al content demonstrate a higher resistance against oxidation.
These observations are confirmed by the XRD patterns (Fig. 10) after 1 h of oxidation at 850 °C. The XRD pattern of Ti0.92Al0.08N shows intense peaks corresponding to the iron oxide Fe2O3. The XRD pattern also reveals that the
oxidized layer is mainly rutile titanium oxide (r- TiO2). Weak reflections corresponding to Al2O3 are also detected.
Additional GAXRD experiments (not presented here) were performed on this coating revealing that the first signs of r-TiO2 occurs from 500 °C. Complete oxidation of the coating was observed after oxidation at 800 °C. Ti0.35Al0.65N
shows better oxidation resistance, as the fcc-Ti(Al) N peaks at 36.6° and 42.6° are still present. Anyway, Al2O3 and
r-TiO2 reflections remain the predominant phases. After 1 h at 800 °C, coatings with the highest Al contents
(Ti0.16Al0.84N and Ti0.14Al0.86N) mainly show the hcp-AlN phase with some Al2O3 reflections. GAXRD analyses performed
between 750 °C and 950 °C (not presented here) show that oxidation seems to start from 800 °C for these coatings. After oxidation at 950 °C, the presence of the hcp-AlN phase is still detected and the coatings are not completely oxidized. Thus, these high Al content coatings show a higher oxidation resistance than coatings with a low Al content, in accordance with the results found in literature [9].
The better oxidation resistance of Al-rich Ti1−xAlxN coatings is generally associated with the formation of Al2O3 as a
dense and diffusion barrier layer that prevents the coating from further oxidation. Vaz et al. conducted a complete study of the oxidation of Ti1−xAlxN coatings with various Al contents, from x = 0.38 to x = 0.81 [24]. They found, by mean of
Rutherford Backscattering Spectrocopy (RBS) ana- lysis, that coatings with low Al contents were mainly composed of r- TiO2 and Al2O3 oxides after oxidation at temperatures above 750 °C. These results are consistent with our observations of Ti0.92Al0.08N. As our coating is mainly composed of titanium nitride, we obviously found almost only r-TiO2 in the Ti0.92Al0.08N after 1 h of oxidation at 850 °C. The presence of this phase from 500 °C and the complete oxidation of the coating after annealing at 800 °C are consistent with the results obtained for fcc-TiN coatings [25]. The low Al content in our Ti0.92Al0.08N seems to be insufficient to significantly increase the oxi- dation resistance compared to fcc-TiN. Rutile-TiO2 is known as a non- protective and porous oxide. The growth of this oxide can cause the appearance of cracks, due to the difference in molar volume between r- TiO2 and fcc-TiN [9,24]. These cracks act as preferential pathways for oxygen diffusion and then lead to a rapid oxidation of the coating. The presence of such mixed oxides as Al2TiO5, found in our Ti0.92Al0.08N film, has also been reported by Chen et al. after oxidation of Ti1−xAlxN coatings at 1450 °C [9]. RBS analysis led by Hugon et al. on Ti1−xAlxN coatings up to x = 0.4 also confirms that mixed aluminum-titanium oxide can be formed during Rapid Thermal Annealing in oxygen at 7509°C [26]. The growth of Al2O3 layer can prevent oxygen diffusion, and thus explains that coating material diffraction peaks are still pre- sent for x = 0.65 to x = 0.86 after annealing at 850 °C during 1 h. The diffusion barrier character of the Al2O3 layer is notably demonstrated by the presence of the fcc-TiN peaks in the Ti0.35Al0.65N coating, while coating with higher titanium content is completely oxidized under the same conditions.
Fig. 9. Optical images of the Ti1−xAlxN coatings deposited on Al2O3 substrates after oxidation during 1 h in
air between 700 °C and 950 °C.
Fig. 10. XRD patterns obtained on Ti1−xAlxN coatings from x = 0.08 to x = 0.86, deposited on M2 tool steel,
after oxidation during 1 h at 850 °C. Conclusion
Ti1−xAlxN coatings with various Al contents were deposited by LPCVD at relatively high pressure (4 kPa) and low H2
flow in order to investigate the evolution of the morphology, microstructure, hardness and oxidation resistance. Concerning the chemical composition, it was found that the evolution of Al content of the films is consistent with thermodynamic calculations, although the experimental Al contents are higher than the calculated values. This difference is attributed to the fcc-TiN deposition prior the deposition zone, leading to a higher AlCl3/TiCl4 ratio near
A change in morphology was observed by increasing the Al content, from globular grains to cube-shaped grains. A modulation of Al and Ti contents is found in all coatings. In the Ti0.92Al0.08N and Ti0.35Al0.65N, this modulation occurs
mainly by forming fcc-nanolamellar grains. The formation of these lamellae even in the coating having the lowest Al content is attributed to the deposition conditions (relatively high working pressure, low carrier gas flow), which are closer to the thermodynamic equilibrium than the deposition conditions described in literature. The coatings with the highest Al contents seem to be mainly composed of the hcp-AlN phase and show a micromodulation of Al and Ti contents, forming Al-rich and Al-depleted domains. The formation of these domains can result from a competitive consumption of AlCl3 and TiCl4 near the substrate surface, leading to a local variation of the AlCl3/TiCl4 ratio.
An increase of the Al content in the coatings allow the formation of a dense and protective Al2O3 layer, leading to
higher oxidation resistance up to 950 °C in the films having the highest Al contents. Higher hardness (up to 27 GPa in the coating with an Al content x = 0.65) is obtained for coatings showing the nanolamellar grains. This relatively low value compared to those found in literature is associated to the growth of fcc-Ti(Al)N grains with a very low Al content in the Ti0.35Al0.65N coating. A drop in hardness (down to 20 GPa) is observed for the coatings
with the highest Al content, for which the hcp-AlN is predominant. The hardness values are lower than those measured in literature (up to ≈35 GPa). These coatings are generally elaborated at lower pressure and/or higher carrier gas flow than our coatings, al- lowing the formation of grains only composed of fcc-Al(Ti)N nanolamellae with modulated Al and Ti contents.
Acknowledgement
The authors would like to acknowledge the CEA Saclay, Direction du Programme Matériaux Avancés and the Groupement d'Intérêt Public Haute-Marne (GIP 52) for their financial support.
References
[1] V. Tomashik, P. Perrot, Aluminium–Nitrogen–Titanium, Landolt-Bornstein, 2005.
[2] J. Zhou, et al., Phase equilibria, thermodynamics and microstructure simulation of metastable spinodal decomposition in c– Ti1−xAlxN coatings, Calphad 56 (2017) 92–101, https://doi.org/10.1016/j.calphad.2016.12.006.
[3] N. Shulumba, et al., Anharmonicity Changes the solid Solubility of a Random Alloy at High Temperatures, ArXiv Prepr (2015). [4] Transition metal mono nitrides, carbides, oxides, J. Chim. Phys. 90 (1993) 209–219.
[5] S. Anderbouhr, Depot Chimique en Phase Vapeur de Couches Minces de (Ti,Al)N à Composition Variable, Doctoral Thesis Institu National Polytechnique de Grenoble, 1999.
[6] R.F. Zhang, S. Veprek, Metastable phases and spinodal decomposition in Ti1−xAlxN system studied by ab initio and thermodynamic modeling, a compar- ison with the TiN–Si3N4 system, Mater. Sci. Eng. A 448 (2007) 111–119, https:// doi.org/10.1016/j.msea.2006.10.012.
[7] P.H. Mayrhofer, et al., Self-organized nanostructures in the Ti–Al–N system, Appl. Phys. Lett. 83 (2003) 2049, https://doi.org/10.1063/1.1608464.
[8] O. Kyrylov, R. Cremer, D. Neuschütz, R. Prange, Correlation between plasma con- ditions and properties of (Ti, Al) N coatings deposited by PECVD, Surf. Coat. Technol. 151 (2002) 359–364, https://doi.org/10.1016/S0257-8972(01)01653-X.
[9] L. Chen, J. Paulitsch, Y. Du, P.H. Mayrhofer, Thermal stability and oxidation re- sistance of Ti–Al–N coatings, Surf. Coat. Technol. 206 (2012) 2954–2960, https:// doi.org/10.1016/j.surfcoat.2011.12.028.
[10] T. Shimizu, H. Komiya, Y. Teranishi, K. Morikawa, H. Nagasaka, M. Yang, Pressure dependence of (Ti, Al)N film growth on inner walls of small holes in high-power impulse magnetron sputtering, Thin Solid Films 624 (2017) 189–196, https://doi.
org/10.1016/j.tsf.2016.09.041.
[11] B. Grossmann, N. Schalk, C. Czettl, M. Pohler, C. Miterrer, Phase composition and thermal stability of arc evaporated Ti1 − xAlxN, Surf. Coat. Technol. 309 (2017) 687–693, https://doi.org/10.1016/j.surfcoat.2016.11.015.
[12] P.H. Mayrhofer, D. Music, J.M. Schneider, Influence of the Al distribution on the structure, elastic properties, and phase stability of supersaturated Ti[sub 1−x]Al [sub x]N, J. Appl. Phys. 100 (2006) 094906, , https://doi.org/10.1063/1.2360778. [13] I. Endler, et al., Novel aluminum-rich Ti1−xAlxN coatings by LPCVD, Surf. Coat. Technol. 203 (2008) 530–533,
https://doi.org/10.1016/j.surfcoat.2008.04.098.
[14] J. Keckes, et al., Self-organized periodic soft-hard nanolamellae in polycrystalline TiAlN thin films, Thin Solid Films 545 (2013) 29–32, https://doi.org/10.1016/j.tsf. 2013.08.001.
[15] J. Zalesak, et al., Peculiarity of self-assembled cubic nanolamellae in the TiN/AlN system: epitaxial self-stabilization by element deficiency/excess, Acta Mater. 131 (2017) 391–399, https://doi.org/10.1016/j.actamat.2017.04.009.
[16] A. Paseuth, H. Fukui, K. Yamagata, Improvement of mechanical properties and cutting performance of modified MT-TiCxN1−x coating by moderate temperature chemical vapor deposition, Surf. Coat. Technol. 291 (2016) 54–61, https://doi.org/
10.1016/j.surfcoat.2016.02.023.
[17] T. Ishigaki, S. Tatsuoka, K. Sato, K. Yanagisawa, K. Yamaguchi, S. Nishida, Influence of the Al content on mechanical properties of CVD aluminum titanium nitride coatings, Int. J. Refract. Met. Hard Mater. 71 (2018) 227–231, https://doi.org/10.
1016/j.ijrmhm.2017.11.02810.1016/j.ijrmhm.2017.11.028.
[18] J. Wagner, V. Edlmayr, M. Penoy, C. Michotte, C. Mitterer, M. Kathrein, Deposition of Ti–Al–N coatings by thermal CVD, Int. J. Refract. Met. Hard Mater. 26 (2008) 563–568, https://doi.org/10.1016/j.ijrmhm.2008.01.003.
[19] J. Todt, et al., Al-rich cubic Al0.8Ti0.2N coating with self-organized nano-lamellar microstructure: thermal and mechanical properties, Surf. Coat. Technol. 291 (2016) 89–93, https://doi.org/10.1016/j.surfcoat.2016.02.027.
[20] Q. Chen, B. Sundman, Thermodynamic assessment of the Ti-Al-N system, J. Phase Equilib. 19 (1998) 146–160, https://doi.org/10.1361/105497198770342616.
[21] D.T. Quinto, G.J. Wolfe, P.C. Jindal, High temperature microhardness of hard coatings produced by physical and chemical vapor deposition, Thin Solid Films 153 (1987) 19–36, https://doi.org/10.1016/0040-6090(87)90166-0.
[22] F. Sanchette, C. Ducros, T. Schmitt, P. Steyer, A. Billard, Nanostructured hard coatings deposited by cathodic arc deposition: from concepts to applications, Surf. Coat. Technol. 205 (2011) 5444–5453, https://doi.org/10.1016/j.surfcoat.2011. 06.015.
[23] A. Paseuth, K. Yamagata, A. Miura, M. Higuchi, K. Tadanaga, Deposition and analysis of Al-rich c-Al x Ti 1−x N coating with preferred orientation, J. Am. Ceram. Soc. 100 (2017) 343–353, https://doi.org/10.1016/10.1111/jace.14549.
[24] F. Vaz, L. Rebouta, M. Andritscky, M.F. da Silva, J.C. Soares, Thermal oxidation of TiAlN coatings in air, J. Eur. Ceram. Soc. 17 (1997) 1971–1977, https://doi.org/10. 1016/S0955-2219(97)00050-2.
[25] H.-Y. Chen, F.-H. Lu, Oxidation behavior of titanium nitride films, J. Vac. Sci. Technol. 23 (2005) 1006–1009, https://doi.org/10.1116/1.1914815.
[26] M.C. Hugon, J.M. Desvignes, B. Agius, I.C. Vickridge, D.J. Kim, A.I. Kingon, Narrow resonance profiling study of the oxidation of reactively sputtered TiAlN thin films, Nucl. Instrum. Methods Phys. Res., Sect. B 161-163 (2000) 578–583, https://doi. org/10.1016/S0168-583X(99)00953-2.


![[PDF] Apprendre Arduino livre en PDF pour débutant | Cours Arduino](data:image/gif;base64,R0lGODlhAQABAIAAAP///wAAACH5BAEAAAAALAAAAAABAAEAAAICRAEAOw==)