HAL Id: hal-02177784
https://hal.inria.fr/hal-02177784
Submitted on 9 Jul 2019
HAL is a multi-disciplinary open access
archive for the deposit and dissemination of
sci-entific research documents, whether they are
pub-lished or not. The documents may come from
teaching and research institutions in France or
abroad, or from public or private research centers.
L’archive ouverte pluridisciplinaire HAL, est
destinée au dépôt et à la diffusion de documents
scientifiques de niveau recherche, publiés ou non,
émanant des établissements d’enseignement et de
recherche français ou étrangers, des laboratoires
publics ou privés.
Multilayered Analysis of Newspaper Structure and
Design
Hui-Yin Wu, Pierre Kornprobst
To cite this version:
Hui-Yin Wu, Pierre Kornprobst. Multilayered Analysis of Newspaper Structure and Design. [Research
Report] RR-9281, UCA, Inria. 2019. �hal-02177784�
ISSN 0249-6399 ISRN INRIA/RR--9281--FR+ENG
RESEARCH
REPORT
N° 9281
July 2019 Project-Team BiovisionMultilayered Analysis of
Newspaper Structure and
Design
RESEARCH CENTRE
SOPHIA ANTIPOLIS – MÉDITERRANÉE 2004 route des Lucioles - BP 93 06902 Sophia Antipolis Cedex
Multilayered Analysis of Newspaper Structure
and Design
Hui-Yin Wu, Pierre Kornprobst
Project-Team Biovision
Research Report n° 9281 — July 2019 — 12 pages
Abstract: Understanding newspaper structure and design remains a challenging task due to the complex composition of pages with many visual and textual elements. Current approaches have focused on simple design types and analysed only broad classes for the components in a page. In this paper, we propose an approach to obtain a comprehensive understanding of a newspaper page through a multi-layered analysis of structure and design. Taking images of newspaper front pages as input, our approach uses a combination of computer vision techniques to segment newspapers with complex layouts into meaningful blocks of varying degrees of granularity, and convolutional neural network (CNN) to classify each block. The final output presents a visualization of the various layers of design elements present in the newspaper. Compared to previous approaches, our method introduces a much larger set of design-related labels (23 labels against less than 10 before) resulting in a very fine description of the pages, with high accuracy (83%). As a whole, this automated analysis would have potential applications such as cross-medium content adaptation, digital archiving, and UX design.
Analyse multicouche de la structure et de la forme des
journaux
Résumé : La composition des pages d’un journal est complexe, comprenant de nombreux éléments visuels et textuels. Cela rend difficile l’analyse de la structure et de la forme de ces pages. Les approches actuelles se sont focalisées sur des documents simples et ont analysé uniquement les classes de base des composants d’une page. Dans ce rapport, nous proposons une approche permettant d’obtenir une compréhension complète d’une page de journal grâce à une analyse multicouche de la structure et de la forme. Notre système prend les images de pages de journaux en entrée et comprend deux parties. La première utilise des techniques de vision par ordinateur pour segmenter des page complexes en blocs significatifs de différents degrés de granularité. La deuxième classe chaque bloc identifié avec un réseau de neurones à convolution (CNN). Le résultat finale est une visualisation des différentes couches des composants d’une page. En comparaison des approaches précédentes, notre méthode introduit un ensemble beaucoup plus large de classes (23 classes de composants d’une page par rapport à moins de 10 auparavant), donnant une description très fine des pages, avec une bonne précision (83 %). Cette méthode a des applications potentielles telles que l’adaptation de contenu multi-média, l’archivage numérique et la conception UX.
Multilayered Analysis of Newspaper Structure and Design 3
1
Introduction
In printed newspapers, grids, colors, and other visual elements are adopted by designers to create a continuous reading flow for readers to pursue, which goes from high level aspects such as spacial placement of content to create a compact presentation, to fine-grained details such as font-size, paragraph length, and placement of various text segments such as cross-res, quotes and toplines to attract attention and enhance the reading experience. This richness of information is a strong challenge for automatic approaches aiming at analysing complex documents, which is at the core of this work.
Related work: Complex document analysis is a problem defined as the automatic segmen-tation of documents with mixed/text content of varying quality and classification of segmented areas.
Current methods proposed are still dominantly multi-step rule-based systems which rely strongly on manually set parameters and heuristics applied as filters to the document image. Many examples of such methods were proposed and benchmarked in the biannual conference IC-DAR (International Conference on Document Analysis and Recognition) which regularly holds a competition for recognition of complex document layout (RDCL) since 2001 [1]. The compe-tition mainly involves three categories of tasks: segmentation (of the document), classification (of segmented blocks into a number of categories such as text, image, table, etc.), and OCR (optical character recognition). A basic approach to segmenting documents using straight line detection [2], which was proposed in the most recent RDCL competition, outlines this process clearly, involving pre-processing of the input image (e.g. binarization), classification of text vs non-text elements (e.g. connected component analysis), and grouping of pixels into meaningful segments. Two other approaches, Multilevel Homogeniety Structure (MHS) [3] and Adaptive Over-Split and Merge (AOSM) [4], which were first and third place respectively, also feature similar workflows. The former proposes filtering layers for text and image classification, while the latter proposes an initial over-segmentation of the document before re-grouping and then classification.
Another notable work on the side of segmentation was done by Mitchell and Yan [5] who proposed an over-segmentation of newspapers before merging segments into seven distinct cat-egories. Criterion for merging is based on a number of rules defined in the paper based on the black-white ratio, area, and shape of regions. The classification categories are mainly comprised of text elements (text, inverted text, and title), design elements (boxes, lines, etc.), and images (photos and graphic/drawings). The work establishes a basis for future work on complex docu-ment analysis. Considering classification, we would like to docu-mention the work done by Wang et al. [6] using a decision tree to classify document segments into nine categories. Initially, each segment is statistically represented as feature vectors that serve as input to the decision tree classifier. The input document is more academical documents rather than print media content, and is pre-segmented. It is also worth mentioning the Google Newspaper Search program [7] who introduced an image processing pipeline for digitizing and indexing old newspapers to bring them online. As such, most efforts were spent on the text elements to detect and recognize headings and articles’ content.
With the emergence of machine learning, some papers have proposed convolutional neural networks for the simpler segmentation and classification tasks. For example, Xu et al. [8] use con-volutional neural networks coupled with post-processing noise removal in order to classify text pixels in historical documents. The approach takes as input images of historical handwritten documents, and classifies pixels as belonging either to the main text, comments, or background. Meier et al. [9] present a simple solution to newspaper segmentation using convolutional neu-ral networks which does not integrate any complex models. The method is efficient, but only RR n° 9281
4 Wu & Kornprobst segments the newspaper into larger article regions, with no additional labels for subcategories such as images, headings, captions, and paragraphs. It also seems that the approach excludes layouts with non-rectangular regions, and it is unclear if the segmentation also processes com-plex elements such as inverted texts on images. However, there are no existing fully-automated approaches that do not need to be tuned or adapted based on document language or type, and no fully machine learning solution has been proposed.
Contributions: Current approaches suffer from two main limitations: for the segmentation part, the variety of newspaper designs would pose a challenge to rule-based systems, which must be frequently adapted to treat different layouts, thus resulting in lower adaptability. For the classification part, existing systems also have fewer and more generic labels, without taking into account that documents have multi-layered designs going from high level structural aspects (e.g. columns, textboxes, masthead) to detailed content categories (e.g. various image and text sub-types such as headings and captions). In this paper, we address these two challenges by proposing a new segmentation approach to deal with complex layouts and a neural network based classification to obtain a multilayered analysis of newspaper structure and design.
Outline: The rest of this paper is organized as follows. Section 2 gives an overview of newspaper design and our system workflow, and technical details are given in Section 3. Then in Section 4 we provide both quantitative and qualitative results: We quantitatively evaluate the classification performance of the proposed method on our dataset and then illustrate structure and design elements that can be extracted from our analysis. Finally, we offer a conclusion with the limitations, future directions, and potential applications of this work.
2
Overview
Here we provide an overview of newspaper design and of our system workflow to tackle the problem of segmenting, classifying, and analysing newspaper design elements.
2.1
Newspaper design
The goal of this work is to address segmentation of news publications. Newspapers have very specific terminology when it comes to describing layout and content design, which can be derived from references such as [10]. Fig. 1 shows how this set of design vocabulary would be used on an imaginary newspaper front page.
Any region of the newspaper can have multiple associated labels. For example, a skybox can also hold an image/photo, ad, and/or cross-reference to another article. Plus, it belongs to the masthead region. This complex aspect of overlapping design is what elevates the challenge in segmenting and classifying newspaper elements.
2.2
System Workflow
Our system is made up of three stages (see Fig. 2):
• Segmentation: takes as input an image file, and outputs a segmented newspaper with both high-level (i.e., regions detected from curvilinear delimiters) and low-level elements (individual text blocks).
• Classification: comprised of a convolutional neural network connected to a tabular neural network. The neural networks take as input each segmented block from the previous section as a resized image, with relative coordinates, width, and height of the segment. The output is a multi-label classification on each input segment for 23 design-related labels.
Multilayered Analysis of Newspaper Structure and Design 5
Figure 1: A newspaper page can hold more than 10 different design elements that overlap each other. Here we depict most of the 23 labels we are working with in our dataset, derived from [10]. More details on the label categories are described in Section 3.2.
• Analysis: The segmentation and classification outputs are used to present a multi-layered visualization of newspaper design, encompassing high-level elements such as the design grid, medium-sized elements such as articles and text regions, down to the arrangement of various text fragments within articles.
The next section discusses these steps in detail.
3
Technical Details
In this section, we describe the technical details in our system in segmenting the newspaper pages and classifying segmented regions with structural and design related labels.
3.1
Multilayered segmentation
Since our goal is to have a multilayered segmentation of a newspaper–with segments both rep-resenting structural elements such as the masthead, article regions, and text boxes, and fine-grained elements such as the nameplate, paragraph/column blocks, images, captions, and cross-references–our segmentation is conducted in two stages: segmenting of structural regions through curvilinear structure detection (generally used as separators between articles), and segmenting of fine-grained elements through straight line analysis and OCR.
6 Wu & Kornprobst
Newspaper page Multilayered segmentation
Curvilinear structure segmentation (Frangi vesselness detector)
Region segmentation (smart colouring filter) Over-segmentation in each
region and grouping (OCR) Segments Classification Blocks labels Analysis (a) (b) Lines of forces Multi column grid Margin Gutter Baseline grid Restnet50 (CNN) + tabular (training set acquired with dedicated annotation tools)
Extraction of multi-column grids, baseline grid, gutters, … Step 1 Step 2
Figure 2: System overview showing the three components of the approach: Multilayered segmen-tation, classification and analysis.
3.1.1 Step 1: Structural segmentation into regions using curvilinear separators This first step exploits what is used in many newspaper to separate different articles: curvilinear separators. These separators are generally horizontal or vertical but can also be curved as shown in the example given in Fig. 3.
To find regions, we first apply Frangi vesselness filter [11] to enhance curvilinear structures. These structures are then thresholded by length, resulting in just the line delimiters used in newspaper design to separate newspaper regions such as individual articles (Fig. 3(b)).
to identify structural regions from this set of curvilinear separators, an efficient solution consists in applying a smart coloring filter [12], originally defined in the context of flat coloring of line-arts (using implementation from the G’MIC for Gimp plugin). Example is shown in Fig. 3(c). To do so, one simply needs to define some initial color stripes that will be used in the coloring process. This is done by first estimating a distance function (to the curvilinear separators), then detecting the ridges of this function (local maxima) and finally applying a random color stripe for each ridge thus defining a colormap of regions.
An example of this structural segmentation is shown in Fig. 3(d). It has two main benefits. Firstly, it allows a high-level view of the document structure and filtering out visual details within each region that have less to do with the overall structural organisation of the document. Secondly, it allows the detection of regions that are non-rectangular, separated with curved or other complex delimiters.
3.1.2 Step 2: Segmentation of text elements and image blocks
A straight-line segmentation approach, inspired by [2] is then conducted on each detected region found in Step 1. Interestingly, thanks to Step 1, one can overcome the main limitations of current approaches like [2] which are constrained due to their heuristics to simple designs where regions are well aligned and have only vertical and horizontal separators. Note that in the absence of curvilinear separators similar techniques can be developed do detect and exploit gutters.
Multilayered Analysis of Newspaper Structure and Design 7
(a) (b) (c) (d)
Figure 3: Illustration of the segmentation into relevant regions: (a) Original image by Newseum and DeMorgen, used under terms of fair-use; (b) Curvilinear structures detected using Frangi vesselness filter [11]; (c) Main regions found using coloring filter [12]; (d) Resulting blocks pulled apart for a better visualization. Image courtesy of Newseum and DeMorgan, under terms of fair use.
This second step is comprised of three stages. First, we use the OCR engine Tesseract to extract character positions for each region detected in the first part of the segmentation. Next, each region is recursively cut in two by the largest detected horizontal or vertical whitespace. The segmentation stops either when no more contiguous whitespace is detected, or when two conditions are fulfilled: (1) all the detected characters in the region are of homogeneous font size, and (2) there exist no gaps of character distribution (both horizontally and vertically) in a segmented block. Finally, we create a distance graph of all detected segments, and merge small segments together by proximity.
3.2
Classification
As shown in Fig. 1, the design of modern newspapers has its own set of vocabulary to describe visual elements present in a page. References such as [10] have provided a detailed list of visual elements that allow us to describe the design of a page in terms of layout, spacing, and typography. Compared to previous approaches which are very limited in terms of classes (generally less than 10 classes considered), our classification introduces 23 categories of labels (most of relevant labels defined in [10]), with multiple labels possible for each segment. These labels include ones that denote overall structural regions of the document (e.g., article, masthead, textbox, ad), structural elements of each region (e.g. image, column, paragraph, image, skybox), and finally various specific text (e.g., caption, cross-ref, pullquote, inverted text, running head, headline, subhead, topline) and image categories (photo, infograph, nameplate, and other graphics types). An additional category, fragment, has been added to categorize mis-segmented elements from the previous step that contain an incomplete part of a category.
3.2.1 Convolutional neural network
We conduct transfer learning on the Resnet50 convolutional neural network using the fastai library which is based on PyTorch. Our system runs on a P4000 NVIDIA GPU, with a training set of 1600 annotated segments from 43 newspaper pages.
8 Wu & Kornprobst Each segment is cropped from its corresponding region, and resized to 128x128. The problem falls into the category of a multi-label classification problem where one or more of the 23 labels can be assigned to each image segment. For this we use a cross-entropy loss function. The output of the neural network is the likelihood of each label being applied to a segment, which we filter with an accuracy threshold metric of 0.6.
We conduct 4 one-cycle-learning, with the first and last cycle only on the last layers of the neural network, and the middle two cycles on all layers with adjusted learning rates. The training indicates an accuracy of 97% on the training and validation data. Total training time is close to 2 minutes.
3.2.2 Position and size information
The CNN is strong in categorizing elements based on their visual properties, especially in dif-ferentiating text from image elements, and between various types of images. However, since all segments are resized to 128x128 blocks, size and positional properties of these segments are lost. The alternative solution of padding each segment with additional whitespace in order to incorporate positional information for the CNN would sacrifice prominent visual features when the segments are resized.
Thus to address this challenge, the CNN is connected to a 100 layer by 100 neuron fully-connected neural network which takes as input the output of the CNN probabilities for each class and position and size data of the segment. The position and size are represented as the relative (x, y) coordinate of the top left corner of the page, and the relative width and height with regards to each page image. Thus the values are normalized and fall between 0.0 and 1.0. An F1 Score and accuracy threshold are use as loss function and metrics. We train on two cycles. Accuracy on the training and validation set achieves 99.1% at the end of training, with training time being less than 10 seconds.
4
Results
We present the results of our system from two aspects: a quantitative analysis of the overall accuracy of classification, and a qualitative visualization of the segmented and labelled newspa-pers.
4.1
Classification Accuracy
Our dataset is comprised of front pages with 5 different publishers, collected from the Newseum website [13] under terms of fair use, including, e.g., the New York Times (with strict design rules) and Belgium DeMorgan (with more complex layout mixing text and images). A total of 82 pages from February to April 2019 were segmented, with an output of around 6000 segments. From this, we selected randomly a subset of 43 pages, containing 1600 segments that were then expertly annotated to form the training set. To assist in this stage, an annotation tool was designed with shortcuts to visualize, navigate, and apply labels to each segment. This set of annotated newspapers were then used to train our classification neural networks.
This section presents results of our pipeline in terms of accuracy of the overall classification of segments and regions.
Since no existing dataset contains this large amount of classes, we evaluate the accuracy on our own test dataset comprised of 12 new pages from different editions of the newspapers selected for our training dataset, with 452 annotated segments in the test set. For each category, the Inria
Multilayered Analysis of Newspaper Structure and Design 9
accuracy is estimated based on standard formula
Acc = correctly_labelled
total_correct_labels + mis-classified_labels.
The average accuracy of the CNN is 70% on the test data with only the image of each segment as input and no additional positional and size data. When adding the tabular network with the position and size data to the pipeline, the accuracy of classified labels is raised to 83%.
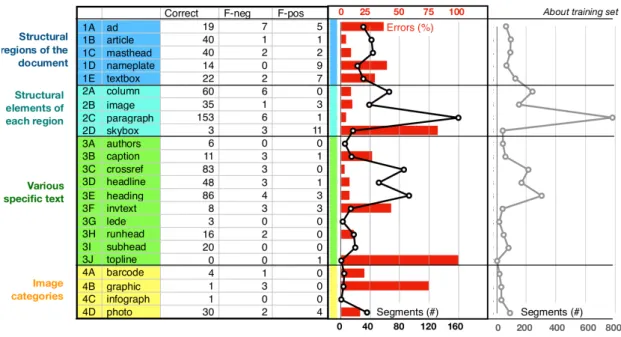
In Fig. 4 we provide an analysis by category of labels. On the right-hand side of the table, a red bar chart shows the error (1 − Acc) together with the number of segments (black line) in the test set used to estimate the error. This shows a low error made for the paragraphs which are also highly represented. The gray curve then indicates the number of segments with each category label in the training dataset. We can observe that strong errors (>50%) occur for a few categories: skyboxes, topline and graphics. However, these error rates are due to very low occurrences of these elements in newspaper documents, and subsequently the test dataset. These error rates would not be representative of the overall accuracy of the prediction. For most segments with more than 40 samples, low errors are observed. Note that the numbers of segments used in the test set are in the same proportions as in the training set. This would suggest a strategy to enrich the training set with segments containing labels with low representation to improve the overall accuracy of the approach.
Figure 4: Classification result per categories. Results are presented in the table, showing the number of segments that are correctly classified, negative (i.e. missing label), and false-positive (i.e. wrongly assigned label). Then a red chart shows the errors together with the number of segments (black line) used for the test dataset. To the right, the grey curve indicates the number of segments which were available in the training set.
10 Wu & Kornprobst
4.2
Multilayered Analysis of Newspaper Structure and Design
Here we provide a qualitative view of design elements in newspapers through visualization of various segmented layers and extracted design principles.
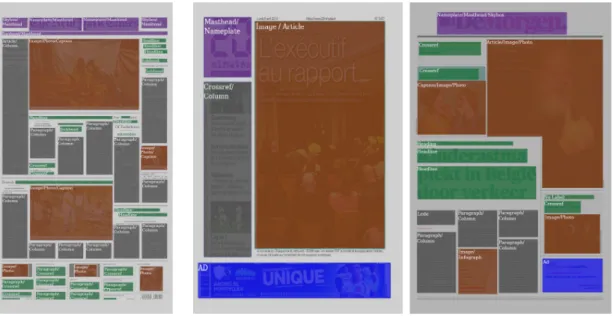
As described in previous sections, the labels used in our classification have varying structural and content roles. Once a newspaper is segmented, and each segment is labelled by our classifi-cation, we generate a visualization overlay of each of the detected segments with different colors representing different categories, as shown in Fig. 5. This overlay is multi-layered in the sense that it takes into account both the speicific text/image category of each segment, as well as the structural region the segment belongs to. Moreover, design principles such as the design grid (made up of borders, columns, and gutters) are easily visible, which aids the understanding of the aesthetic layout of the newspaper. Despite some errors in the classification (e.g. ’skybox’ instead of ’barcode’ in the right-most DeMorgan newspaper), the understanding of the overall structure of the newspaper is not affected.
Figure 5: Visualization of the classification results on three different newspapers in our test set. Colors indicate primary categories as masthead elements (purple), text column (gray), ads (blue), images (brown) and minor text elements (green). Original images copyright of (from left to right) New York Times, 20 Minutes, and DeMorgan, courtesy of Newseum.
5
Conclusion
This work explores a new pipeline that combines traditional computer vision tools as well as neural networks to perform segmentation and classification of newspaper design elements. The novelty of this work lies in (1) the segmentation of extremely complex documents such as news-paper front pages that can have a mix of multiple text and image categories on a single page, (2) the analysis and visualization of style based on known design principles, and (3) the broad appli-cation to various design styles of different newspapers without changing any specific parameters to the approach.
Multilayered Analysis of Newspaper Structure and Design 11
One limiting factor to this work is the precision of the segmentation. Compared to existing approaches which have much more detailed heuristics at the segmentation phase, and allow output segments of varying shapes, our results show mostly rectangular blocks, with only the first step of segmentation using 1D structures to identify non-rectangular region delimiters. Also with so many labels, preparing the training set for the classification stage takes an enormous amount of time in manually annotating each segment, and across a large selection of newspapers to achieve higher adaptability of the system. These are directions we would like to address in future work to improve our overall accuracy and make our approach more general for other complex document types.
As a whole, this automated analysis would have potential applications. For example, in UX design, the segmentation and identification of structural, content, and design elements in such complex documents as newspapers would help us make automated systems that can adapt content to various media, preserving the overall style and feeling of the document, while taking into account user comfort for a specific medium.
Contents
1 Introduction 3 2 Overview 4 2.1 Newspaper design . . . 4 2.2 System Workflow . . . 4 3 Technical Details 5 3.1 Multilayered segmentation . . . 53.1.1 Step 1: Structural segmentation into regions using curvilinear separators . 6 3.1.2 Step 2: Segmentation of text elements and image blocks . . . 6
3.2 Classification . . . 7
3.2.1 Convolutional neural network . . . 7
3.2.2 Position and size information . . . 8
4 Results 8 4.1 Classification Accuracy . . . 8
4.2 Multilayered Analysis of Newspaper Structure and Design . . . 10
5 Conclusion 10
References
[1] C. Clausner, A. Antonacopoulos, and S. Pletschacher, “Icdar2017competition on recognition of documents with complex layouts–rdcl2017,” in Proceedings of the 14th IAPR International Conference on Document Analysis and Recognition, 2017.
[2] H. Alhéritière, F. Cloppet, C. Kurtz, J.-M. Ogier, and N. Vincent, “A document straight line based segmentation for complex layout extraction,” in Proceedings of the 14th IAPR International Conference on Document Analysis and Recognition, 2017.
[3] T. A. Tran, K. oh, I.-S. Na, G.-S. L. Lee, H.-J. Yang, and S.-H. Kim, “A robust system for document layout analysis using multilevel homogeneity structure,” in Expert Systems with Applications, 2016.
12 Wu & Kornprobst [4] D.-T. Ha, D.-D. Nguyen, and D.-H. Le, “An adaptive over-split and merge algorithm for
page segmentation,” in Pattern Recognition Letters, 2016.
[5] P. E. Mitchell and H. Yan, “Newspaper document analysis featuring connected line segmen-tation,” in Pan-Sydney Area Workshop on Visual Information Processing, 2002.
[6] Y. Wang, I. T. Phillips, and R. M. Haralick, “Document zone content classification and its performance evaluation,” in Pattern Recognition, vol. 39, pp. 57–73, 2006.
[7] K. Chaudhury, A. Jain, S. Thirthala, V. Sahasranaman, S. Saxena, and S. Mahalingam, “Google newspaper search - image processing and analysis pipeline,” in 10th International Conference on Document Analysis and Recognition, ICDAR 2009, Barcelona, Spain, 26-29 July 2009, pp. 621–625, 2009.
[8] Y. Xu, W. He, F. Yin, and C.-L. Liu, “Page segmentation for historical handwritten doc-uments using fully convolutional networks,” in Proceedings of the 14th IAPR International Conference on Document Analysis and Recognition, pp. 541–546, 11 2017.
[9] B. Meier, T. Stadelmann, J. Stampfli, M. Arnold, and M. Cieliebak, “Fully convolutional neural networks for newspaper article segmentation,” in Proceedings of the 14th IAPR In-ternational Conference on Document Analysis and Recognition, 2017.
[10] D. Gautier and C. Gautier, Design, Typography, etc. A Handbook. Niggli, 2018.
[11] A. F. Frangi, W. J. Niessen, K. L. Vincken, and M. A. Viergever, “Multiscale vessel en-hancement filtering,” in Medical Image Computing and Computer-Assisted Intervention — MICCAI’98(W. M. Wells, A. Colchester, and S. Delp, eds.), (Berlin, Heidelberg), pp. 130– 137, Springer Berlin Heidelberg, 1998.
[12] S. Fourey, D. Tschumperlé, and D. Revoy, “A fast and efficient semi-guided algorithm for flat coloring line-arts,” in Proceedings of Eurographics International Symposium on Vision, Modeling and Visualization, (Stuttgart), 2018.
[13] “Newseum.” www.newseum.org. Accessed: 2019-02-15 to 2019-04-20.
RESEARCH CENTRE
SOPHIA ANTIPOLIS – MÉDITERRANÉE 2004 route des Lucioles - BP 93 06902 Sophia Antipolis Cedex
Publisher Inria
Domaine de Voluceau - Rocquencourt BP 105 - 78153 Le Chesnay Cedex inria.fr


![Figure 3: Illustration of the segmentation into relevant regions: (a) Original image by Newseum and DeMorgen, used under terms of fair-use; (b) Curvilinear structures detected using Frangi vesselness filter [11]; (c) Main regions found using coloring filte](https://thumb-eu.123doks.com/thumbv2/123doknet/13168903.390439/10.892.108.730.186.422/illustration-segmentation-relevant-original-demorgen-curvilinear-structures-vesselness.webp)