HAL Id: hal-01139600
https://hal.archives-ouvertes.fr/hal-01139600
Submitted on 13 Jan 2016HAL is a multi-disciplinary open access
archive for the deposit and dissemination of sci-entific research documents, whether they are pub-lished or not. The documents may come from teaching and research institutions in France or abroad, or from public or private research centers.
L’archive ouverte pluridisciplinaire HAL, est destinée au dépôt et à la diffusion de documents scientifiques de niveau recherche, publiés ou non, émanant des établissements d’enseignement et de recherche français ou étrangers, des laboratoires publics ou privés.
Distributed under a Creative Commons Attribution| 4.0 International License
Composition of eroded carbon during its journey
through a tropical watershed: a clue to the question
whether it is source or sink of CO2
C. Rumpel, Vincent Chaplot, Philippe Ciais, A. Chabbi, B. Bouahom, C.
Valentin
To cite this version:
C. Rumpel, Vincent Chaplot, Philippe Ciais, A. Chabbi, B. Bouahom, et al.. Composition of eroded carbon during its journey through a tropical watershed: a clue to the question whether it is source or sink of CO2. Biogeosciences Discussions, European Geosciences Union, 2013, 10 (11), pp.18175-18192. �10.5194/bgd-10-18175-2013�. �hal-01139600�
BGD
10, 18175–18192, 2013 Composition of eroded C C. Rumpel et al. Title Page Abstract Introduction Conclusions References Tables Figures J I J I Back CloseFull Screen / Esc
Printer-friendly Version Interactive Discussion Discussion P a per | D iscussion P a per | Discussion P a per | Discuss ion P a per | Biogeosciences Discuss., 10, 18175–18192, 2013 www.biogeosciences-discuss.net/10/18175/2013/ doi:10.5194/bgd-10-18175-2013
© Author(s) 2013. CC Attribution 3.0 License.
Open Access
Biogeosciences
Discussions
This discussion paper is/has been under review for the journal Biogeosciences (BG). Please refer to the corresponding final paper in BG if available.
Composition of eroded carbon during its
journey through a tropical watershed:
a clue to the question whether it is source
or sink of CO
2
C. Rumpel1, V. Chaplot2, P. Ciais3, A. Chabbi4, B. Bouahom5, and C. Valentin6
1
CNRS, Laboratoire de Biogéochimie des Milieux Continentaux, Centre INRA Versailles-Grignon, Bâtiment EGER, 78850 Thiverval-Grignon, France
2
SBEEH/IRD, Rabie Sanders Building, University of KwaZulu-Natal, Scootsville, 3209, South Africa
3
Laboratoire des Sciences du Climat et de l’Environnement, CEA Orme des Merisiers, Gif sur Yvette, France
4
UEFE, INRA Lusignan, France
5
SSLCC/NAFRI, Vientiane, LAO-PDR, France
6
Centre IRD d’île de France, 32, avenue Henri Varagnat, 93143 Bondy Cedex, France Received: 1 October 2013 – Accepted: 3 November 2013 – Published: 22 November 2013 Correspondence to: C. Rumpel (cornelia.rumpel@grignon.inra.fr)
BGD
10, 18175–18192, 2013 Composition of eroded C C. Rumpel et al. Title Page Abstract Introduction Conclusions References Tables Figures J I J I Back CloseFull Screen / Esc
Printer-friendly Version Interactive Discussion Discussion P a per | D iscussion P a per | Discussion P a per | Discuss ion P a per | Abstract
In order to assess whether eroded carbon is a net source or sink of atmospheric CO2, characterisation of the chemical composition and residence time of eroded organic matter (EOM) at the landscape level is needed. This information is crucial to evaluate how fast EOM can be decomposed by soil microbes during its lateral transport. This 5
study considers a continuum of scales to measure the fate of EOM during its trans-port, across a steep hillslope landscape of the Mekong basin, with intense erosion. Here we show that changes in the chemical composition of EOM (measured by NMR spectroscopy) and in its13C and15N isotope composition provide consistent evidence for EOM decomposition during the lateral transport of carbon on time scales of less 10
than 50 yr across distances of 10 km. Between individual soil units (1 m2) to a small watershed (107m2), the observed 28 % decrease of the C/N ratio and the enrichment of13C and15N isotopes in EOM is of similar magnitude than the enrichment with depth in soil profiles due to soil organic matter “vertical” decomposition. Radiocarbon mea-surements indicated that these changes are not related to the slow transformation of 15
soil carbon during pedogenesis, but rather to an acceleration of the SOM stabilisation process during its journey through the watershed.
1 Introduction
The decomposition of soil organic matter is one of the most important processes con-trolling the response of the global carbon cycle to climate and land use change (e.g., 20
Lal et al., 2004). The paradigm of one-dimensional microbial decomposition occurring only at depth in the soil profile, as adopted by all global models, is however highly ques-tionable because of lateral transport of soil organic matter during hydrologic erosion. In this context, it remains controversial whether eroded organic matter (EOM) is a source or a sink of carbon (Van Oost et al., 2007, 2008; Lal and Pimentel, 2008; Kuhn et al., 25
BGD
10, 18175–18192, 2013 Composition of eroded C C. Rumpel et al. Title Page Abstract Introduction Conclusions References Tables Figures J I J I Back CloseFull Screen / Esc
Printer-friendly Version Interactive Discussion Discussion P a per | D iscussion P a per | Discussion P a per | Discuss ion P a per |
of atmospheric CO2(Jacinthe and Lal, 2001), but recent modelling evidence suggests that agricultural erosion could lead to a removal of 0.06–0.27 Pg of C from the atmo-sphere per year (Van Oost et al., 2007; Berthe et al., 2007) because erosion transports otherwise labile carbon into landscape elements where its decomposition is slowed down. Therefore, the lability of EOM needs to be quantified and understood. Recent 5
studies suggest that EOM is not mineralised during the erosion event but rather re-deposited within or exported from the catchment (Wang et al., 2010). There is general consensus that organic matter of the light particulate fraction is subject to preferential detachment and transport by erosion (Gregorich et al., 1998; Rodriguez-Rodriguez et al., 2004). This erodible SOM fraction is usually composed of structurally labile 10
plant litter compounds, such as proteins and polysaccharides, with minor contribution of more recalcitrant structures, such like lignin and cutin (Kölbl and Kögel-Knabner, 2004). As a result the potential carbon mineralisation from eroded sediments is usu-ally enhanced after detachment compared to bulk soil (Jacinthe et al., 2002; Mora et al., 2007; Juarez et al., 2011). The actual mineralisation in the field may however be 15
smaller than often thought, due to formation of dense erosion crusts (Van Hemelryck et al., 2011). Morover, contribution of highly stable organic matter compounds, such as black carbon, found in fire-affected soils under slash and burn agriculture, may remain stable during erosion and transport (Rumpel et al., 2006a).
Ultimately, it is the relative contribution of labile vs. other stable organic matter types 20
to the eroded carbon flux, and their evolution during transport through the landscape, which determines the net C source or sinks balance of EOM.
In this study, we tracked EOM compositional changes of eroded sediments collected at different nested scales in a tropical sub-watershed of the Mekong river, one of the most biochemically active regions of the world because of high erosion rates and 25
tropical climate conditions. Specifically, we measured the elemental, isotopic and bulk chemical composition of sediments eroded from 6 nested scales of observation, going from pedon units of one square meter to the watershed (107m2). Data for every scale were recorded during 34 rainfall events of the rainy season of 2003. Depending on the
BGD
10, 18175–18192, 2013 Composition of eroded C C. Rumpel et al. Title Page Abstract Introduction Conclusions References Tables Figures J I J I Back CloseFull Screen / Esc
Printer-friendly Version Interactive Discussion Discussion P a per | D iscussion P a per | Discussion P a per | Discuss ion P a per |
rainfall intensity SOC transport can be fast during thunderstorms leading to massive soil loss. The aim of the study was to assess the changes occurring in biochemical composition and mean residence time of EOM recovered from different scales (hori-zontal direction) and to compare them to changes occurring during SOM stabilisation from top- to subsoil horizons (vertical direction).
5
2 Material and methods
2.1 Study area (geology and climate)
This study was performed in an easily accessible typical sloping land area of northern Laos under traditional slash-and-burn agriculture. The study area is a watershed of 10 km2 (i.e., 1 × 10⁷m2) forming part of the Mekong river basin. It shows high relief 10
formed within silty to sandy shales. Altitudes (Z ) range from 280 m at the watershed outlet to 1331 m in the southern part characterized by limestone cliffs. The median Z is 521 m and the coefficient of variation of Z is 78 %. Hill-slopes exhibit steep slopes (average slope gradient of 32 %) and are marked by an asymmetry with short gentle hill-slopes in the northern part and long and steep slopes in the southern part. Alfisols 15
(Soil Survey Staff, 1999) developed from shales are the most common soils in the watershed (Chaplot et al., 2005).
The area is under traditional shifting cultivation and slash and burn agriculture (SBA), where patches of secondary forest and woody/bushy fallows are cleared, the ground residues are burnt to enable cultivation for a short period before the land is allowed 20
to revert to fallow re-growth. Secondary forests cover about 15 % of the whole surface area, mostly on the crest tops.
The climate is marked by a study area has a tropical climate with two distinct sea-sons. The 30 yr average annual rainfall is 1403 mm and the mean annual temperature is 25◦C. Rainfall exceeds evapo-transpiration throughout the rainy season. The months 25
BGD
10, 18175–18192, 2013 Composition of eroded C C. Rumpel et al. Title Page Abstract Introduction Conclusions References Tables Figures J I J I Back CloseFull Screen / Esc
Printer-friendly Version Interactive Discussion Discussion P a per | D iscussion P a per | Discussion P a per | Discuss ion P a per |
occurred from 25 May to 2 October with a cumulative rainfall amount of 1044 mm. These events exhibited amounts of between 4 and 127 mm and eight events had a cu-mulative rainfall over 40 mm.
2.2 Plot establishment
In a tributary of the Mekong river, we selected 6 nested scales from 1 m2; 2.5 m2; 5
0.6×10⁴m2, 30×104m2, 60×104m2and 1×10⁷m2in an attempt to investigate the dif-ferent erosion mechanisms of the detachment, transport and sedimentation and those involved in the decomposition of the eroded SOC. While both sediment detachment and runoff generation are certainly point phenomena and may be assessed on micro-plots, sedimentation or EOM decomposition is only operative at a certain distance from 10
the “source” (Bloschl and Sivalapan, 1995). Thus the different observation points as-sociated with the various nested scales along the downstream transport of sediments allowed the localization and the quantification of the sedimentation together with an assessment of the potential fate of EOM during its downstream transfer.
At the hill-slope level, twelve enclosed micro-plots of 1 m2 and eight plots of 2.5 m2 15
were installed at 4 positions from the back-slope to the upslope. These micro-plots are part of the micro-catchment of 0.6 × 10⁴m2under the third year of rice production following a 4 yr fallow period. The weir of the 0.6 × 10⁴m2 micro-catchment was con-structed within the hill-slope, at the back-slope position and collected surface runoff and sediments. It exited in the main Houay Pano flume with a permanent flow to the 20
watershed outlet. In this paper the term “micro-plot” is used for the 1 m2 areas, and “plot” for the 2.5 m2. The term “micro-catchment” is used for an area of 0.6 × 10⁴m2, “catchment” for both the 30 × 104 and 64 × 104m2 surfaces and “watershed” for the 1 × 10⁷m2surface area.
Field measurements were carried out from May immediately after the sowing of rain-25
fed rice to November following the harvest. The plots were weeded in mid June, late July and at the end of August. Weeding was performed by shallow tilling (0–2 cm) with a hoe.
BGD
10, 18175–18192, 2013 Composition of eroded C C. Rumpel et al. Title Page Abstract Introduction Conclusions References Tables Figures J I J I Back CloseFull Screen / Esc
Printer-friendly Version Interactive Discussion Discussion P a per | D iscussion P a per | Discussion P a per | Discuss ion P a per |
2.3 Soil sampling for the estimation of SOC content
Soil surface samples (0–5 cm) of the bare soil were collected in twelve 1 m2plots and eight 2.5 m2 plots. Three randomly chosen sampling locations were selected in the vicinity of each plot. The samples were collected manually, mixed, air-dried at room temperature, and passed through a 2 mm sieve for further analysis of the soil organic 5
carbon.
2.4 Estimation of runoff, sediment and SOC losses by water erosion
The amount of runoff, sediment and EOM discharged from each of the nested scales was estimated by using buckets for the 1 and 2.5 m2plots and an automatic water level recorder and water sampler that sampled continuously during flooding events at the 10
weirs installed from 0.6 × 10⁴to 1 × 10⁷m2.
After each rainfall event, aliquots were collected in the buckets from the 1 and 2.5 m2 plots. All the water samples were oven-dried to estimate sediment concentration and sediment discharge. These samples were later analyzed for total OC, and elemental, chemical and isotopic compositions. Since the surface areas studied were not identical, 15
the different fluxes were compared by calculating the amount of eroded C per surface unit rather than by calculating the total amount eroded from the total surface area. Thus, at all scales, erosion values were estimated in g m−2.
2.5 Elemental and stable isotope analysis of carbon and nitrogen
OC and N contents were determined by the dry combustion method using a CHN 20
auto-analyser (CHN NA 1500, Carlo Erba) coupled to an isotopic ratio mass spec-trometer (VG Sira 10) yielding the ratio of stable OC isotopes (δ13C). Stable N iso-tope ratios (δ15N) were determined with a CHN analyser coupled to an Isochrom III Isotopic mass spectrometer (Micromass-GVI Optima). Results for isotope abundance were reported in per mil (‰) relative to the Pee Dee Belemnite standard (PDB) and 25
BGD
10, 18175–18192, 2013 Composition of eroded C C. Rumpel et al. Title Page Abstract Introduction Conclusions References Tables Figures J I J I Back CloseFull Screen / Esc
Printer-friendly Version Interactive Discussion Discussion P a per | D iscussion P a per | Discussion P a per | Discuss ion P a per |
relative to air N2for δ13C and δ15N, respectively. Analytical precision was ±0.1 mg g−1 for OC and ±0.05 mg g−1for N content. Analytical precision for isotope measurements was ±0.3 ‰.
2.6 14C activity measurements
Measurements of14C activity were performed to assess the mean residence time of C 5
within the system. The14C activity was measured on CO2 obtained by combustion of solid samples at the accelerated mass spectrometer “AMS” facility “Artemis” in Saclay, France.
2.7 Chemical composition
The chemical composition of EOM was analysed by13C CPMAS NMR spectroscopy 10
after demineralisation with 10 % hydrofluoric acid. This treatment was found not to alter the chemical composition of organic matter as seen by NMR spectroscopy (Rumpel et al., 2006b). The spectra were recorded on a Bruker DSX-200 NMR spectrome-ter. Cross polarization with magic angle spinning (CPMAS) (Schaefer and Stejskal, 1976) was applied at 6.8 kHz. The13C chemical shifts were referenced to tetramethyl-15
silane. A contact time of 1 m was used and the pulse delay was 400 ms. Solid-state
13
C NMR signals were recorded as free induction decay (FID) and Fourier transformed to yield the NMR spectra. The spectra were integrated using the integration routine of the spectrometer. The chemical shift regions 0–45 ppm, 45–110 ppm, 110–140 ppm, 140–160 ppm and 160–220 ppm corresponded to alkyl C, O-alkyl C, C substituted aryl 20
BGD
10, 18175–18192, 2013 Composition of eroded C C. Rumpel et al. Title Page Abstract Introduction Conclusions References Tables Figures J I J I Back CloseFull Screen / Esc
Printer-friendly Version Interactive Discussion Discussion P a per | D iscussion P a per | Discussion P a per | Discuss ion P a per |
3 Results and discussion
The amount of EOM, and its isotopic and chemical composition collected across a con-tinuum of spatial scales across the small watershed suggest changes in the biogeo-chemical properties during its transport by erosion (Figs. 1 and 2). Firstly, we observed an increase in the carbon content of eroded sediments from 1 to 2.5 m2 scale, fol-5
lowed by a decrease at larger scales. The C/N ratio of EOM decreased significantly towards larger scales, going from C/N= 14 at the 1 m2 scale down to C/N= 10 at the 107m2 scale. This suggests either preferential removal of C relative to N by microbial decomposition, or enrichment in nitrogen during EOM transport.
The action of microbial decomposition on EOM at larger scales is evidenced by 10
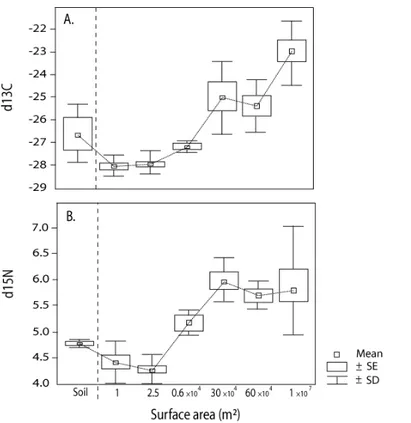
changes in the stable carbon and nitrogen isotopic ratios, which both increase towards larger horizontal scales (Fig. 2), by 4–5 ‰ for13C and 1–2 ‰ for 15N respectively. An isotopic enrichment of similar magnitude is usually observed within soil profiles during organic matter decomposition and stabilisation due to “vertical” microbial processing of labile carbon compounds (Rumpel and Kögel-Knabner, 2011). The biggest increase in 15
13
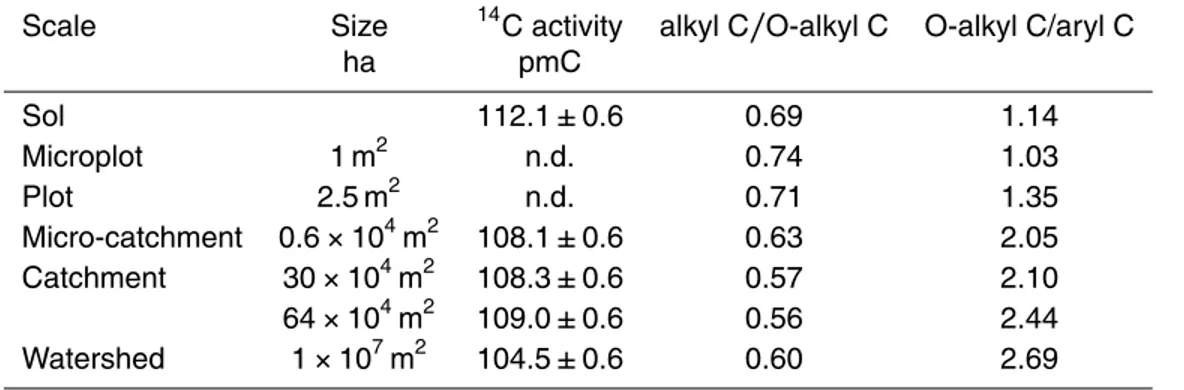
C and15N content of SOC are found at the scale of 30 × 104m2. Further, changes in the radiocarbon content of the samples also occur in horizontal direction, i.e. follow-ing transport. The 14C of EOM tends to continue to decrease from 108 to 104 pMC between soil pedon and watershed scale (Table 1). Overall, the14C data indicate that EOM is recent (less than 50 yr old).
20
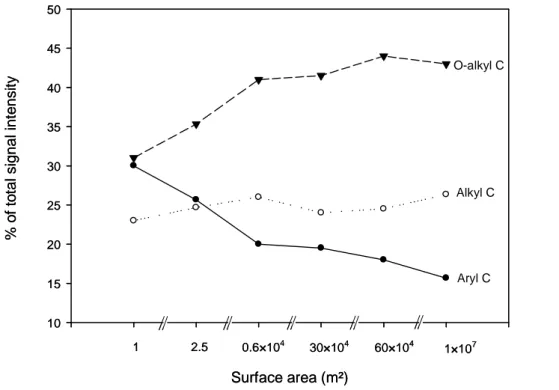
Chemical composition of EOM was analysed using solid state 13C nuclear mag-netic resonance spectroscopy. This method gives a good overview of the quantitative contribution of alkyl, O-alkyl, aromatic and carboxyl SOM compounds. Data (Fig. 3) show that the dominant signals representing between 31 and 44 % of the signal in-tensity in the spectra of soils and sediments collected throughout the rainy season at 25
the different spatial scales were those of O-alkyl C (45–105 ppm). These signals are most likely to be related to the presence of polysaccharides (Kögel-Knabner, 1997). The peaks between 0–45 ppm correspond to the presence of lipids, cutin, suberin and
BGD
10, 18175–18192, 2013 Composition of eroded C C. Rumpel et al. Title Page Abstract Introduction Conclusions References Tables Figures J I J I Back CloseFull Screen / Esc
Printer-friendly Version Interactive Discussion Discussion P a per | D iscussion P a per | Discussion P a per | Discuss ion P a per |
other aliphatic bio-macromolecules, all grouped as alkyl C components. The main sig-nal at 32 ppm corresponds to long-chain methylene structures whereas that at 23 ppm corresponded to short-chain or branched structures synthesized by microorganisms during biodegradation (Baldock et al., 1989; Golchin et al., 1996). Signals between 110–160 ppm corresponded to aryl C, mainly lignin-derived phenols: protonated, C-5
substituted and O-substituted aromatic C (Knicker et al., 1993). The main signal at 130 ppm represented C-substituted aromatic C, which may be derived from stable aro-matic compounds, such as black carbon (e.g. Skjemstad et al., 1996). No distinct signal was found between 130 and 160 ppm, in the spectrum area corresponding to tannins and tannin-like structures.
10
13
C CPMAS NMR spectroscopy indicated that at 1 and 2.5 m2 scale, EOM is domi-nated by an aromatic signal between 110 and 160 ppm most likely related to the pres-ence of fire-derived black carbon, produced during slash-and-burn agriculture (Rumpel et al., 2006b). Towards larger scales this signal is decreasing in favour of O-alkyl C structures, indicators of easily degradable polysaccharide material and alkyl C (Fig. 4). 15
This is illustrated by and increasing O-alkyl/aryl ratio (Table 1). Moreover, the alkyl/O-alkyl ratio is decreasing at greater scales. Consistent with the elemental and stable isotope data, the O-alkyl and alkyl compounds may be microbial-derived.
It is interesting to note, that changes in chemical and stable isotope composition observed during erosion are also occurring with depth in soil profiles (Rumpel et al., 20
2008). Quantitative evaluation of carbon erosion showed, that only 2 % of the initially EOM reaches the outlet of the watershed (Chaplot et al., 2005). Estimates on the car-bon remaining in soil following humification and stabilisation processes are in a similar range (Rasse et al., 2006). However, the timescales on which these changes are oc-curring are quite different in vertical and horizontal direction (> 500 yr in vertical and 25
< 50 yr in horizontal direction). Our data suggest in accordance with other work on OM compounds stabilised by pedogenic processes (e.g. Kiem and Kögel-Knabner, 2003; Spielvogel et al., 2008; Rumpel et al., 2010) that EOM compounds are mainly microbial-derived carbohydrates, which are stabilised due to interaction with the
min-BGD
10, 18175–18192, 2013 Composition of eroded C C. Rumpel et al. Title Page Abstract Introduction Conclusions References Tables Figures J I J I Back CloseFull Screen / Esc
Printer-friendly Version Interactive Discussion Discussion P a per | D iscussion P a per | Discussion P a per | Discuss ion P a per |
eral phase. Desorption and in turn mineralisation of these labile compounds when reaching fresh and/or saltwater systems is limited (Butman et al., 2007). We conclude that OM stabilisation is greatly accelerated during the erosion process.
Acknowledgements. This research is part of the Management Soil Erosion Consortium (MSEC) aimed at giving South-East Asia a better understanding of water erosion within catch-5
ments. The authors gratefully acknowledge the Institut de Recherche pour le Développement (IRD, former ORSTOM), the Asian Development Bank (ADB) and the International Water Man-agement Institute (IWMI) for funding this project and the Soil Survey and Land Classification Center for providing data and hosting the foreign research in Laos. We also thank the SSLCC GIS laboratory staff for assistance. Special thanks go to Maureen Brown for assistance in the 10
final preparation.
References
Baldock, J. A., Oades, J. M., Vassallo, A. M., and Wilson, M. A.: Incorporation of uniformly labeled13C-glucose carbon into the organic fraction of a soil. Carbon balance and CP/MAS
13
C NMR measurements, Australian Journal of Soil Science, 27, 725–746, 1989. 15
Berhe, A. A., Harte, J., Harden, J. W., and Torn, M. S.: The significance of the erosion-induced terrestrial carbon sink, Bioscience, 57, 337–346, 2007.
Butman, D., Raymond, P., Oh, N. H., and Mull, K.: Quantity,14C age and lability of desorbed soil organic carbon in fresh water and seawater, Org. Geochem., 38, 1547–1557, 2007. Chaplot, V., Rumpel, C., and Valentin, C.: Water erosion impact on soil and carbon re-20
distributions within uplands of South-East Asia, Global Biogeochem. Cy., 19, GB4004, doi:10.1029/2005GB002493, 2005.
Golchin, A., Clarke, P., and Oades, J. M.: The heterogeneous nature of microbial products as shown by solid-state13C CP/MAS NMR spectroscopy, Biogeochemistry, 24, 71–94, 1996. Gregorich, E. G., Geer, K. J., Anderson, D. W., and Liang, B. C.: Carbon distribution and losses: 25
erosion and deposition effects, Soil Till. Res., 47, 291–302, 1998.
Jacinthe, P. A. and Lal, R.: A mass balance approach to assess carbon dioxide evolution during erosional events, Land Degradation and Devastation, 12, 329–339, 2001.
BGD
10, 18175–18192, 2013 Composition of eroded C C. Rumpel et al. Title Page Abstract Introduction Conclusions References Tables Figures J I J I Back CloseFull Screen / Esc
Printer-friendly Version Interactive Discussion Discussion P a per | D iscussion P a per | Discussion P a per | Discuss ion P a per |
Jacinthe, P. A., Lal, R., and Kimble, J. M.: Carbon dioxide evolution in runoff from simulated rainfall on long-term no-till and plowed soils in southwestern Ohio, Soil Till. Res., 66, 23–33, 2002.
Juarez, S., Rumpel, C., Nontokozo-MChunu, C., and Chaplot, V.: Carbon mineralisation and lignin contribution to sediments detached from soils by water erosion in a South-African 5
grassland watershed, Geoderma, 167–168, 247–253, 2011.
Kiem, R. and Kögel-Knabner, I.: Contribution of lignin and polysaccharides to the refractory carbon pool as studied in C-depleted arable soils, Soil Biol. Biochem., 35, 101–118, 2003. Kögel-Knabner, I.: 13C and 15N NMR spectroscopy as a tool in soil organic matter studies,
Geoderma, 80, 243–270, 1997. 10
Kölbl, A. and Kögel-Knabner, I.: Content and composition of particulate organic matter in arable cambisols of different texture, J. Plant Nutr. Soil Sc., 167, 45–53, 2004.
Knicker, H.: Quantitative 15N- und 13C-CPMAS-Festkörper- und 15N-Flüssigkeits-NMR Spek-troskopie an Pflanzenkomposten und natürlichen Böden, Dissertation, 1993.
Kuhn, N. J., Hoffmann, T., Schwanghart, W., and Dotterweich, M.: Agricultural soil erosion and 15
global carbon cycle: controversy over?, Earth Surf. Proc. Land., 34, 1033–1038, 2009. Lal, R.: Soil carbon sequestration impacts on global climate change and food security, Science,
304, 1623–1627, 2004.
Lal, R. and Pimentel, D.: Letter on “Soil erosion: a carbon sink or source?”, Science, 319, 1040–1041, 2008.
20
Mora, J. L., Guerra, J. A., Armas, C. M., Rodriguez-Rodriguez, A., Arbelo, C. D., and No-tario, J. S.: Mineralization rate of eroded organic C in andosols of the Canary Islands, Sci. Total Environ., 378, 143–146, 2007.
Rasse, D. P., Dignac, M.-F., Bahri, H., Rumpel, C., Mariotti, A., and Chenu, C.: Assessing lignin turnover in an agricultural field: from plant residues to soil-protected fractions, Eur. J. Soil 25
Sci., 57, 530–538, 2006.
Rodriguez Rodriguez, A., Guerra, A., Arbelo, C., Mora, J. L., Gorrin, S. P., and Armas, C.: Forms of eroded soil organic carbon in andosols of the Canary Islands (Spain), Geoderma, 121, 205–219, 2004.
Rumpel, C. and Kögel-Knabner, I.: Deep soil organic matter – a key but poorly understood 30
BGD
10, 18175–18192, 2013 Composition of eroded C C. Rumpel et al. Title Page Abstract Introduction Conclusions References Tables Figures J I J I Back CloseFull Screen / Esc
Printer-friendly Version Interactive Discussion Discussion P a per | D iscussion P a per | Discussion P a per | Discuss ion P a per |
Rumpel, C., Chaplot, V., Planchon, O., Bernadoux, J., Valentin, C., and Mariotti, A.: Preferential erosion of black carbon on steep slopes with slash and burn agriculture, Catena, 65, 30–40, 2006a.
Rumpel, C., Rabia N., Derenne, S., Quenea, K., Eusterhues, K., Kögel-Knabner, I., and Mariotti, A.: Alterations of soil organic matter following treatment with hydrofluoric acid (HF), Organic 5
Geochemistry, 37, 1437–1451, 2006b.
Rumpel, C., Chaplot, V., Chabbi, A., Largeau, C., and Valentin, C.: Stabilisation of HF soluble and HCl resistant organic matter in tropical sloping soils under slash and burn agriculture, Geoderma, 145, 347–354, 2008.
Rumpel, C., Eusterhues, K., and Kögel-Knabner, I.: Non-cellulosic neutral sugar contribution to 10
mineral associated organic matter in top-and subsoil horizons of two acid forest soils, Soil Biol. Biochem., 42, 379–382, 2010.
Schaefer, J. and Stejskal, E. O.: Carbon-13 nuclear magnetic resonance of polymers spinning at magic angle, J. Am. Chem. Soc., 98, 1031–1032, 1976.
Skjemstad, J. O., Clarke, P., Taylor, J. A., Oades, J. M., and McClure, S. G.: The chemistry and 15
nature of protected carbon in soil, Aust. J. Soil Res., 34, 251–271, 1996.
Soil Survey Staff: Soil taxonomy: a basic system of soil classification for making and interpreting soil surveys, 2nd edn., USDA-SCS Agric. Handb., US Gov. Print. Office, Washington, DC, 436 pp., 1999.
Spielvogel, S., Prietzel, J., and Kögel-Knabner, I.: Soil organic matter stabilization in acidic 20
forest soils is preferential and soil type specific, Eur. J. Soil Sci., 59, 674–692, 2008.
Van Hemelryck, H., Govers, G., Van Oost, K., and Merckx, R.: Evaluating the impact of soil redistribution on the in situ mineralization of soil organic carbon, Earth Surf. Proc. Land., 36, 427–438, 2011.
Van Oost, K., Quine, T. A., Govers, G., De Gryze, S., Six, J., Harden, J. W., Ritchie, J. C., 25
McCarty, G. W., Heckrath, G., Kosmas, C., Giraldez, J. V., da Silva, J. R. M., and Merckx, R.: The impact of agricultural soil erosion on the global carbon cycle, Science, 318, 626–629, 2007.
Van Oost, K., Six, J., Govers, G., Quine, T., and de Gryze, S.: Reply to letter on “Soil erosion: a carbon sink or source?” by Lal, R. and Pimentel, D., Science, 319, 1041–1042, 2008. 30
Wang, Z., Govers, G., Steegen, A., Clymans, W., Van den Putte, A., Langhans, C., Merckx, R., and Van Oost, K.: Catchment-scale carbon redistribution and delivery by water erosion in an intensively cultivated area, Geomorphology, 124, 65–74, 2010.
BGD
10, 18175–18192, 2013 Composition of eroded C C. Rumpel et al. Title Page Abstract Introduction Conclusions References Tables Figures J I J I Back CloseFull Screen / Esc
Printer-friendly Version Interactive Discussion Discussion P a per | D iscussion P a per | Discussion P a per | Discuss ion P a per |
Wilson, M. A.: NMR-Techniques and Application in Geochemistry and Soil Chemistry, Pergamin Press, Oxford, 1987.
BGD
10, 18175–18192, 2013 Composition of eroded C C. Rumpel et al. Title Page Abstract Introduction Conclusions References Tables Figures J I J I Back CloseFull Screen / Esc
Printer-friendly Version Interactive Discussion Discussion P a per | D iscussion P a per | Discussion P a per | Discuss ion P a per |
Table 1.14C activity and ratios of chemical groups as seen by13C CPMAS NMR spectroscopy determined for soil and eroded sediments at different scales.
Scale Size 14C activity alkyl C/O-alkyl C O-alkyl C/aryl C
ha pmC Sol 112.1 ± 0.6 0.69 1.14 Microplot 1 m2 n.d. 0.74 1.03 Plot 2.5 m2 n.d. 0.71 1.35 Micro-catchment 0.6 × 10⁴m2 108.1 ± 0.6 0.63 2.05 Catchment 30 × 104m2 108.3 ± 0.6 0.57 2.10 64 × 104m2 109.0 ± 0.6 0.56 2.44 Watershed 1 × 10⁷m2 104.5 ± 0.6 0.60 2.69
BGD
10, 18175–18192, 2013 Composition of eroded C C. Rumpel et al. Title Page Abstract Introduction Conclusions References Tables Figures J I J I Back CloseFull Screen / Esc
Printer-friendly Version Interactive Discussion Discussion P a per | D iscussion P a per | Discussion P a per | Discuss ion P a per | 17 1 2
Figure 1. Boxplot of organic carbon content (A), nitrogen content (B) and C/N ratio (C) for
3
the bulk soil and for sediments collected at the different spatial scales under study. Mean 4
values, standard errors and standard deviations were computed from the different plot 5
repetitions and from the 34 rainfall event under study. 6
Fig. 1. Boxplot of organic carbon content (A), nitrogen content (B) and C/N ratio (C) for the bulk soil and for sediments collected at the different spatial scales under study. Mean values, standard errors and standard deviations were computed from the different plot repetitions and from the 34 rainfall event under study.
BGD
10, 18175–18192, 2013 Composition of eroded C C. Rumpel et al. Title Page Abstract Introduction Conclusions References Tables Figures J I J I Back CloseFull Screen / Esc
Printer-friendly Version Interactive Discussion Discussion P a per | D iscussion P a per | Discussion P a per | Discuss ion P a per | 18 1 Figure 2. Boxplot of d13 C (A), d15
N (B) for the bulk soil and for sediments collected for the 2
soil and at the different spatial scales under study. Mean values, standard errors and standard 3
deviations were computed from the different plot repetitions and from the 34 rainfall event 4
under study. 5
6 7
Fig. 2. Boxplot of d13C(A), d15N(B) for the bulk soil and for sediments collected for the soil and at the different spatial scales under study. Mean values, standard errors and standard deviations were computed from the different plot repetitions and from the 34 rainfall event under study.
BGD
10, 18175–18192, 2013 Composition of eroded C C. Rumpel et al. Title Page Abstract Introduction Conclusions References Tables Figures J I J I Back CloseFull Screen / Esc
Printer-friendly Version Interactive Discussion Discussion P a per | D iscussion P a per | Discussion P a per | Discuss ion P a per | 19 1 2 3
Figure 3. Chemical composition of OC in soil and eroded sediments at different scales. Note
4
that at three scales sediments sampled at several dates throughout the rainy season were 5
analysed. 6
Fig. 3. Chemical composition of OC in soil and eroded sediments at different scales. Note that at three scales sediments sampled at several dates throughout the rainy season were analysed.
BGD
10, 18175–18192, 2013 Composition of eroded C C. Rumpel et al. Title Page Abstract Introduction Conclusions References Tables Figures J I J I Back CloseFull Screen / Esc
Printer-friendly Version Interactive Discussion Discussion P a per | D iscussion P a per | Discussion P a per | Discuss ion P a per | 20 1 2 3 4 5 6 7 8 9 10 11 12
Figure 4. Proportion of signal intensity of EOM collected at different spatial scales assigned 13
to aryl C, alkyl C and O-alkyl C 14 15 16 17 18 19 % o f to ta l s ig n a l in te n s it y 10 15 20 25 30 35 40 45 50 1 2.5 0.6×10⁴ 30×104 60×104 1×10⁷ Surface area (m²) Aryl C O-alkyl C Alkyl C % o f to ta l s ig n a l in te n s it y 10 15 20 25 30 35 40 45 50 1 2.5 0.6×10⁴ 30×104 60×104 1×10⁷ Surface area (m²) Aryl C O-alkyl C Alkyl C
Fig. 4. Proportion of signal intensity of EOM collected at different spatial scales assigned to aryl C, alkyl C and O-alkyl C.


![[PDF] Support de cours pour apprendre Word rapidement - Bureautique](data:image/gif;base64,R0lGODlhAQABAIAAAP///wAAACH5BAEAAAAALAAAAAABAAEAAAICRAEAOw==)