HAL Id: halshs-01275217
https://halshs.archives-ouvertes.fr/halshs-01275217
Preprint submitted on 17 Feb 2016
HAL is a multi-disciplinary open access
archive for the deposit and dissemination of
sci-entific research documents, whether they are
pub-lished or not. The documents may come from
teaching and research institutions in France or
L’archive ouverte pluridisciplinaire HAL, est
destinée au dépôt et à la diffusion de documents
scientifiques de niveau recherche, publiés ou non,
émanant des établissements d’enseignement et de
recherche français ou étrangers, des laboratoires
Public Private Partnerships from Budget Constraints:
Looking for Debt Hiding?
Marco Buso, Frédéric Marty, Tran-Phuong Tra
To cite this version:
Marco Buso, Frédéric Marty, Tran-Phuong Tra. Public Private Partnerships from Budget Constraints:
Looking for Debt Hiding?. 2016. �halshs-01275217�
!!!!!!!!!!!!!!!!!!!!!!!!!!!!!!!!!!!!!!!!!!!!!!!!!!!!!!!!!!!!!!!!!!!!!!
!
Discussion paper series
!
Chaire!Economie!des!Partenariats!Public4Privé!
Instituts!d’Administration!des!Entreprises!!
!
EPPP DP No. 2016-1
Public'Private-Partnerships-from-Budget-Constraints:-Looking-for-Debt-Hiding-?!!
-Marco BUSO
Frederic MARTY
Phuong Tra TRAN
!
Public-Private Partnerships from Budget Constraints: Looking for Debt
Hiding ?
IMarco Busoa,ú, Frederic Martyb, Phuong Tra Tranc
aUniversity of Padova, via del Santo 33, 35123 Padova bUniversity of Nice Sophia-Antipolis, 28 Avenue Valrose, 06103 Nice
cSorbonne Business School, 11-13 rue Watt 75013 Paris
Abstract
The use of Public-Private Partnerships (PPPs) to realize and operate public infrastructures is often as-sociated with fiscal circumventing motivations. Using data at the municipal level, this paper investigates whether budget-constrained public authorities adopt PPPs in order to hide public debts. The results show that financial difficulties often lead to a preference for PPPs instead of traditional forms of public procure-ment. However, this behavior is not explained by the possibility of debt hiding. We then discuss alternative explanations for these findings.
Keywords: Public-Private Partnership, debt hiding, budget constraint JEL: C41, C23, H54, L32
I. We are grateful to Marco Bertoni, Massimiliano Bratti, Alessandro Bucciol, Michael Klien, Scott Masten, Johan Nystrom, Stéphane Saussier, Stéphane Straub, Luciano Greco, Mario Padula, Lorenzo Rocco, Paola Valbonesi, Luigi Moretti, Enrico Rettore, and participants at the IRSPM 2013, RSSIA 2013, IIPF 2013 conferences and “The economics of Public Procurement workshop 2013” in Stockholm for their valuable comments and suggestions on different versions of this paper. The authors would also like to thank the Mission d’appui aux partenariats public privé (MaPPP) for providing data and useful information. Any remaining errors are the authors’ responsibility. An online appendix is available at https://sites.google.com/site/busomarco/
ú. Corresponding author: via del Santo 33, 35123 Padova, Tel. 049 8274268
Email addresses: [email protected] (Marco Buso), [email protected] (Frederic Marty), [email protected] (Phuong Tra Tran)
1. Introduction
Lately, financial restraints stemming from domestic policies, financial markets, or regulatory measures have significantly shaped the behavior of public decision makers.1 In particular, the shortage of financial
resources has substantially altered the government’s choices concerning public investment and spending. In this context, in contrast to traditional public investment methods, hybrid organizational forms such as public-private partnerships (PPPs) are often considered as a way to release public budget. For example, as announced by the United States Secretary of Transportation (Financial Times, 29 September 2015): “even in the “rosiest” political scenarios, there would not be enough public money forthcoming to plug a $1tn infrastructure funding gap through to the end of the decade”, and “public private partnerships can continue to play a role in helping us close that gap”.2
Following Hart (2003), PPPs are defined as contractual agreements allowing long-term involvement of private sector capital and expertise in the realization and management of a public asset that will be returned to the public sector after an adequate period of time. PPPs are therefore distinguished from traditional forms of public procurement where the financing is exclusively public, and the construction, maintenance and operation tasks are separately entrusted to different private companies. Although public actors have widely adopted PPPs in the context of budget constraints both at the national level (Hammami et al., 2006) and at the local level (Albalate et al., 2015), the motivations behind such decisions are subject to debate.
One explanation for public actors’ adoption of PPPs under budget constraints is debt hiding. Indeed, following the rule established by Eurostat in 2004,3 PPPs can be accounted off-balance-sheet (Eurostat,
2004).4In this sense, by using PPPs, public authorities may achieve requirements of balanced budgets, and
gain voters’ support in the short term.
This study focuses on this issue and better explains the reason behind public actors’ decision to choose PPPs when facing financial restraints. More specifically, we try to find evidence for managers’ adoption of a PPP strategy based only on a fiscal circumventing motivations, that is, taking public debt off the balance sheet. To the best of our knowledge, there is no empirical evidence on this topic. We contribute to the literature by studying more in details the PPP choice under budget constraints. Our conclusion can therefore provide a better understanding of PPP adoption from both a theoretical and practical perspective. To address our questions, we first use data from France to empirically test whether local governments are more likely to use PPPs when under budget constraints. Exploiting a feature of the French institutional context, where it has been mandatory for a local PPP to be accounted for on public record since January 1,
1. In the European Union, one prominent example is the limits on deficits and debt imposed through the 1992 Maastricht Treaty.
2. http://www.ft.com/cms/s/0/68d283a6-662a-11e5-97d0-1456a776a4f5.html#ixzz3rqyjLTPh 3. For more details on the Eurostat rule, see section 3.2.
4. Even with the recent International Public Sector Accounting Standard 32 which reconsidered this option, PPPs classifi-cation has not been significantly modified because most countries deviate from international standards (Funke et al., 2013).
2011, we are then able to identify whether this behavior occurs because of a fiscal circumventing motivation,
i.e., debt hiding. As a conclusion, we find that strict budget constraints are associated with a more frequent
tendency to invest through a PPP. However, although the new rule negatively impacts the use of PPPs, the effect of budget constraints persists, especially when financial costs are considered. We therefore conclude that the adoption of PPPs is determined by restrictions on financial resources and not merely from debt-hiding motivations. Thus, we finally discuss alternative explanations for the more frequent use of PPPs by budget-constrained public authorities.
This study is organized as follows. Section 2 describes the related literature and derives testable hypo-theses. Section 3 discusses the French institutional context and legal environment regulating PPPs. Section 4 describes the data and our empirical approach. Section 5 reports the analysis result and robustness checks. Section 6 discusses several main results. Finally, Section 7 concludes.
2. Related literature and hypotheses
2.1. Financial constraints and PPP
An increasing strand of literature focuses on the comparison between PPPs and more traditional forms of procurement with the purpose of detecting the pros and cons of the two methods for delivering high-quality public services at a low cost for taxpayers. In particular, the use of a PPP enables the government to establish a long-term agreement with private actors (private firms and banks) at the beginning of a project. On the one hand, the stronger involvement of private players together with the transfer of risks implies a better ex-ante assessment of the project and provides major incentives for early innovations able to reduce long-term maintenance and operational costs (Iossa and Martimort, 2015; Martimort and Pouyet, 2008; Legros and Dewatripont, 2005; Hart, 2003). On the other hand, an early commitment in situations of future uncertainties implies a lower level of flexibility and substantially increases the possibility of ex-post costly renegotiations (Guash et al., 2008; Martimort and Straub, forthcoming).
Previous papers have largely addressed the problem of the optimal mechanism to enhance private in-centives, expecially in contexts of contract incompleteness (see also de Bettignies and Ross, 2009) and asymmetric information (see also Hoppe and Schmitz, 2013). However, the public side of the partnership has been only marginally taken into account. Indeed, public spending decisions are also affected by other aspects such as the state of public finance or institutional and political concerns. The public perspective is mainly considered by only a few scholars who study whether it is optimal to select PPPs with the purpose of releasing public funds in situations of public budget constraints, either for a benevolent or a non-benevolent government.
In the first case, knowing that the stronger the budget constraint, the higher the distortion imposed on taxpayers to collect investment funds, the government aims at choosing the best alternative to minimize
such distortionary taxation. According to Engel et al. (2013), in a multiperiod context and without the presence of asymmetric information, PPPs are able to reduce the costs of collecting public funds only in the case of current liquidity constraints, i.e., the distortions caused by the lower governmental spending capacity are expected to be higher at time t compared to t + 1. The paper by Auriol and Picard (2013) introduced a parameter of adverse selection. More precisely, under the PPP solution (build-operate-transfer [BOT] contracts), the private actor is the project manager and it is allowed to operate under a laissez-faire regime. However, under the traditional forms of procurement, the public actor is the project manager and entrusts the realization of the public project to more informed private actors. The presence of asymmetric information implies more costly contracts and, as a consequence, higher public finance distortions. Bundling two unrelated tasks in a condition of a sequential moral hazard is studied by Schmitz (2013) and Buso (2014). In the former model, the author assumes that, under bundling, the private agent receives a single payment for both tasks. In the latter model, a separate payment for each period is possible,5 while the
private agent is wealth-constrained (limited liability rent) over the two periods. According to the model of Schmitz (2013), in the case of bundling, the principal must make a very large payment to the agent when both tasks are successfully completed. As a consequence, the principal strictly prefers separation when it is wealth-constrained. Nevertheless, according to Buso (2014), when separate payments are possible in the case of bundling, the presence of a single limited liability constraint makes incentives less costly thanks to the higher level of rent extraction by the principal; this last effect is stronger the more the government is wealth-constrained.
When the assumption of a benevolent government is relaxed, the public choice can be affected by op-portunistic behaviors and/or external pressures. First, governments can choose PPPs to benefit from a temporary delay in payments. This possibility comes from the fact that, in case of a PPP, public transfers to private companies normally start when the construction of the infrastructure is completed. Then, regardless of the presence of current liquidity constraints (Engel et al., 2013), mayors may opt for PPPs to shift the burden of payments to future local governments. This effect is mainly interesting in the case of high level of political competition (Phuong-Tra, 2014). Second, lobbies can try to influence the allocation of a limited amount of funds to different projects. Following this guidance, Maskin and Tirole (2008) show that through PPPs projects, true costs can be assessed earlier, making it hard for the official to push through her favorite project. Indeed, in the presence of a tight spending limit, through pre-evaluation, private finance leads to greater public investment.
On the empirical side, evidence is found for the impact of fiscal restrictions on the choice of PPPs. At the local government level, Russo and Zampino (2010) correlate PPP investment and municipal budget data in the Italian context. They show a strong positive relationship between local public debt and the number of
PPP projects. Deficit, in contrast, is not statistically related to PPP choice. Similarly, Albalate et al. (2015) find a positive impact of debt on the level of private involvement in public projects in the US. However, their results show a negative impact from tax revenue. They argue that states with higher revenues are likely to be less reliant on private investment. Hence self-finance capacities seem to have the opposite effect of debt.
We then develop our first hypothesis:
Hypothesis 1: When governments are financially constrained, public managers are more likely to use PPPs than traditional forms of procurement to realize public infrastructure.
2.2. PPP under financial restraints: fiscal circumvention motivations
Generally, decision makers of firms operating under financial restraints are more likely to distort their reported financial performance (Adams et al., 2008). On the one hand, through this practice, decision makers strive to raise capital and attract external financing by showing a better financial report than they would otherwise (Linck et al., 2013). On the other hand, this behavior is also explained by the self-interested motivations of managers that aim at boosting their own compensations (Burns and Kedia, 2006) or addressing their career concerns (DeFond and Park, 1997).
In the public sector, governments are also found to react to financial constraints. The public finance literature focuses on this topic in a general way and stresses that public actors have an incentive to shift debt off the public budget, potentially to meet fiscal constraints or to gain voters’ support. Originally, according to his theoretical model, Easterly (1999)’s claims that constraints on conventional measures of budget deficits or public debt will only induce an illusionary fiscal adjustment since government will prevent changes to its net worth. The argument states that governments seek to maintain current spending levels while reducing explicit debt and deficits, by “(1) cutting public investment, (2) privatization, (3) shifting revenue and expenditure over time, or (4) running implicit liabilities.” For instance, empirically, the adoption of the Stability and Growth Pact in the European Union seemed to be associated with a greater use of fiscal gimmicks. Governments are found to use stock-flow adjustments such as annual changes in the debt level to meet the deficit requirement (Buti et al., 2007; Von Hagen and Wolff, 2006). With a similar objective, Milesi-Ferretti and Moriyama (2006) take a different approach and find that the reduction of government debt in the EU is correlated with a reduction of government assets in the context of euro adoption. This result suggests that “an exclusive focus on deficit and debt levels conveys a misleading picture of the evolution of the underlying fiscal situation”.
Following the previous arguments, the adoption of PPPs in a budget-constraint context might be ex-plained by debt-hiding motivations (the possibility to be accounted off-balance-sheet; Eurostat, 2004). In isolating these specific reasons, we evaluate their relevance and the extent to which they explain the financial restraint effect on the use of PPPs.
Hypothesis 2: Without the possibility of debt hiding, the impact of financial restraints on the use of PPPs should decrease significantly.
3. Institutional details
In this section, we first focus on describing French municipalities’ budget elaboration and control pro-cesses. Then, we analyze how PPP accounting rules can lead to debt-hiding behaviors.
3.1. French municipalities’ budgets
France has 36,000 municipalities, which are called “communes” and represent the fifth administrative level in France. Each has a mayor and a municipal council, who jointly manage the area’s administration and have exactly the same powers no matter the commune’s size. In terms of investment, they are in charge of pre-primary and primary schools, libraries, cultural/sport centers, and urban equipment. The principle of municipal self-government gives the municipality wide scope to take responsibility for its own investments, organization, and financing. However, following the General Code for Local Authorities,6 their budgets
are constrained, as they have to achieve a balanced public account for both the investment and operation sections. This balanced budget requirement contains both political and technical dimensions according to Hou (2006). The control is carried out by either the Administrative Courts or the Regional Court of Accounts (Chambre régional des Comptes). The first control includes the Prefect’s supervision over the effective balance of municipalities’ accounts, as well as the possibility of the administrative courts taking action against a mayor’s misuse of power. The second instrument aims at checking both the ex ante achievement of the balanced budget requirement and ex post excessive deficits with respect to balanced budget targets from 5 to 10%.
In such a context, heavily indebted municipalities have higher levels of budget constraints placed upon their ability to achieve their infrastructures investment strategies (CES, 2012). Public investment levels in France are known to have dropped in the 1990s due to hard budget constraints and a high level of public debt. In fact, existing debt is a burden for municipalities’ operating and investment budgets: a high level of existing debt pushes up both the corresponding financial costs (which are part of the operating expenses) and the annual debt service (which is part of the investment expenses). As a consequence, the self-financing capacity of these municipalities is reduced. In order to achieve the same level of investment as other municipalities, they can only take larger and more costly loans from commercial banks.
6. France’s General Code for Local Authorities (Code général des collectivités territoriales - CGCT) includes laws and regulations applied to local authorities’ three main levels: municipality, department, and region.
3.2. PPP and debt-hiding motivations
As discussed above, the fact that PPP can be accounted off-balance-sheet following the Eurostat decision in 2004 seemed to offer a possible method to circumvent budget constraints. The Eurostat rule classifies infrastructure realized through PPPs as non-governmental through the “risks and rewards” criterion (Eu-rostat, 2004). Following this guidance, public authorities have accounted PPPs off-balance-sheet when the construction risk and at least one of either availability or demand risk are transferred to the private operator. In such a manner, a PPP is accounted based on the logic of accrual accounting: the annual payment related to investment, financial, and operating costs is reflected in the public account; the remaining debt element is accounted as a multi-annual plan of payment in an appendix to the balance sheet. As a consequence, debt corresponding to a PPP does not appear on the public balance sheet.
This accounting rule might increase incentives in favor of PPP procedures for reasons other than the to-be-achieved target of value for money. The first level is the budgetary level; PPPs can enable public authorities lacking a sufficient capital budget to achieve their desired capital investment strategy. In fact, while a traditionally procured capital project presents a significant immediate hit to a municipality’s capital budget, PPPs will have a smaller impact. Second, the French target, in place since 2005 to reduce Public Sector Net Debt from 86% of the GDP (2014) to under 60%, could provide an incentive favoring PPPs over spending funded directly by government borrowing. This reflects the fact that in the short term, a PPP scheme would result in reduced government borrowing, i.e., a lower level of Public Sector Net Debt. Third, European level requirements, via the the Maastricht Treaty, oblige member states to avoid excessive budgetary deficits. More precisely, the treaty states that governments’ annual deficit and debt should not exceed: (a) 3% for the ratio of planned or actual government deficit to GDP at market prices and (b) 60% for the ratio of government debt to GDP at market prices (OJEU, 2004). These European fiscal rules therefore motivate the use of investment methods that allow off-balance-sheet accounting. Finally, public managers’ self-interest cannot be excluded. Indeed, a mayor might choose PPPs according to a debt-hiding strategy in order to improve the public account with the objective of gaining voters’ support.
However, at the end of 2010, the French Government introduced a decree on the topic of PPP accounting rules. This decree requires PPP projects at the local level to be recognized on the balance sheet and applies to both existing and new projects. Two reasons motivated this clarification of PPP accounting. First, it reflects a desire to follow the UK experience regarding PPPs, which is the most advanced in the world. Indeed, in 2011, the UK Government committed to providing more transparency of PPP accounting. The Office for Budget Responsibility decided to include an assessment of the impact of PPP liabilities in their fiscal sustainability report-a break with previous years’ National Accounts. Second, the application of the International Financial Reporting Standards (hereafter IFRS) implied a switch from the previously used “risks and rewards” criterion to control criteria for PPP accounting. More precisely, under a PPP, if the public authority controls one of the following five aspects of the project, the corresponding debt should be
accounted on-balance-sheet: (a) the private operator is not able to sell or take out a loan on the equipment, (b) the occupation of a public-owned domain, (c) the definition of the equipment’s main features, (d) public services’ management, and (e) the revenue paid to the private operator for his service. This new rule has led to the recognition of the asset and corresponding debt upon the infrastructure’s delivery on the public account. In other words, the balance sheet records the investment’s capital value as an asset, while the already-paid investment and remaining debt are recorded as liabilities.
4. Data and empirical strategy
The main data and results are reported in the present paper. More detailed tables and robustness checks are reported in the online appendix available at https://sites.google.com/site/busomarco/ (author’s website).
4.1. Data
To address our questions, we develop a unique panel dataset that includes data on - PPP projects from the MaPPP, - municipalities’ financial, political, and managerial characteristics from the Ministry of Economy and Finances, the Center of Socio-Political Data at the Paris Institute of Political Studies (the Sciences Po Center), and the Ministry of Interior. The dataset covers the 2004-2013 period and contains information on both collectivities that have and have not executed a PPP. The group of public administrations that have not implemented a PPP was chosen using a propensity score matching strategy on the basis of local and demographic characteristics furnished by the French National Institute of Statistics and Economic Studies (INSEE). We chose to focus our analysis on the municipal level instead of including the two other levels of public administration, i.e., department and region. This enables us to examine comparable public entities with the same power of decision making regarding public investment. Moreover, all studied dimensions are equivalent among them. In the next paragraphs, we detail, step by step, the procedure implemented to obtain our final panel dataset.
4.1.1. Treated group: PPP dataset
Our principal dataset comprises all the 101 PPP projects enacted at the municipal level. These projects were concluded between the date of creation of a PPP market (January 2004) and August 2013 by 92 municipalities and 3 inter-municipalities.7We choose the biggest municipality of the inter-municipalities as
the public actor to preserve the comparability of the 101 observations. We collaborated with the MaPPP department to collect the main project characteristics, such as the concerned public entity, year of signature, type of project, and its capital value.
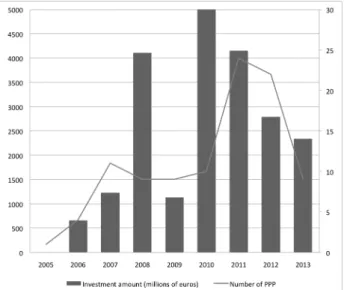
Figure 1 describes PPP trends at the French municipal level since 2004. The number of PPPs remained stable from 2007 to 2010 and then increased considerably after 2011 before finally decelerating in 2013. The cumulative amount of projects, i.e., the value of the projects’ capital investment, increased through 2008, declined in 2009, increased again in 2010, and again declined in 2012. We also note that our sample includes 55 PPP projects before 2011 and 56 after 2011. Therefore, the two groups are equivalent in terms of number for a comparison of the effect of the 2011 decree.
4.1.2. Control group: matching strategy
We used a matching strategy to select a control group that is similar to our treated group in terms of the need for public infrastructure. This need is determined through a dataset describing the characteristics of all 36,000 French municipalities provided by the INSEE.8The use of a matching strategy particularly fits
our need. Indeed, this choice-based sampling design is used in evaluation studies where the potential control population is much larger than the treatment sample (Heckman and Todd, 2009; Rubin and Thomas, 2000; Rosenbaum and Rubin, 1985).
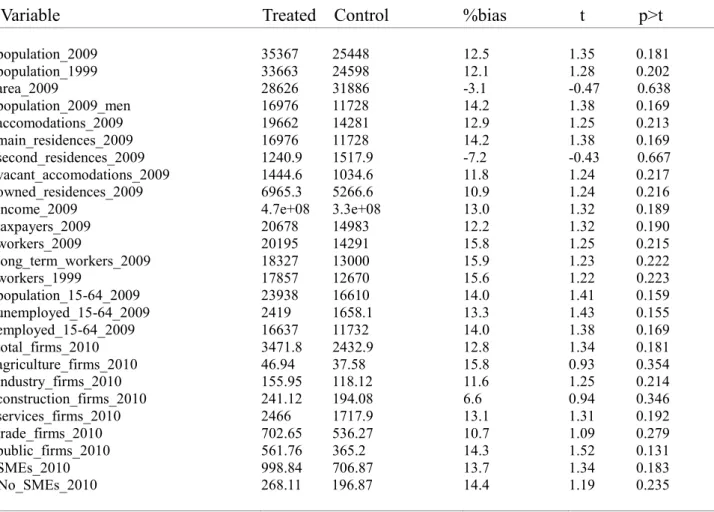
Following previous studies, we first use a logistic regression and a nearest neighbor estimation (neighbor (3)) to estimate the propensity score. The dependent variable is a dummy describing whether a municipality has undertaken a PPP investment. The covariates represent municipalities’ need for infrastructure. We not only follow Bahl and Duncombe (1993) in using municipality population (in 2009 and 1999) and income level (in 2009) to measure public investment demand, but we also include additional variables covering the years 1999, 2009, and 20109: area, number of households, total tax revenues, number of workers, number of
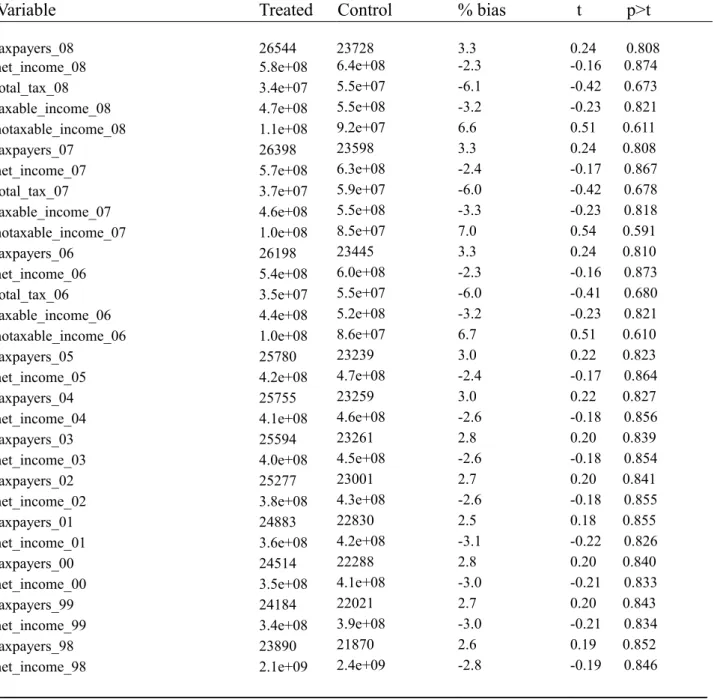
unemployed people, population age distribution, number of firms in different sectors, number of public firms, and number of small and medium enterprises. Second, we choose the two nearest neighbor observations in terms of propensity score for each municipality in our treatment group. We thus finally obtain a sample of 303 municipalities, with 101 included in the PPP group (“treated group") and 202 in the group without PPP (“control" group). We further control for the balancing of observable municipal variables along the 1998 to 2010 period in tables 1 and 2.10
4.1.3. Financial and political datasets
We collected financial data for the 2003-2012 period for virtually all French municipalities from the web-site of the Ministry of Economy and Finances to analyze our research questions.11This dataset documents
the general financial information of each municipality’s yearly accounting statement, such as investments and
8. This dataset is available on the INSEE website.
9. We consider municipal characteristics related to both the period preceding the introduction of a PPP’s market and the years just before the implementation of the 2011 legislation.
10. Due to this control, we can ensure that the municipalities in the two groups are similar with respect to the observable variables for the entire time interval 1998-2010.
11. This financial information is available on the website www.colloc.bercy.gouv.fr. We collected this information through the Python program. The dataset is therefore available from the authors upon request.
expenses as well as revenue structure, including deficits and public debt. In this dataset, municipalities are organized into 30 “reference groups” classified by population size, participation in the public establishment of inter-municipal cooperation, and any additional tax systems adopted by the inter-municipal institution. For each reference group, the average value of each financial dimension is provided. In our analysis, as a further control for municipalities’ heterogeneity, we use the difference between the municipality’s value and the average of its reference group as financial covariates.12
Two other datasets are used to capture political and managerial dimensions. The first one comes from the Sciences Po Center. This dataset contains the main information regarding municipal elections - for example, the mayor’s political party. We complement this by adding information on the mayor’s personal characteristics taken from the National Repertory of Politicians dataset of the Ministry of Interior.13
4.1.4. Final panel dataset
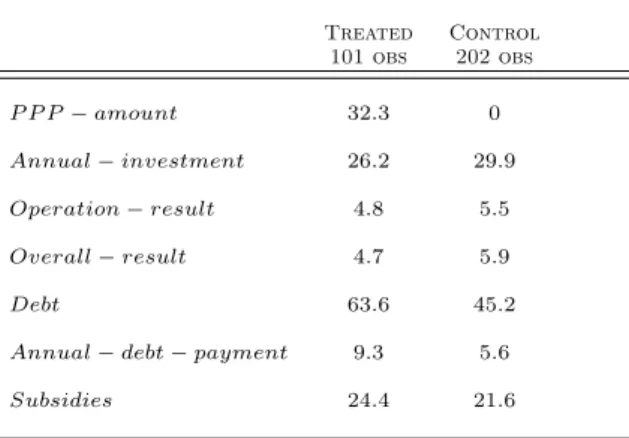
Finally, we obtain a panel dataset enabling us to compute the effect of a municipality’s financial constraint on the use of PPPs instead of alternative organizational forms. Table 3 presents the main financial characte-ristics of our treated and control groups. The reported values are the means over the period 2003-2012. On average, the investment amount in PPP is 32.3 million of euros for the treated group. This value is logically 0 for the control group. In general, we observe a better financial situation for the control group. Indeed, they have higher positive results both in the operation section, i.e., operation ≠ result (5.5 million euro versus 4.8 million euro) and the entire budget, i.e., overall ≠result (5.9 million euro versus 4.7 million euro). They also receive less subsidies from the central government (21.6 million euro versus 24.4 million euro). Their level of debt is nevertheless lower than the treated group, both in terms of stock debt (45.2 million euro versus 63.6 million euro) and annual debt payment (5.6 million euro versus versus 9.3 million euro). These figures therefore show that the control group has a better self-financing capacity than the treatment group. They also invest more than the treated group (29.9 millions of euros versus 26.2 millions of euros). We then suppose that public actors from this group prefer alternative organizational forms other than PPP to realize their investment in infrastructures.
4.2. Description of variables
As we use a panel database covering the period 2004 to 2013, all variables are defined for each municipality
i and each year t. Table 4 reports the variables’ descriptions with the expected signs.
12. We also consider the gross value of each financial dimension as a robustness check, and we find that the main results do not differ. For the remainder of the paper, we therefore only refer to the financial covariates as the difference between the municipality’s value and the average of its reference group.
4.2.1. Time variables
As previously discussed, we are interested in explaining the use of PPPs by French municipalities; thus, we introduce the dependent variable pppit. If municipality i in year t has implemented a PPP, then pppit is equal to one in t and until the end of the time interval, i.e., 2013; and equals zero for the entire period before year t. This type of time variable is used to perform the duration analysis presented in Section 4.3. However, when presenting the robustness checks, we use a different dependent variable that equals one if municipality i in year t has implemented a PPP, and zero otherwise.
4.2.2. Explanatory variables
As there is no universally accepted measure of financially constrained firms (Linck et al., 2013), and even less so for the public sector and municipality financial situation, we consider three measures for our explanatory variables. These variables are lagged by one year to avoid endogeneity issues. We follow Bahl and Duncombe (1993) in using both stock and flow measures for debt burden. The stock variable, debtit≠1,
captures the municipality’s ex ante exogenous situation. We then use two flow variables to measure how a municipality’s conditions change during the period preceding the investment start: annual ≠ paymentit≠1
captures annual debt expenses (interest and capital reimbursement), and self ≠ financeit≠1 captures a
municipality’s self-financing capacity (the surplus from the operating budget that can be used to finance new investment net of the reimbursements in capital of loans).14
Debt-hiding incentives for engaging in PPPs in France were ruled out in 2011. We explain this legal discontinuity by introducing the variable rulet, which equals one for periods of time following January 1, 2011 and zero otherwise.15We are interested in the interaction term among rule
tand each financial restraint proxy. These interaction terms show the extent to which the effect of budget constraint (each proxy) changes after 2011.
Finally, we include the post2011 statistic, which is the sum of the coefficient of each financial proxy with that of the interaction term between the explanatory variable and the rule dummy. These values capture the effects of each proxy on the use of PPPs after 2011.
4.2.3. Control variables
Given that we have a panel database and are comparing similar municipalities in terms of population features, we first select those financial covariates that vary over time and that could influence both the dependent variable and financial restraint proxies. We consider financial variables that reflect municipalities’ capacity to deal with both the investment’s demand and the balanced budget requirements. The first variable
14. The notation of financial agencies such as Moody’s would be a good measure for a municipality’s financial situation. However, this notation is currently not available for all French municipalities.
15. In our regressions, we use the interaction between the dummy ruletand a trend variable to capture the change in trend
controls for the balancing of the operating and the investment budgets as required by the balanced budget specifications. We use budget≠resultit≠1, which is the difference between the operation≠resultit≠1and the
investment spending of municipality i at t ≠ 1. Finally, we consider two other variables that control for both the size of the investment and the level of the ex ante available resources: investmentit≠1, which captures
the total level of investment by municipality i at t ≠ 1, and subsidiesit≠1, which reflects the level of national
support the municipality received for its investment plans at t ≠ 1.
We then include three political dimensions that may affect the selection of a PPP at the municipal level:
lef tit≠1, centerit≠1, or rightit≠1, which equal one if the mayor of municipality i is from the left (center or
right) wing party at t≠1 and is zero otherwise. The variable femaleit≠1represents the sex of the mayor and
equals one if the mayor of municipality i is female at t ≠ 1 and is zero otherwise. These measures are widely used in the literature to examine organizational choices (see Phuong-Tra, 2014, for a review). In addition, we include the institutional proxy EQI (European Quality of Government Index) at the regional level. This index is the combination of the level of corruption, protection of the rule of law, government effectiveness, and accountability at regional levels in the 27 EU Member States. The measures are collected in 172 EU regions, based on a survey of 34,000 residents across 18 countries (Charron et al., 2014) and controls for the municipality’s institutional aspect.
Finally, we add three variables capturing municipalities’ characteristics: populationit≠1 (the log of the
population of each municipality), incomeit≠1 (the log of the income of each municipality), and firmit≠1
(the log of number of firms in each municipality). When we applied the matching procedure, we had already considered these variables related to year 2009 (and 1999 for population). We further include these covariates in the regressions to control for changes over time in the main municipalities’ characteristics.16
4.3. Empirical strategy
We explore the determinants of a municipality’s decision to use a PPP or to wait before and after 2011, as this year marks the introduction of a new accounting rule into the legal system.
As some municipalities decide to invest after the creation of a PPP market, different investment times are available during the 2004-2013 period. The starting year is the same for every municipality (2004); however, the data are incomplete. Municipalities that did not invest within the period are necessarily right censoring. Duration or hazard models are designed to consider this issue (Machin et al., 2006; Hosmer et al., 1999; Chen, 2002).
Time is the outcome variable of interest in duration or survival analyses. More precisely, the dependent variable is defined as survival time because it provides the interval until a certain event (failure) occurs. The terminology suggests that the main application areas are health and financial economics. However, this
approach can be applied to any type of event that affects individuals in different moments. Our research question is a suitable application of the duration analysis because increasing numbers of municipalities used PPPs during the 2005-2013 period, and we can expect this technique to become even more widespread among public operators over the long run.
In our case, investment action under a PPP represents the event (failure), whereas the survival time is given by the number of years until an investment occurs under a PPP. In such an analysis, we use the entire database comprising both our treated and control groups. Thus, the time is right censoring for all municipalities that do not experience the event prior to 2013.
The introductory step of the survival analysis consists of computing the Kaplan-Meier survival curve,
S(t), and the Hazard rate function, h(t). The first is computed year by year and reports the proportion of
municipalities that survive (do not use PPP) over time. The second gives the instantaneous potential per unit time for the event to occur given the survival up to time t.
The next step enables us to assess the relationship between explanatory variables and survival time. More precisely, it enables us to identify the factors determining the probability of implementing a PPP and examine the impact of the new rule on this propensity to use PPP. We approach the problem through two methods that aim at computing the hazard rate, that is, the instantaneous event rate.
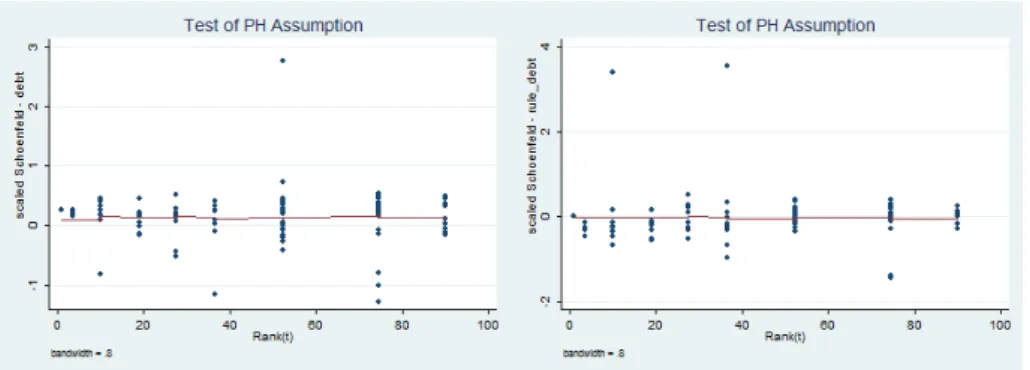
The first is a semi-parametric method: the Cox proportional hazard model. This model makes the major assumption that the hazard rate (instantaneous event rate) is proportional to the covariates (PH assump-tion). This means that the risk of failure (PPP use) is the same regardless of the duration for which the municipality has been followed (Hosmer et al., 1999). This assumption is plausible for our analysis, where the probability to invest in PPP should not depend on how much time has elapsed since 2004, the beginning year of our study. However, we perform a statistical test (stphtest) to assess the PH assumption: we first implement a PH global test that simultaneously controls for all covariates; then, we graphically test the PH assumption for the budget constraint regressors. The main regression for the Cox-Ph model is as follows:
h(t, x, —) = h0(t)f(x, —), (1)
where h0(t) is proportional to the survivor time, while f(x, —) characterizes how the hazard function
changes as a function of our covariates. We include the financial, accounting, and political dimensions pre-viously described as control variables to capture the institutional differences among municipalities affecting the propensity to invest in PPPs. The strategy’s second method comprises implementing a full parametric model where survival time is assumed to follow a known distribution.
We assume the most common Weibull distribution, which is a general distribution based on two parame-ters that can be reduced to an exponential distribution if the hazard is assumed to be constant over time. The hazard rate function that we will estimate through this method is expressed as follows:
h(t, x, —, ⁄) = ⁄t
⁄≠1
(e—0+—1x)⁄ (2)
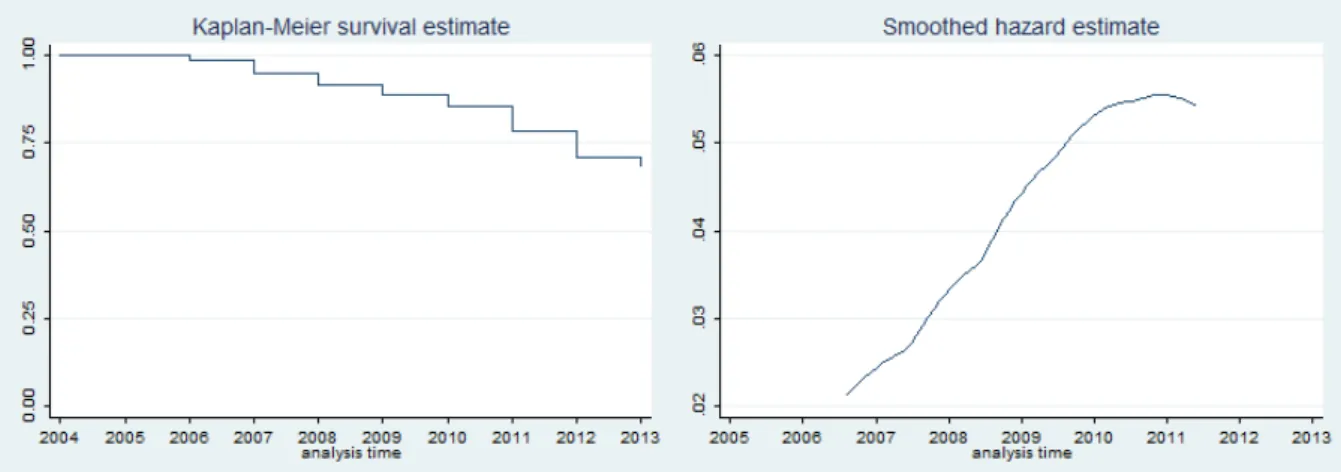
We then run a parametric model for each financial restraint proxy and use as control variables the same covariates we include in the Cox-Ph model. A graphical method for checking the validity of the Weibull distribution is provided by examining the Kaplan-Meier log curves against log survival time. The graph in Figure 2 reports a straight line, thus providing evidence that the distribution of survival times follows a Weibull distribution.
5. Results and robustness checks
5.1. Results
We first report the results of the computation of the Kaplan-Meier survival curve, S(t), and the Hazard rate function, h(t), in Figure 3. The first graph looks like a step function given the discrete time. Prior to 2004, the survival probability equals 1; after this year, some municipalities began to invest. At the end of the time period, the probability of investment is approximately 30%. This result reflects the composition of our dataset, which comprises 101 municipalities with a PPP and 202 control municipalities that did not implement any PPP. The hazard rate function highlights the increasing conditional likelihood to invest under PPP up to year 2011. Subsequently, after the application of the new accounting rule, the line indicates a downward trend.
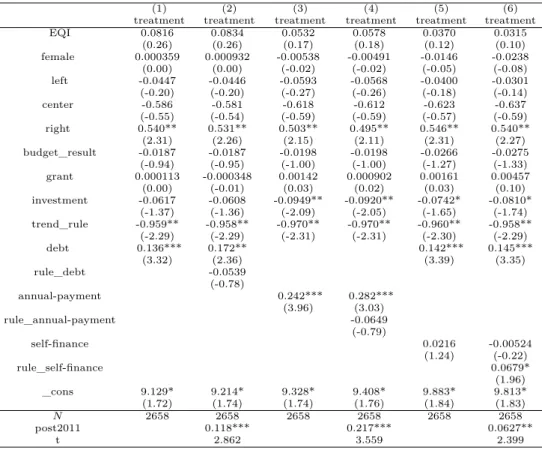
Before presenting the main results of the semi-parametric method under the Cox proportional hazard model, the global test lets us argue that the PH assumption is not violated in the implemented models (last two lines of Table 5). We further control for whether or not the budget constraint proxies separately respect the PH assumption. Figures A1, A2, and A3 in the online appendix report the fitted curves. They appear horizontal, which means that the scaled Schoenfeld residuals are independent with respect to survival time. Our main results of the Cox proportional hazard model are reported in the first six columns of Table 5. We report the hazard ratios to facilitate the economic interpretation of our results. In the online appendix, we show both coefficients and hazard ratios in Table A1.
The first set of variables reports the political features of the municipality. The EQI index (institutional aspect) is positive but not significant. The coefficient of the dummy female is also positive but also not significant. Finally, among the dummies that reflect the political aspects of municipality governments, only the dummy right is significant; thus, when the mayor is from the right side of the political spectrum, the propensity to implement a PPP increases. This result is in line with previous studies on PPP determinants. Among the variables that control for the financial side, budget≠resultit≠1has a positive impact, whereas
affect the propensity to invest in a PPP. In contrast, financial restraints proxies have a significant impact on the propensity to implement PPPs. First, we observe positive and significant effects for debtit≠1 and
annual≠ paymentit≠1 on the use of PPPs, and these persist after 2011.17 Debt positively impacts the
hazard ratio by 18% before 2011 and 14% after 2011, whereas the effect of the annual payment is 31% before 2011 and 26% after 2011. Although the rule was found to have a negative effect, this effect alone was never significant. As a consequence, we can conclude that municipalities have not used PPPs to hide debt, at either the stock or flow level. Second, for the proxy self ≠ financeit≠1 (which captures the municipality’s
self-financing capacity), the rule’s effect becomes significantly positive (a 6.7% increase in the probability that PPPs will be used). This change may be explained by a shift in French municipalities’ behavior. Before 2011, for a given level of debt, the availability of resources for further investment did not affect the propensity to implement a PPP. After the introduction of the rule, a municipality showed a higher tendency to use PPPs only when its budget is balanced, a trait which in itself represents a high self-financing capacity.
The results of the full parametric model, where survival time is assumed to follow a known distribution, are substantially equal to the ones in the Cox proportional Hazard model (last six columns of Table 518).
Indeed, we still found that the levels of debt and annual payments increase the probability of PPP use. These effects remain positive and significant after 2011, whereas the interaction term is not significant. We also found a similar result regarding municipalities’ self-financing capacity. The interaction term rule ≠ self ≠
f inancepositively affects the use of PPPs. This highlights how the presence of internal resources became a
significant argument in favor of PPP investment essentially after 2011.
5.2. Robustness checks
We performed various robustness checks to assess the sensitivity of our results. These are discussed below, and a summary of the main results are reported in Table 6. Detailed tables related to the robustness checks are shown in the online appendix.
matching strategy and time periods issues. We have already shown how the treated and control groups are
similar not only with respect to the matching variables, but also by controlling for population characteristics related to the 2000-2009 time period. We include, as an additional test, all matching variables in our duration regressions. Our results are not substantially affected. A further source of uncertainty remains in the interpretation of the interaction term between the accounting rule and financial restraint proxy. In fact, the policy’s impact can be anticipated or identified with hindsight by public actors. We therefore place the rule at different years and find only non-significant impacts. Furthermore, external factors could exist that influence the trend of the budget constraint proxy but that are also correlated with the PPP dependent
17. The effects after 2011 are reported through the post2011 statistic.
variables. An example would be a financial crisis that could make a PPP investment more costly for the public buyer, especially when the latter is constrained in terms of total available resources (Phuong-Tra, 2014). This effect could overemphasize the rule’s potential impact; therefore, we would be potentially overestimating the extent of debt-hiding motivations and underestimating the relevance of alternative channels. Given that the rule’s impact is already not significant in most specifications, this potential issue does not substantially affect our final findings.
Moreover, to control for the validity of our strategy, in a previous version of the paper we perform a similar analysis using a different control group of municipalities. Our main conclusions still hold showing as our results do not strictly depend on the choice of the control group of municipalities.19
Panel strategy. We propose an alternative empirical strategy in order to check whether our results depend
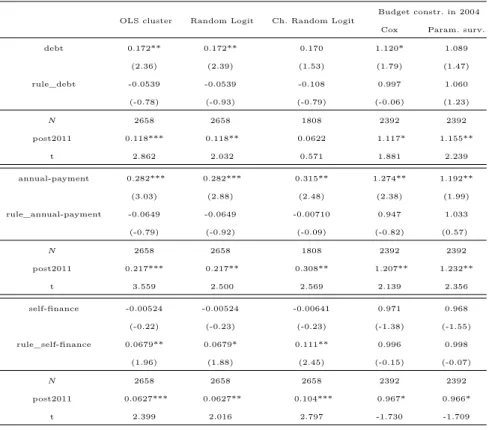
on the adopted specification. We chose to implement a panel strategy with a nonlinear model, where the dependent variable is a dummy that equals 1 if municipality i invests under a PPP during year t. Applying a fixed-effect estimation with a nonlinear model can be problematic. In fact, first differencing or use within transformation does not permit the elimination of unobserved heterogeneity. Moreover, attempts to add municipality or time dummy variables to the logit or probit estimations will result in biased estimators due to the incidental parameters problem unless the time period is very large. A possible solution for this may come from using the traditional random effect probit model. This strategy is appealing, but it assumes that the unobserved components are strictly exogenous and thus independent from our covariates. An alternative approach would be the Mundlack estimation, which assumes an explicit function for the latent variable. This method allows correlation between random effects and regressors and thus permits the marginal effects to be calculated. It can be applied to our full sample and comprises computing a random effect logit or probit estimation, including the average value over time for each of our regressor municipalities. This study first estimates a simple OLS regression with clustered standard errors (by municipality).20 Subsequently,
we implement the Random logit and the Mundlack Random logit approaches.21 The main results are
summarized in Table 6, columns 1, 2, and 3. The clustered standard errors and the random logit estimations substantially confirm the results of the duration analysis. As in the previous regressions, budget constraint effects are relevant both before and after the rule’s application. On the other hand, the new accounting law affects the impact of the self-financing proxy. When the Mundlack approach is followed, although the results for the level of annual payment and self-financing capacity remain unchanged, those for debt level become non-significant both before and after 2011. This last finding can be explained by the persistence of the stock
19. We further apply our duration analyses to the entire population of French municipalities with more than 3,500 inhabitants using our matching variables as controls. Despite the fact that our duration models do not always attain the convergence (a small sample of treated municipalities is compared with a large population of heterogeneous control collectivities), the results of our main specifications are confirmed in terms of signs.
20. Results are reported in Table A3 in the online appendix.
level of debt over time. However, we do not face this problem when using flow instead of stock level proxies for the budget constraint.
Endogeneity problems. Finally, we try to eliminate the debt endogeneity problem by substituting our
fi-nancial constraints with their values in 2004 (before the period of interest). The main results in the form of hazard ratios are summarized in the last two columns of Table 6.22 The results are not substantially
affected, besides the impact of municipalities’ self-financing capacity, which is not significant before or after 2011. We essentially perform this robustness check to test whether stock proxies related to the time of creation of the PPP market (2004) are still significant in explaining the budget constraint effect. When flow proxies are used, this robustness check is less important inasmuch as we cannot really expect that the level of self-financing capacity in 2004 is really relevant in explaining the investment decision, for instance, in 2012.
6. Discussion
This study indicates different results demonstrating the impact of financial restraints on the use of PPP. In addition, we find evidence regarding the persistence of this impact even when off-balance-sheet accounting was no longer possible. The debt-hiding motivation is therefore not the only relevant determinant in explaining why French mayors choose a PPP under conditions of budget constraints.
Some alternative explanations may explain this choice. First, we can also argue that even after the introduction of the decree in 2011, debt-hiding motivations could persist. However, as discussed in the Section 3, this explanation should not be particularly relevant, given the effectiveness of the French decree in ruling out accounting advantages. To back up this argument, we find that the decree shows its effect. In fact, before the rule’s application in 2011, the presence of internal resources was not a determinant of PPP investment. Thereafter, the 2011 decree helped in improving municipalities’ attentiveness regarding their financial situation before an investment decision.
Second, municipalities with high level of budget constraints may use PPPs to “avoid immediate capi-tal expenditure, and related borrowing” (Eurostat, 2004). In fact, while under traditional forms of public procurement an upfront spending is required when the infrastructure is under construction, in the case of PPPs spending is usually spread out over a longtime period. Two explanations are possibles for this beha-vior. The first one is linked to the opportunistic behavior of public actors. As discussed in Section 2.1, a better public accounting in the short term may be interesting for public actors to gain voters’ support in the case of high level of political competition (Phuong-Tra, 2014). Another explanation is more linked to the need for efficiency, as developed by Engel et al. (2013). The idea is that the budget constraints that hit
French municipalities may be temporary liquidity constraints that make current payments more costly than future debt payoffs. In this case, PPPs are preferred to traditional forms of public procurement to enhance municipalities’ current financial situation and obtain better financing conditions in the long term.
Finally, and in relation with the previous argument, under budget constraints, French mayors may consider PPPs as the most efficient organizational choice to minimize financial distortions. Indeed, following Buso (2014), the involvement of private agents during a long time period in PPPs allows public actors to save incentive rents. Decision makers can also benefit from the outsourcing of activities to a better informed private agent as well as from the better control of lending banks (due diligence) over the project’s viability and performance (Auriol and Picard, 2013). In fact, from the empirical literature PPPs are known to have little cost and time overruns (Saussier and Tran, 2013). As a consequence, governments in municipalities with difficult financial situation are under pressure to increase ex-post efficiency, which may also imply the choice of PPP for suitable projects.
7. Conclusions
This study examines whether the use of a PPP by a financially stressed public authority is due to debt-hiding motivations. Initially, we found that budget constraints are associated with higher use of PPPs. However, contrary to the conventional wisdom among practitioners, debt hiding does not explain this effect. Indeed, the decree in 2011, which requires the recognition of PPP on the public account, did not affect the impact of budget constraints on the choice of PPPs. We therefore conclude that debt hiding is not the only motivation for financially stressed municipalities to choose PPPs as an organizational form. In fact, the accounting rule especially shows its effectiveness in linking the PPP choice with internal resources availability.
Our empirical results contribute to the existing literature on PPPs. We not only detected the effect of budget constraints on the use of PPPs but also analyzed the possible motivations that induce budget-constrained public authorities to choose this organizational form. This study is, to the best of our knowledge, the first direct empirical analysis of this topic. We also contribute to the public finance literature, as we found that a large debt burden level is not necessarily connected with a strategy of offloading debt. This is an interesting result in the context of a financial crisis, where governments worldwide are forced to cut budgets, restructure service delivery strategies, reset priorities, and assume enormous new financial responsibilities (Kioko et al., 2011).
This study also has several managerial implications from a practical perspective. First, our study provides an answer to the debate among practitioners about the motivation of using PPPs for circumventing fiscal constraints. Second, our results provide more insight to regulation instances such as the MaPPP. Since debt hiding is not the only motivation for budget-constrained authorities to choose PPPs, the investigation into
the efficiency of the PPP organizational form under public and private financial and fiscal restraints should be developed and expanded. Moreover, we show the effectiveness of the decree in 2011 regarding mayors’ behavior toward more balanced budget considerations when faced to the choice of the best organizational form (self-financing capacity). On the one hand, this finding may help in these instances in improving PPPs’ institutional framework in the future. On the other hand, this result may encourage the private sector to financially participate in PPP projects.
Our results can also partially explain why countries have increasingly turned to PPPs in recent years despite all these criticisms. In fact, a 2009 OECD report stated that PPPs have grown to comprise a portion, although not the majority, of capital budgets in several countries.23This evolution experienced a temporary
decline during the current economic crisis (EPEC, 2012); however, the long-term trend is expected to become positive (Wagenvoort et al., 2010). Our research addresses a very relevant problem in the current situation, where resources are scarce and extensive creativity is needed to incentivize economic growth.
23. The United Kingdom has had the longest experience, with PPPs currently comprising 10% to 15% of the capital budget in recent years. France and Korea have had similar experience, with PPPs comprising 20% and 15% of those countries’ capital budgets, respectively. Portugal reported the highest payments for PPPs, representing nearly 28% of the national budget or 9.4% of GDP; projects could eventually comprise up to nearly 20% of GDP (Posner et al., 2009)
Adams, R., Hermalin, B. E., Weisbach, M. S., 2008. The role of boards of directors in corporate governance: A conceptual framework and survey. Tech. rep., National Bureau of Economic Research.
Albalate, D., Bel, G., Geddes, R. R., 2015. The determinants of contractual choice for private involvement in infrastructure projects. Public Money & Management 35 (1), 87–94.
Auriol, E., Picard, P. M., 2013. A theory of bot concession contracts. Journal of Economic Behavior & Organization 89 (1), 187–209.
Bahl, R., Duncombe, W., 1993. State and local debt burdens in the 1980s: A study in contrast. Public Administration Review, 31–40.
Burns, N., Kedia, S., 2006. The impact of performance-based compensation on misreporting. Journal of financial economics 79 (1), 35–67.
Buso, M., January 2014. The role of financial and information constraints in public private partnerships. Ph.D. thesis, University of Padova, department of economics and management.
Buti, M., Martins, J. N., Turrini, A., 2007. From deficits to debt and back: political incentives under numerical fiscal rules. CESifo Economic Studies 53 (1), 115–152.
CES, 2012. L’investissement public : malgré les difficultés, une priorité. Rapport du Conseil économique, social et environne-mental.
Charron, N., Dijkstra, L., Lapuente, V., 2014. Regional governance matters: quality of government within european union member states. Regional Studies 48 (1), 68–90.
Chen, M.-Y., 2002. Survival duration of plants: Evidence from the us petroleum refining industry. International Journal of Industrial Organization 20 (4), 517–555.
de Bettignies, J., Ross, T., 2009. Public-private partnerships and the privatization of the finance function: An incomplete contracts approach. International Journal of Industrial Organization 27, 358–368.
DeFond, M. L., Park, C. W., 1997. Smoothing income in anticipation of future earnings. Journal of accounting and economics 23 (2), 115–139.
Easterly, W., 1999. When is fiscal adjustment an illusion ? Economic Policy 14 (28), 55–86.
Engel, E., Fischer, R., Galetovic, A., 2013. The basic public finance of public–private partnerships. Journal of the European Economic Association 11 (1), 83–111.
EPEC, 2012. France: PPP units and related institutional framework. PPP Expertise Centre Report.
Eurostat, 2004. Esa 95 manual on government deficit and debt - long term contracts between government units and non-government partners (public private partnerships).
Funke, K., Irwin, T., Rial, I., 2013. Budgeting and reporting for public-private partnerships. Tech. rep., OECD Publishing. Guash, J. L., Laffont, J.-J., Strab, S., 2008. Renegotiation of concession contracts in latin america. evidence from the water
and transport sectors. International Journal of Industrial Organization 26, 421–442.
Hammami, M., Ruhashyankiko, J.-F., Yehoue, E. B., 2006. Determinants of public-private partnerships in infrastructure. International Monetary Fund.
Hart, O., 2003. Incomplete contracts and public ownership: Remarks, and an application to public-private partnerships*. The Economic Journal 113 (486), C69–C76.
Heckman, J. J., Todd, P. E., 2009. A note on adapting propensity score matching and selection models to choice based samples. The econometrics journal 12 (s1), S230–S234.
Hoppe, E. I., Schmitz, P. W., 2013. Public-private partnerships versus traditional procurement: Innovation incentives and information gathering. RAND Journal of Economics 44 (1), 56–74.
Hosmer, D., Lemeshow, S., May, S., 1999. Applied Survival Analysis. Regression Modeling of Time to Event Data. John Wiley&Sons.
Hou, Y., 2006. Budgeting for fiscal stability over the business cycle: A countercyclical fiscal policy and the multiyear perspective on budgeting. Public Administration Review 66 (5), 730–741.
Iossa, E., Martimort, D., 2015. The simple microeconomics of public-private partnerships. Journal of Public Economic Theory 17 (1), 4–48.
Kioko, S. N., Marlowe, J., Matkin, D. S., Moody, M., Smith, D. L., Zhao, Z. J., 2011. Why public financial management matters. Journal of Public Administration Research and Theory 21 (suppl 1), i113–i124.
Legros, P., Dewatripont, M., 2005. Public-private partnerships: contract design and risk transfer. EIB Papers 10 (1), 121–145. Linck, J. S., Netter, J., Shu, T., 2013. Can managers use discretionary accruals to ease financial constraints ? evidence from
discretionary accruals prior to investment. The Accounting Review 88 (6), 2117–2143.
Machin, D., Cheung, Y. B., Parmar, M., 2006. Survival analysis: a practical approach. John Wiley & Sons.
Martimort, D., Pouyet, J., 2008. To build or not to build: Normative and positive theories of public-private partnerships. International Journal of Industrial Organization 26 (2), 393–411.
Martimort, D., Straub, S., forthcoming. How to design infrastructure contracts in a warming world ? a critical appraisal of public-private partnerships. International Economic Review.
Maskin, E., Tirole, J., 2008. Public-private partnerships and government spending limits. International Journal of Industrial Organization 26 (2), 412–420.
Milesi-Ferretti, G. M., Moriyama, K., 2006. Fiscal adjustment in eu countries: A balance sheet approach. Journal of Banking & Finance 30 (12), 3281–3298.
OJEU, 2004. Protocol on the excessive deficit procedure. Maastricht Treaty-Official Journal of the European Union.
Phuong-Tra, T., December 2014. Organizational choice under uncertainty: Four essays on public private partnerships in france. Ph.D. thesis, Sorbonne Business School.
Posner, P., Ryu, S. K., Tkachenko, A., 2009. Public-private partnerships: The relevance of budgeting. OECD Journal on Budgeting 9 (1), 11.
Rosenbaum, P. R., Rubin, D. B., 1985. Constructing a control group using multivariate matched sampling methods that incorporate the propensity score. The American Statistician 39 (1), 33–38.
Rubin, D. B., Thomas, N., 2000. Combining propensity score matching with additional adjustments for prognostic covariates. Journal of the American Statistical Association 95 (450), 573–585.
Russo, F., Zampino, R., 2010. Machiavellian PPP ? Evidence from Italian local government’s projects for public services. In: International Public Procurement Conference, Seoul, South Korea, August. pp. 26–28.
Saussier, S., Tran, P.-T., 2013. L’efficacité des contrats de partenariat en france: une première évaluation quantitative. Revue d’économie industrielle (4), 81–110.
Schmitz, P. W., 2013. Public procurement in times of crisis: The bundling decision reconsidered. Economics Letters 121 (3), 533–536.
Von Hagen, J., Wolff, G. B., 2006. What do deficits tell us about debt ? Empirical evidence on creative accounting with fiscal rules in the EU. Journal of Banking & Finance 30 (12), 3259–3279.
Wagenvoort, R., De Nicola, C., Kappeler, A., 2010. Infrastructure finance in europe: Composition, evolution and crisis impact. EIB papers 15 (1).
Table 1: PS Test
Variable
Treated Control
%bias
t p>t
population_2009 35367 25448 12.5 1.35 0.181 population_1999 33663 24598 12.1 1.28 0.202 area_2009 28626 31886 -3.1 -0.47 0.638 population_2009_men 16976 11728 14.2 1.38 0.169 accomodations_2009 19662 14281 12.9 1.25 0.213 main_residences_2009 16976 11728 14.2 1.38 0.169 second_residences_2009 1240.9 1517.9 -7.2 -0.43 0.667 vacant_accomodations_2009 1444.6 1034.6 11.8 1.24 0.217 owned_residences_2009 6965.3 5266.6 10.9 1.24 0.216
income_2009 4.7e+08 3.3e+08 13.0 1.32 0.189
taxpayers_2009 20678 14983 12.2 1.32 0.190 workers_2009 20195 14291 15.8 1.25 0.215 long_term_workers_2009 18327 13000 15.9 1.23 0.222 workers_1999 17857 12670 15.6 1.22 0.223 population_15-64_2009 23938 16610 14.0 1.41 0.159 unemployed_15-64_2009 2419 1658.1 13.3 1.43 0.155 employed_15-64_2009 16637 11732 14.0 1.38 0.169 total_firms_2010 3471.8 2432.9 12.8 1.34 0.181 agriculture_firms_2010 46.94 37.58 15.8 0.93 0.354 industry_firms_2010 155.95 118.12 11.6 1.25 0.214 construction_firms_2010 241.12 194.08 6.6 0.94 0.346 services_firms_2010 2466 1717.9 13.1 1.31 0.192 trade_firms_2010 702.65 536.27 10.7 1.09 0.279 public_firms_2010 561.76 365.2 14.3 1.52 0.131 SMEs_2010 998.84 706.87 13.7 1.34 0.183 No_SMEs_2010 268.11 196.87 14.4 1.19 0.235
Table 2: PS Test pre 2009
Variable
Treated
Control
% bias
t p>t
taxpayers_08 26544 23728 3.3 0.24 0.808
net_income_08 5.8e+08 6.4e+08 -2.3 -0.16 0.874
total_tax_08 3.4e+07 5.5e+07 -6.1 -0.42 0.673
taxable_income_08 4.7e+08 5.5e+08 -3.2 -0.23 0.821
notaxable_income_08 1.1e+08 9.2e+07 6.6 0.51 0.611
taxpayers_07 26398 23598 3.3 0.24 0.808
net_income_07 5.7e+08 6.3e+08 -2.4 -0.17 0.867
total_tax_07 3.7e+07 5.9e+07 -6.0 -0.42 0.678
taxable_income_07 4.6e+08 5.5e+08 -3.3 -0.23 0.818
notaxable_income_07 1.0e+08 8.5e+07 7.0 0.54 0.591
taxpayers_06 26198 23445 3.3 0.24 0.810
net_income_06 5.4e+08 6.0e+08 -2.3 -0.16 0.873
total_tax_06 3.5e+07 5.5e+07 -6.0 -0.41 0.680
taxable_income_06 4.4e+08 5.2e+08 -3.2 -0.23 0.821
notaxable_income_06 1.0e+08 8.6e+07 6.7 0.51 0.610
taxpayers_05 25780 23239 3.0 0.22 0.823
net_income_05 4.2e+08 4.7e+08 -2.4 -0.17 0.864
taxpayers_04 25755 23259 3.0 0.22 0.827
net_income_04 4.1e+08 4.6e+08 -2.6 -0.18 0.856
taxpayers_03 25594 23261 2.8 0.20 0.839
net_income_03 4.0e+08 4.5e+08 -2.6 -0.18 0.854
taxpayers_02 25277 23001 2.7 0.20 0.841
net_income_02 3.8e+08 4.3e+08 -2.6 -0.18 0.855
taxpayers_01 24883 22830 2.5 0.18 0.855
net_income_01 3.6e+08 4.2e+08 -3.1 -0.22 0.826
taxpayers_00 24514 22288 2.8 0.20 0.840
net_income_00 3.5e+08 4.1e+08 -3.0 -0.21 0.833
taxpayers_99 24184 22021 2.7 0.20 0.843
net_income_99 3.4e+08 3.9e+08 -3.0 -0.21 0.834
taxpayers_98 23890 21870 2.6 0.19 0.852
Table 3: Panel Dataset Description Treated Control 101 obs 202 obs P P P≠ amount 32.3 0 Annual≠ investment 26.2 29.9 Operation≠ result 4.8 5.5 Overall≠ result 4.7 5.9 Debt 63.6 45.2
Annual≠ debt ≠ payment 9.3 5.6
Subsidies 24.4 21.6
T abl e 4: Definition of variables and ex pect ed result DI ME NSI ON V AR IABL E DE FI NI TI ON E XP E CTE D RES UL T DE P E ND ANT V AR IABL E S ppp it Equ al s to 1 if m un ic ip al it y ia lr ea dy in ve st in PF I/ C P at ti m e t IND EPEND ANT V ARIAB LES (a ll va ri ab le s ar e de fin ed as di fference with the av erage of th e ref erence group) Budget constrain t debt it ≠ 1 Equ al s to th e lo g of de bt am ou nt of ea ch mu ni ci pa lit y at ti m e t-1 + an n ual ≠ pa y ment it ≠ 1 Equ al s to th e lo g of de bt an nu it y of ea ch m un ic ip al it y at ti m e t-1 + sel f ≠ fi n a n ceit ≠ 1 Equ al s to th e lo g of th e ca pa bi lit y of se lf fin an ci ng at t-1 -Le ga lc ha ng e ru let Equ al s to 1 si nc e 20 11 ;0 ot he rw is e -ru let ú debt it ≠ 1 In te ra ct io n be tw ee n th e va ri ab le ru le an d de bt -ru let ú an n ual ≠ pa y ment it ≠ 1 In te ra ct io n be tw ee n the va ri ab le ru le an d an nu it y -ru let ú sel f ≠ fi n a n ceit ≠ 1 In te rac ti on be tw ee n th e va ri ab le ru le an d C AF ne t + Demand side popul a tion i Equ al s to th e lo g of th e po pu la ti on of ea ch m un ic ip al it y inc ome i Equ al s to th e lo g of on co m e of ea ch m un ic ip al it y fi r mi Equ al s to th e lo g of nb .o f fir m Supply side Bu d g et ≠ re su lt sit ≠ 1 Equ al s to th e lo g of th e bu dg et re su lt of m un ic ip al it y ia t t-1 Gr a nts it ≠ 1 Equ al s to th e lo g of th e su bv en ti on s of m un ic ip al it y ia t t-1 In v es tm en tit≠ 1 Equ al s to th e lo g of th e in ve st m en t of m un ic ip al it y ia t t-1 -Po lit ic al va ri ab le s fe m a leit ≠ 1 Equ al s to 1 if th e m ay or at t-1 is a w om en le f tit≠ 1 Equ al s to 1 if th e m ay or at t-1 is fo rm th e le ft wing part y -cen ter it ≠ 1 Equ al s to 1 if th e m ay or at t-1 is fo rm th e ce nt er part y ri g h tit≠ 1 Equ al s to 1 if th e m ay or at t-1 is fo rm th e ri gh t wing part y + Others EQ Ii Equ al s to th e Eu ro pe an Q ua lit y of Re gi on Go ve rn m en t In de x