HAL Id: halshs-00586826
https://halshs.archives-ouvertes.fr/halshs-00586826
Preprint submitted on 18 Apr 2011
HAL is a multi-disciplinary open access
archive for the deposit and dissemination of sci-entific research documents, whether they are pub-lished or not. The documents may come from teaching and research institutions in France or abroad, or from public or private research centers.
L’archive ouverte pluridisciplinaire HAL, est destinée au dépôt et à la diffusion de documents scientifiques de niveau recherche, publiés ou non, émanant des établissements d’enseignement et de recherche français ou étrangers, des laboratoires publics ou privés.
Never the same after the first time: The satisfaction of
the second-generation self-employed
Andrew E. Clark, Nathalie Colombier, David Masclet
To cite this version:
Andrew E. Clark, Nathalie Colombier, David Masclet. Never the same after the first time: The satisfaction of the second-generation self-employed. 2008. �halshs-00586826�
WORKING PAPER N° 2008 - 14
Never the same after the first time:
The satisfaction of the second-generation self-employed
Andrew Clark Nathalie Colombier
David Masclet
JEL Codes: J20, J21, J23, J24
Keywords: satisfaction, self-employment, parents, intergenerational comparisons
P
ARIS-
JOURDANS
CIENCESE
CONOMIQUESL
ABORATOIRE D’E
CONOMIEA
PPLIQUÉE-
INRA48,BD JOURDAN –E.N.S.–75014PARIS TÉL. :33(0)143136300 – FAX :33(0)143136310
www.pse.ens.fr
Never the Same After the First Time: The Satisfaction
of the Second-Generation Self-Employed
Andrew Clark*, Nathalie Colombier and David Masclet March 2008
Abstract
Previous empirical work has shown that the self-employed are generally more satisfied than salaried workers. This paper contributes to the existing literature in two ways. First, using French data from the ECHP and British data from the BHPS, we investigate the domains over which this differential operates. We show that, after controlling for occupation, self-employed workers are generally more satisfied with working conditions and pay, but less satisfied than employees with respect to job security. We then consider the differences between the first- and second-generation self-employed. The first-generation self-employed (those whose parents were not self-employed) are more satisfied overall than are the second-generation self-employed. We argue that this finding is consistent with the self-employed partly comparing their labor market outcomes with those of their parents, as well as parental transfers which loosen the self-employment participation constraint. This result is found in both pooled and panel analysis.
KEY WORDS: Satisfaction, Self-employment, Parents, Intergenerational comparisons JEL CLASSIFICATION: J20, J21, J23, J24
Andrew Clark: Paris School of Economics and IZA. PSE: 48, Boulevard Jourdan 75014 Paris, France. Tel : +33 143 13 63 29. Email: [email protected]
Nathalie Colombier: CREM, 7 place Hoche 35065 Rennes, France, Tel: +33 (0)2 23 23 35 60. Email: [email protected]
David Masclet: CNRS and CREM, 7 place Hoche 35065 Rennes, France, and CIRANO, Montreal, Canada. Tel: +33 (0)2 23 23 33 18. Email: [email protected]
* Corresponding Author. The BHPS data were made available through the ESRC Data Archive. The data were originally collected by the ESRC Research Centre on Micro-social Change at the University of Essex. Neither the original collectors of the data nor the Archive bear any responsibility for the analyses or interpretations presented here. We are grateful to Andrew Oswald for suggestions. Thanks to Billy Bragg for part of the title (Lovers Town Revisited: “And though it’s never the same after the first time, that doesn’t stop them coming
Never the Same After the First Time:
The Satisfaction of the Second-Generation Self-Employed
1. Introduction
One of the most consistent findings in the literature on employment is that the self-employed earn less than comparable salaried workers (Lazear and Moore, 1984; Carrington et
al., 1996; Hamilton, 2000). For example, using 1984 data from the Survey of Income and
Program Participation (SIPP) panel, Hamilton (2000) estimates that, at a given level of work experience, the self-employed earn 19% less than employees. Carrington et al. (1996) report similar results. However, whilst the financial aspects of work likely constitute an important part of the decision to become self-employed, non-pecuniary aspects of the job, such as being one’s own boss and the degree of autonomy, may well make up for lower earnings (Hamilton, 2000).
To bring the varied aspects of the job together, some authors have proposed the use of self-reported job satisfaction as a subjective summary measure of the utility from labor-market choices.1 Perhaps the second most consistent finding in the literature is that, despite any income differences, the self-employed are more satisfied with their jobs than are employees (Clark and Senik, 2006; Kawaguchi, 2006; Bradley and Roberts, 2004; Falter,
1 The analysis of subjective measures such as life or job satisfaction has recently become a part of mainstream
micro-economic analysis (e.g. Freeman, 1978). Economists sometimes hesitate to use subjective job satisfaction measures, due to doubts about their relationship to underlying utility. However, labour economists have made significant efforts to incorporate such satisfaction measures into economic analyses of labor market outcomes (see the surveys in Frey and Stutzer, 2002, and Clark et al., 2008).
2004; Frey and Benz, 2003; Blanchflower et al., 2001; Blanchflower and Oswald, 1998; Thompson et al., 1992; Naughton, 1987).2
The aim of this paper is two-fold. We first contribute to the debate on the quality of employment and self-employment by considering not only overall job satisfaction, but also a number of domain satisfaction measures. While, self-employment may be overall more satisfactory, some aspects such as job security may be perceived as less attractive (Lewin-Epstein and Yuchtman-Yar 1991; Buttner 1992; Kaufmann 1999). By way of contrast, the greater autonomy associated with self-employment will probably translate into greater satisfaction with working conditions.
Our second, and perhaps more substantive, contribution is to consider that the self-employed are not all necessarily the same. Specifically, we ask whether the second-generation self-employed (i.e. those whose parents were also self-employed) are more or less satisfied at work than the first-generation self-employed. There are three contrasting reasons why such differences may occur. First, the second-generation self-employed will likely often have received intergenerational transfers (of financial capital, or career-specific and general managerial skills) and thus may be more successful than first-generation self-employed workers who did not receive such transfers. However, it could be argued that some of those who follow their parents in their occupation may have felt constrained to do so, so that their self-employment does not necessarily reflect their ideal career choice. In addition, following Blanchflower and Oswald (1998), transfers from parents, whether of capital or know-how,
2 Self-employment is, however, associated with lower satisfaction in Latin American countries (Graham and
Pettinato, 2002).Other measures of subjective well-being also produce different correlations. In Clark and Oswald (1994), the self-employed generally report higher stress scores, using a medical measure of psychiatric health (the GHQ-12), than do employees. The same inversion between satisfaction and stress scores can be noted for women (Nolen-Hoeksema and Rusting, 1999).
might be thought to slacken the participation constraint. Loosely speaking, such transfers allow some individuals who are not particularly cut-out for employment to become self-employed. This mixture of increased resources, potential constraint, and participation produces an overall effect of indeterminate sign.
A separate argument revolves around the idea that individuals do not only consider their own situation in an absolute sense, but compare their situation with that of their reference group, where this latter may include their relatives, and in particular their parents. If this is so, and under the typical finding that the self-employed are more satisfied than are employees, the first-generation self-employed may be more satisfied than the second-generation self-employed, since the former compare their situation to their salaried (or at least non self-employed) parents while the latter compare themselves to self-employed parents.
Only relatively little work in the nascent well-being literature in Economics has considered how individual well-being relates to the income of other family members, and in particular whether there is any role for household comparisons. Clark (1996) uses BHPS data to relate individual job satisfaction, conditional on own wage, to the wages of their partners and the average wage of other household members. The results show that individuals do indeed report lower job satisfaction scores the higher are the wages of other workers in the household.
McBride (2001) also introduces a family benchmark, appealing to the following question in the 1994 GSS: “compared to your parents when they were the age you are now,
do you think your own standard of living now is: much better, somewhat better, about the
same, somewhat worse, or much worse?”. Regression analysis showed that the respondent’s
happiness was significantly positively correlated with doing better than one’s parents, conditional on the level of the respondent’s actual income.
Boes et al. (2007) are able to directly measure parents’ income in recent waves of the German Socio-Economic Panel, by matching younger respondents who have moved away from home (and thus constitute new panel households) to their parents (who continue as panel members). They show that respondents’ financial satisfaction increases with own income, as expected, but is negatively correlated with parents’ income, consistent with the existence of an intergenerational externality.
We do not expressly consider these kind of income comparisons, but rather the broad effects of parents’ labor force status in the context of self-employment. Our results on British and French panel data show first that the self-employed are indeed more satisfied than salaried workers. A more detailed analysis of the different job satisfaction domains shows that the self-employed report greater satisfaction with pay and working conditions, but are less satisfied with job security.
However, the self-employed are not all the same: the second-generation self-employed are less satisfied with their jobs overall than are the first-generation self-employed. This applies also to satisfaction with pay and satisfaction with the work itself. This is consistent with transfers from parents allowing less apt children to become self-employed, and with constrained choice by the children. It is also consistent with children comparing themselves to their parents, so that job satisfaction is partly relative.
The remainder of the paper is organized as follows. Section 2 presents the data and establishes that the self-employed are more satisfied with their jobs than are the employed. Section 3 then splits up the self-employed according to their parents’ labor-force status, showing that the least satisfied are those with at least one parent who was also self-employed. Section 4 concludes.
2. Self-employment and Job Satisfaction
2.1. Descriptive Analysis
The analysis of job satisfaction is based on panel data from the British Household Panel Survey (BHPS) and the French component of the European Community Household Panel (ECHP). In both surveys, all adults in the household are interviewed separately with respect to their socio-demographic characteristics, income, employment, and health. The British Household Panel Survey is an annual panel which initially consisted of around 10 000 individuals in around 5 000 different households in Great Britain; increased geographical coverage has pushed these figures to around 16 000 and 9 000 in more recent waves. We here make use of data from the first fifteen waves (1991-2005). Further details of this survey are available at the following address: http://www.iser.essex.ac.uk/ulsc/bhps. The French data come from the eight waves of the French component of the ECHP, which was run annually from 1994 to 2001, this has broadly similar numbers of individuals and households per year as the latter waves of the BHPS. Details of the ECHP are available at http://forum.europa.eu.int/irc/dsis/echpanel/info/data/information.html.
Our key variable is job satisfaction, which we take here to be a proxy measure of the utility from work. In the BHPS, all employees are asked about their satisfaction with seven aspects of the job (Promotion Prospects, Total Pay, Relations with Boss, Security, Use of Initiative, Work Itself, and Hours Worked). All of these are measured on a scale of one to seven, where 1 means completely dissatisfied and 7 means completely satisfied. These are followed by the question “All things considered, how satisfied or dissatisfied are you with
your present job overall using the same 1-7 scale”? The self-employed are asked about five
aspects of the job (the same list as above, less Promotion Prospects and Relations with Boss, which are largely inapplicable here), followed by the same summary question.
In the ECHP, job satisfaction is measured on a six-step ladder, going from not satisfied at all to very satisfied. Job satisfaction is part of a general series of satisfaction questions formulated as follows: “Could you indicate, on a scale going from 1 -“not satisfied at all”- to
6 -“very satisfied”- your degree of satisfaction concerning each of the following items: your
job or main occupation; your financial situation; your housing; your health; your time
available for leisure; your social contacts; and your past education”? In the job part of the
questionnaire, another set of questions related to satisfaction with various aspects of the job are asked in a similar way: “Could you indicate, on a scale going from 1 -“not satisfied at
all”- to 6 -“very satisfied”- your degree of satisfaction concerning each of the following
items: labor income; job security; number of working hours; work schedule; type of activity;
working conditions; and commuting distance”? These labor-related questions are asked of all
those active in the labor market, independent of their status.
We restrict our sample in both datasets to those who are self-employed or employees, and only consider those who are aged between 16 and 65. In both datasets, workers are counted as self-employed if they answered “Yes” to a direct question on self-employment. These restrictions reduce the ECHP sample over eight waves to 50579 observations, with 5871 observations (11.6% of the sample) on the self-employed. In the fifteen waves of the BHPS, we retain 103 504 observations, with 11 996 on the self-employed, again representing 11.6% of those who are in employment.
[Table 1 about here]
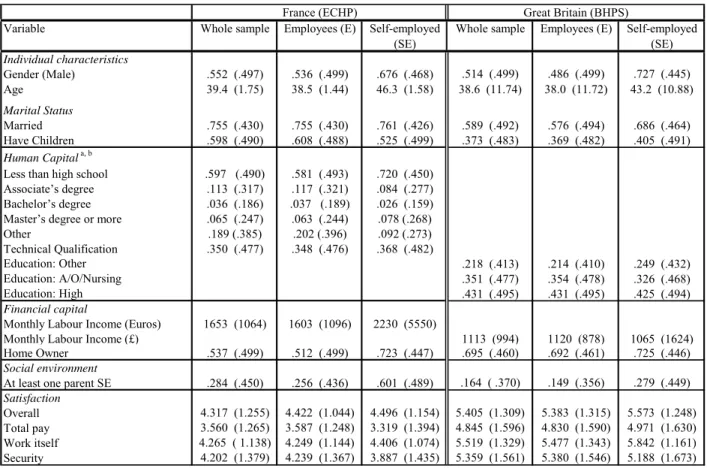
Table 1 presents summary statistics for our key variables in both datasets. The first three columns show figures for respectively all of those who work, employees, and then the self-employed in the eight waves of the ECHP data; columns 4-6 repeat the procedure for the fifteen waves of the BHPS. Table 1 reveals that the self-employed are older, and more likely
to be men. They are also generally less-educated than employees: in the ECHP, 72% of the self-employed have less than a high-school degree, against 58% of employees. However, the self-employed are a little more likely to have a Masters degree. The same broad pattern is found in the BHPS. Table 1 also shows that the self-employed are more likely to be property owners, especially in France. The self-employed have higher incomes than employees in France, but not in Great Britain.3 This is due to the presence of what are known as the “professions libérales” amongst the French self-employed (for example, Doctors and Lawyers). In fact, ten per cent of the self-employed in the French data earn more than 6 800 Euros per month.
Our key right-hand side variable here is the labor force status of the individual’s parents. In the BHPS, this is measured by a series of two questions. All individuals are asked “Thinking back to when you were 14, what job was your father doing at that time”? Those who reported that their father was working are then asked “Was he (your father) an employee
or self employed”? An analogous question is asked with respect to the respondent’s mother.
We create a dummy variable for the individual having at least one parent self-employed. The situation in the ECHP is a little different. Here individuals are asked to report the most recent occupation of their father and mother. This can potentially change from wave to wave for younger respondents whose parents are still active in the labor market.
The figures towards the bottom of Table 1 show that, perhaps unsurprisingly, the self-employed are more likely than employees to have a self-self-employed parent: in France, 60% of
3 There are two sources of income information in the French ECHP data. First, individuals are asked in October
of each year between 1994 and 2001 about their personal income at the interview date. Second, individuals were also asked every year to retrospectively state their annual income over the past year (e.g. in 2000 for the survey conducted in 2001). As the second measure prevents us from using 2001 data, we use the first measure, expressed as monthly income. In the BHPS, the derived income variable refers to labor income last month, expressed in real 1991 terms. Those who reported non-positive self-employment earnings were excluded from the analysis (Evans and Jovanovic, 1989).
the self-employed have at least one self-employed parent, as opposed to only 26% of employees. In Great Britain, the analogous figures are 28% and 15%.4
Finally, the bottom panel of Table 1 presents the mean scores of the four different satisfaction measures that we consider. In the raw data, the self-employed report higher satisfaction scores with respect to the work itself, but lower satisfaction regarding security. The situation with respect to pay satisfaction is mixed. In France, the self-employed are less satisfied with their pay, whereas the reverse holds in Great Britain. However, in both countries the self-employed report higher overall job satisfaction on average than do employees.
2.2. Estimates of Job satisfaction
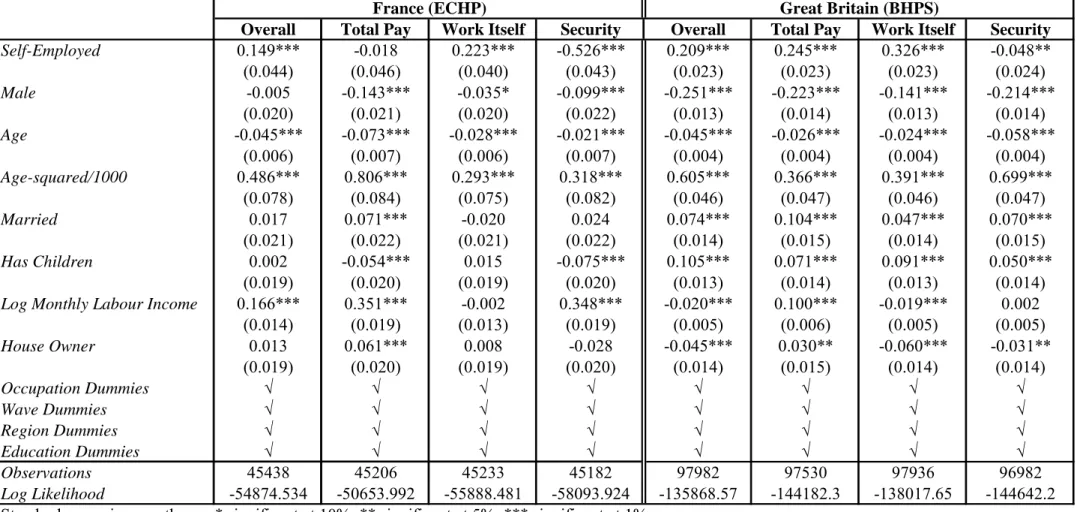
The first stage of our investigation relates the various job satisfaction measures in Table 1 to a standard set of demographic characteristics (including education, gender, age and marital status). We also control for the individual’s occupation. The variable we are most interested in is a dummy variable indicating whether the individual is self-employed. The equations are estimated by ordered probit techniques, with standard errors that are clustered at the individual level.
[Table 2 about here]
Columns 1 and 5 in Table 2 show the estimates for overall satisfaction in France and Britain respectively. In both countries the self-employed are more satisfied with their jobs
4 The fact that 28% of respondents have at least one self-employed parent, whereas the current self-employment
rate is under 12%, reveals that the rate of self-employment must have fallen in France. Marchand (1998) describes the post-War growth in French salaried employment, due to the shift away from Agriculture and increased female labor-force participation.
overall, conditional on the other control variables. As noted in Section 1, this is consistent with the results in a number of existing pieces of work. The remaining columns of Table 2 add detail by showing the correlation between self-employment and various types of domain satisfaction. In both countries the self-employed are more satisfied with the work itself, but less satisfied with job security. In Great Britain, the self-employed are more satisfied with their pay, but no significant effect is found for this domain in France.
The estimated coefficients on the other control variables are fairly standard. Men mostly report lower levels of job satisfaction than do women in both countries (Clark, 1997, Sousa-Poza and Sousa-Poza, 2000), and there is a U-shaped relationship between age and all measures of job satisfaction (Clark et al., 1996). While the marriage and children satisfaction “premia” are seemingly well-defined in Great Britain, there are no robust effects in France. The estimated coefficient on log income is mostly positive and significant in France, but less so in Great Britain. In neither country is higher income associated with greater satisfaction with the work itself, perhaps suggesting some kind of compensating differential. In both countries, homeowners are more satisfied with their total pay, but less satisfied with their job security.
Overall, the regression results in Table 2 mostly confirm a number of existing results in the satisfaction literature, although the estimates on domain satisfaction are more novel. Our main interest in this paper is to underline that the broad results that appear in this Table might actually obscure sharp differences between different groups of the self-employed. We concentrate in particular on the first- and second-generation self-employed. As discussed above, the net effect of the transfers received by the second-generation self-employed and the potential constraint of following their parents is ambiguous. The next section brings regression analysis to bear on the question, and shows that the second-generation
self-employed are in fact systematically less satisfied at work than are their first-generation counterparts.
3. The First- and Second-Generation Self-Employed
This section investigates whether, ceteris paribus, second-generation entrepreneurs are happier than those of the first generation. There are a number of potential differences between the two groups of self-employed. A by now fairly substantial body of previous work has emphasized that the observed intergenerational correlation in type of work may reflect transfers from parents (Colombier and Masclet 2007, 2008; Hundley, 2006; Parker 2004; Dunn and Holtz Eakin, 2000; Blanchflower and Oswald, 1998; Laferrère and McEntee, 1996; Taylor, 1996; Lentz and Laband, 1990; de Wit and van Winden, 1989; Carrol and Mosakowski, 1987; Cooper and Dunkelberg 1986; Lindh and Ohlsson, 1986).5 These parental transfers may be financial or of informal human capital reflecting some kind of know-how. The broad consequence of these transfers will likely be to relax capital-market constraints and increase the probability of children’s success in self-employment. We may therefore expect the second generation, who are perhaps then more successful, to be more satisfied than the first generation self-employed. However, it can also be argued that parents’ transfers will reduce self-employment rents analogously to the role played by inheritances in the National Child Development Survey data analyzed by Blanchflower and Oswald (1998).
5 A number of these papers have focused on the influence of the parents' activity, showing that individuals whose
parents are self-employed were more likely to become themselves self-employed. Dunn and Holtz-Eakin (2000) note that parents' financial capital has a positive effect on children’s transition into self-employment; Hundley (2006) explores how family background influences the type of employment, revealing effects of both entrepreneurial and economic inheritance.
On a somewhat different note, it can be argued that the second generation may be less satisfied than the first generation self-employed if the former are to an extent obliged to follow in the footsteps of the latter.6 Finally, we can appeal to the broad idea of comparisons, and consider that individuals compare their labor market situation (not only in terms of income, but also status and job) to the types of jobs occupied by others in the family, and in particular to their parents. Climbing up the social ladder (from the rung that the parents occupied) can therefore lead to higher job satisfaction, while in contrast a fall in social status relative to one’s parents may reduce job satisfaction. For all of these reasons we expect the first- and second-generation self-employed to report different satisfaction levels.
3.1. Differences between the First- and Second-generation Self-employed
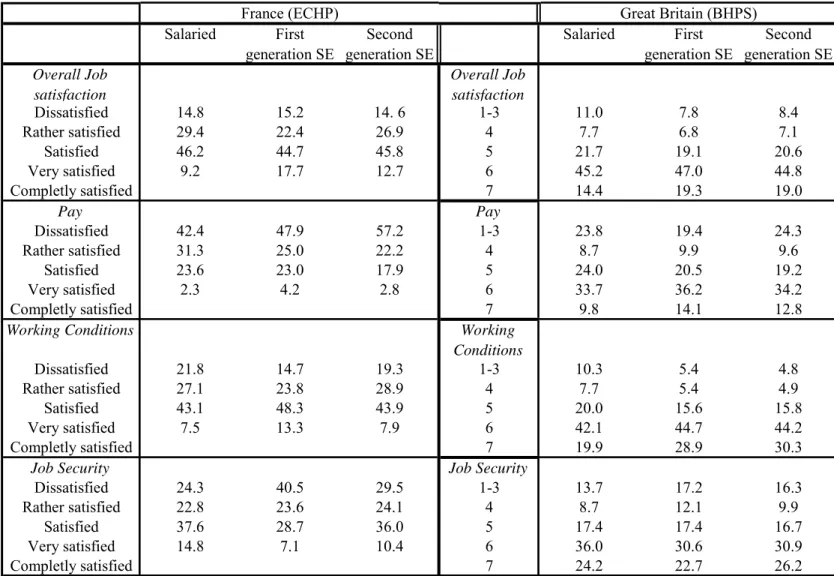
Table 3 provides some preliminary information about the distribution of satisfaction between the employed and the first- and second-generation self-employed. Due to the relatively few individuals who report very low satisfaction levels, we have grouped the first three cells together in both datasets, producing satisfaction scales that run from 6 for the ECHP, and 3-7 for the BHPS.
[Table 3 about here]
The distribution of satisfaction in Table 3 first broadly confirms that employees are less satisfied than are the self-employed. In addition, it highlights that, for most of the satisfaction measures, the second-generation self-employed seem to do less well than the first-generation self-employed. For example, while only 9% of French employees are very satisfied (the highest category), the corresponding figures are 18% for the first-generation and 13% for
the second-generation self-employed. The same broad data shape also applies to overall job satisfaction in Great Britain.
With respect to domain satisfaction, the self-employed are more satisfied than employees with both pay and working conditions, but again with the first-generation self-employed reporting the highest numbers. In contrast, the self-self-employed are less satisfied than employees with respect to job security, and here the first-generation self-employed report the lowest satisfaction scores.
Table 3 thus suggests higher job satisfaction for the newly self-employed, with respect to both overall job satisfaction and to pay and working conditions, and lower satisfaction with job security for the newly self-employed. These preliminary results are consistent with the idea that individuals compare their current situation with that of their parents. Since the self-employed are overall more satisfied than employees, it makes sense that those whose parents are employees report greater satisfaction compared to second generation self-employed workers: the former are doing better relative to their parents. In contrast, second generation workers report higher relative satisfaction with respect to job security since they are less likely to compare their situation with that of employees and are used to lower levels of job security.
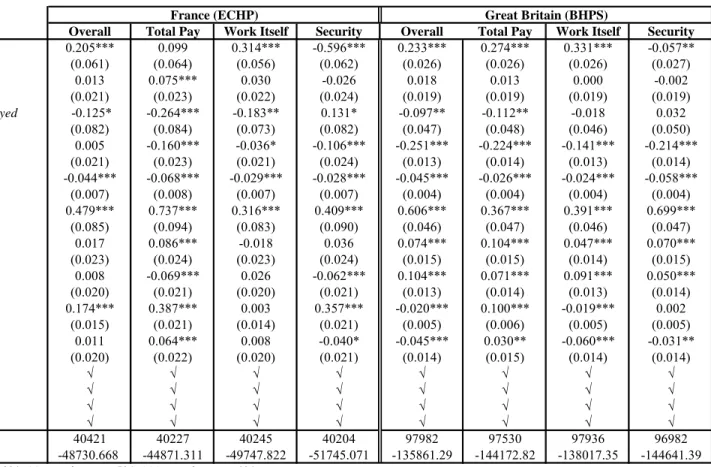
It is of course possible that some of the observed differences between the first- and second-generation self-employed reflect different income, hours, occupations, and so on. Table 4 shows the results of regression estimation of the various satisfaction measures, distinguishing between the first- and second-generation self-employed. The explanatory variables include all of the variables from Table 3, as well as a dummy variable for having at least one self-employed parent ("Mother or Father Self-Employed"), and the interaction between own and parents’ self-employment status ("Self-Employed and Mother or Father
Self-Employed"). The estimated coefficient on this latter shows how the first- and
second-generation self-employed differ.
[Table 4 about here]
The results are quite remarkably similar across the two datasets. In both France and Great Britain, the first-generation self-employed are significantly more satisfied than are employees (as shown by the estimates on the “Self-Employed” variable) both overall and with respect to the work itself; they are less satisfied with respect to job security. In the BHPS data, the first-generation self-employed are more satisfied with their pay than are employees; in the French ECHP data, the relevant estimated coefficient is also positive, but is not significant.
The difference between the first and second-generation self-employed is revealed by the coefficient on the interaction variable, the third in Table 4. This is significant in six out of the eight regressions. Perhaps more importantly, it is systematically of the opposite sign to the main self-employed effect. Whatever the first-generation self-employed like about their job, the second generation like less; whatever the first-generation self-employed dislike about their job, the second generation dislike less. Greater success, or looser participation constraints, would imply coefficients on the interaction variable of one sign only. The symmetric mean reversion in Table 4 is consistent with parents acting as a reference group.
3.2. Panel Results
Both of our datasets are panel. As such, they allow us to control for individual fixed effects. Heuristically, we consider the change in job satisfaction when the individual moves from employment to self-employment, or vice versa.
While this is a useful exercise, it does have some limitations. The ordered probit estimates in Table 4 described the distribution of well-being for all those who we observed to
be self-employed. Panel analysis will drop those who do not change labor force status. The coefficient on self-employment is identified by “movers”, so in some sense we are considering only the more ephemeral self-employed here. In particular, those who have always worked in their parents’ business will not appear in panel estimation. This restriction probably applies particularly to the ECHP data, which only covers eight years.
Table 5 presents the panel results, from conditional fixed effect logit estimation. The dependent binary variable equals 1 if satisfaction is over 4 in the ECHP, and over 5 in the BHPS. The results with respect to the first-generation self-employed (the estimates on the first variable, “Self-Employed”) are very similar to those in the pooled cross-section analysis of Table 4. The variable showing whether at least one parent was self-employed attracts a coefficient in the French data, as it varies over time (although none of the estimates are significant). As in Table 4, the variable that interests us the most is the third, which shows any differences between the first- and the second-generation self-employed. This is negative for three out of the four satisfaction measures in the French ECHP data, showing the second-generation self-employed to be less satisfied than the first-second-generation self-employed, but is only significant for satisfaction with pay. It is possible that these weaker panel results in France result from the relatively short time span of the ECHP data, with the associated reduction in the number of individuals who transit between employment and self-employment.
The situation in the BHPS is different. Here three out of the four estimates on the interaction variable are negative and significant. This shows that those who move from employment to self-employment with a self-employed parent will experience less of a
satisfaction boost than will those with non self-employed parents.7 These results are consistent with comparison to parents, and with a loosening of participation constraints for the children of the self-employed, with an associated reduction in rents.
4. Conclusion
This paper has used British and French panel data to bring together two separate topics in the growing literature in the Economics of Happiness. The first concerns relative utility and comparisons to others, and the second the ubiquitous finding that the self-employed report higher levels of job satisfaction than do employees.
We introduce relative utility into self-employment by suggesting that individuals might compare their own labor market experience with that of their parents. Both the British BHPS and the French part of the ECHP contain information on parents’ labor force status (measured when the respondent was aged 14 for the former, and the most recent for the latter). If utility is relative, then self-employment should seem better if my parents were not self-employed themselves.
Both the British and the French data suggest that this is indeed the case: the first-generation employed are significantly more satisfied than are the second-first-generation self-employed. This is consistent with comparisons to parents, but also with transfers from parents relaxing the self-employment participation constraint, so that some of the associated rent dissipates, reminiscent of Blanchflower and Oswald’s finding that the self-employed who had received inheritances were no more satisfied than were employees.
7 There is no estimate on the variable “Mother or Father Self-Employed” in the BHPS panel regressions, as this
Considering some of the separate domain satisfactions provides one small piece of evidence in favor of the comparisons, rather than rent dissipation, interpretation. With respect to both pay and the work itself, the same pattern is found as for overall job satisfaction: the first-generation self-employed are more satisfied, but the second-generation less so. The difference occurs with respect to job security, where the second-generation self-employed are actually more satisfied than the first-generation (although only significantly so in the French data). While a number of different explanations are possible, this is at least consistent with individuals evaluating their own labor force status relative to that of their parents.
Whichever of the interpretations turns out to be the best, it seems undeniable that the employed are not a homogeneous group. In particular, the second-generation self-employed are not the same as the first-generation self-self-employed. Specifically, even with the same income, hours and occupation, they are less satisfied with their jobs. One implication is that having successful parents may be something of a poisoned chalice, either because they allow children to enter occupations in which their relative advantage is less evident, or due to an intra-generational externality where the parents’ success serves to up their offspring’s satisfaction benchmark.
REFERENCES
Blanchflower D.G. and Oswald A.J., 1998, ‘What makes an entrepreneur’, Journal of Labor
Economics, 16, pp. 26–30.
Blanchflower D.G., Oswald A.J., and Stutzer, A. (2001). “Latent Entrepreneurship across Nations”, European Economic Review, 45, pp. 680-691.
Boes, S., Staub, K. and Winkelmann, R. (2007). "Hedonic Adaptation to Living Standards and the Hidden Cost of Parental Income". University of Zurich Socieconomic Institute, Working Paper No. 0713.
Bradley D. and Roberts, J. (2004), “Self-Employment and Job Satisfaction: Investigating the Role of Self-Efficacy, Depression and Seniority”, Journal of Small Business Management, 42, pp. 37-58.
Buttner, H.E. (1992), “Entrepreneurial Stress: Is it hazardous to your Health? Journal of
Managerial Issues 4, pp. 223-240.
Carrington, W. J., McCue,K. and Brooks P. (1996), “The role of employer/employee interactions in labor market cycles: Evidence from the self-employed”. Journal of Labor Economics, 14, pp. 571–602
Carrol G. and Mosakowski E. (1987), “The career dynamics of self-employment”, Administrative
Science Quarterly 32, pp. 570-589.
Clark, A.E. (1996). "L'utilité est-elle relative? Analyse à l'aide de données sur les ménages".
Economie et Prévision, 121, 151-164.
Clark, A.E. (1997) “Job Satisfaction and Gender: Why are women so Happy at Work? Labor
Economics, 4, pp. 341-372.
Clark, A.E., Frijters, P. and Shields, M. (2008). “Relative Income, Happiness and Utility: An Explanation for the Easterlin Paradox and Other Puzzles”. Journal of Economic Literature, forthcoming.
Clark, A.E and Oswald, A.J. (1994). “Unhappiness and Unemployment.” Economic Journal 104, pp. 648-659.
Clark, A.E., Oswald, A.J. and Warr, P.B. (1996). “Is Job Satisfaction U-shaped in Age?” Journal
of Occupational and Organizational Psychology. 69, pp. 57-81.
Clark, A.E. and Senik, C. (2006). “The (Unexpected) Structure of "Rents" on the French and British Labor Markets”. Journal of Socio-Economics, 35, pp. 180-196.
Colombier N. and Masclet D. (2007). "L’importance de l’environnement familial comme determinant du travail indépendant", Economie et Statistique, 405-406, pp. 99-119.
Colombier N. and Masclet D. (2008). "Self-Employment and Intergenerational Transition of Human Capital", Small Business Economics, 30, pp. 423-437.
Cooper A.C. and Dunkelberg, W.C. (1986), ‘Entrepreneurship and Paths to Business Ownership’,
Strategic Management Journal, 7, pp. 53-68
Dunn T.A. and Holtz-Eakin D., (2000), ‘Financial Capital, Human Capital, and the Transition to Self-Employment: Evidence from Intergenerational Links’, Journal of Labor Economics 18, pp. 282-305.
Evans D.S. and Jovanovic B., (1989), ‘An Estimated Model of Entrepreneurial Choice under Liquidity Constraints’, Journal of Political Economy 97, pp. 808–827.
Frey, B.S. and Stutzer, A. (2002). "What Can Economists Learn from Happiness Research?".
Graham, C. and Pettinato, S. (2002). Happiness and Hardship. Opportunity and Insecurity in
New Market Economies. Washington D.C.: Brookings Institution Press.
Hamilton B.H., (2000), ‘Does entrepreneurship pay? An empirical analysis of the return to self-employment’, Journal of Political Economy 108, pp. 604-631.
Hundley G., (2006), ‘Family Background and the Propensity for Self-Employment’, Industrial
Relations, 45, pp. 377-392.
Kaufmann, P. J (1999). “Franchising and Choice of Self-Employment”, Journal of Business
Venturing, 14, pp. 345-361.
Laferrère, A. and McEntee, P. (1995), ‘Self-employment and Intergenerational Transfers of Physical and Human Capital: An Empirical Analysis of French Data’, The Economic and
Social Review, 27, pp. 43-54.
Lazear, E. and Moore., R L. (1984), “Incentives, productivity, and labor contracts”. Quarterly
Journal of Economics, 99, pp. 275–295.
Lentz, B.S. and Laband, D.N. (1990), ‘Entrepreneurial Success and Occupational Inheritance Among Proprietors’, Canadian Journal of Economics 23, pp. 563–579.
Lewin-Epstein, N. and Yuchtman-Yaar, E. (1991), “Health Risks of Self-Employment,” Work
and Occupations, 18, pp. 291-312.
Lindh, T. and Ohlsson, H. (1998), ‘Self-Employment and Wealth Inequality, Review of Income
and Wealth, 44, pp. 25–42.
Marchand, O. (1998). "Salariat et non salariat dans une perspective historique". Economie et
Statistique, 319-320, pp. 3-11.
McBride, M. (2001). "Relative-income Effects on Subjective Well-being in the Cross-section".
Journal of Economic Behavior and Organization, 45, pp. 251-278.
Naughton, T.J. (1987), “Quality of Working Life and the Self-Employed Managers”, American
Journal of Small Business, 12, pp. 33-41.
Nolen-Hoeksema, S. and Rusting, C.L. (1999). "Gender differences in well-being". In D. Kahneman, E. Diener and N. Schwarz (Eds.), Well-being: The foundations of hedonic
psychology. New York: Russell Sage Foundation.
Parker, S.C. (2004), The Economics of Self-employment and Entrepreneurship, Cambridge: Cambridge University Press.
Sousa-Poza, A. and Sousa-Poza, A.A. (2000). "Taking Another Look at the Gender/Job-Satisfaction Paradox". Kyklos, 53, Cambridge 135-152.
Taylor M. (1996), ‘Earnings, Independence or Unemployment: Why become Self-employed?’,
Oxford Bulletin of Economics and Statistics, 58, Cambridge 253–266.
Thompson, C. A., R. E. Kopelman, and C.A. Schriescheim (1992). “Putting All One’s Eggs in the Same Basket: A comparison of Commitment and Satisfaction among Self and Organizationally Employed Men”, Journal of Applied Psychology, 77, pp. 738-743.
de Wit, G. and van Winden, F. (1989), ‘An Empirical Analysis of Self-Employment in the Netherlands’, Small Business Economics, 1, pp. 263–272.
Table 1. Summary Statistics of individual characteristics
Variable Whole sample Employees (E) Self-employed
(SE)
Whole sample Employees (E) Self-employed
(SE) Individual characteristics Gender (Male) .552 (.497) .536 (.499) .676 (.468) .514 (.499) .486 (.499) .727 (.445) Age 39.4 (1.75) 38.5 (1.44) 46.3 (1.58) 38.6 (11.74) 38.0 (11.72) 43.2 (10.88) Marital Status Married .755 (.430) .755 (.430) .761 (.426) .589 (.492) .576 (.494) .686 (.464) Have Children .598 (.490) .608 (.488) .525 (.499) .373 (.483) .369 (.482) .405 (.491) Human Capitala, b
Less than high school .597 (.490) .581 (.493) .720 (.450)
Associate’s degree .113 (.317) .117 (.321) .084 (.277)
Bachelor’s degree .036 (.186) .037 (.189) .026 (.159)
Master’s degree or more .065 (.247) .063 (.244) .078 (.268)
Other .189 (.385) .202 (.396) .092 (.273) Technical Qualification .350 (.477) .348 (.476) .368 (.482) Education: Other .218 (.413) .214 (.410) .249 (.432) Education: A/O/Nursing .351 (.477) .354 (.478) .326 (.468) Education: High .431 (.495) .431 (.495) .425 (.494) Financial capital
Monthly Labour Income (Euros) 1653 (1064) 1603 (1096) 2230 (5550)
Monthly Labour Income (£) 1113 (994) 1120 (878) 1065 (1624)
Home Owner .537 (.499) .512 (.499) .723 (.447) .695 (.460) .692 (.461) .725 (.446)
Social environment
At least one parent SE .284 (.450) .256 (.436) .601 (.489) .164 ( .370) .149 (.356) .279 (.449)
Satisfaction
Overall 4.317 (1.255) 4.422 (1.044) 4.496 (1.154) 5.405 (1.309) 5.383 (1.315) 5.573 (1.248)
Total pay 3.560 (1.265) 3.587 (1.248) 3.319 (1.394) 4.845 (1.596) 4.830 (1.590) 4.971 (1.630)
Work itself 4.265 ( 1.138) 4.249 (1.144) 4.406 (1.074) 5.519 (1.329) 5.477 (1.343) 5.842 (1.161)
Security 4.202 (1.379) 4.239 (1.367) 3.887 (1.435) 5.359 (1.561) 5.380 (1.546) 5.188 (1.673)
France (ECHP) Great Britain (BHPS)
Note: The numbers in parentheses are Standard Deviations.
a In France, the category “less than high school” refers to individuals with the baccalaureat; “Associate degree” to
those with two years of education baccalaureat; “Bachelor’s degree” to three years of education post-baccalaureat; and “Masters degree or more” to four or more years of education post-baccalaureat. The first five education categories add up to 100%. In addition, we know whether individuals hold a technical qualification or not.
b In Great Britain, the category “A/O/Nursing” refers to individuals with GCE A or O-Levels or their equivalent,
or a Nursing qualification;; “High” to those with a First or Higher Degree, or a Teaching or Other Higher Qualification; and “Other” to those with other (lower) qualifications.
Table 2. Job Satisfaction and Self-Employment
Overall Total Pay Work Itself Security Overall Total Pay Work Itself Security
Self-Employed 0.149*** -0.018 0.223*** -0.526*** 0.209*** 0.245*** 0.326*** -0.048** (0.044) (0.046) (0.040) (0.043) (0.023) (0.023) (0.023) (0.024) Male -0.005 -0.143*** -0.035* -0.099*** -0.251*** -0.223*** -0.141*** -0.214*** (0.020) (0.021) (0.020) (0.022) (0.013) (0.014) (0.013) (0.014) Age -0.045*** -0.073*** -0.028*** -0.021*** -0.045*** -0.026*** -0.024*** -0.058*** (0.006) (0.007) (0.006) (0.007) (0.004) (0.004) (0.004) (0.004) Age-squared/1000 0.486*** 0.806*** 0.293*** 0.318*** 0.605*** 0.366*** 0.391*** 0.699*** (0.078) (0.084) (0.075) (0.082) (0.046) (0.047) (0.046) (0.047) Married 0.017 0.071*** -0.020 0.024 0.074*** 0.104*** 0.047*** 0.070*** (0.021) (0.022) (0.021) (0.022) (0.014) (0.015) (0.014) (0.015) Has Children 0.002 -0.054*** 0.015 -0.075*** 0.105*** 0.071*** 0.091*** 0.050*** (0.019) (0.020) (0.019) (0.020) (0.013) (0.014) (0.013) (0.014)
Log Monthly Labour Income 0.166*** 0.351*** -0.002 0.348*** -0.020*** 0.100*** -0.019*** 0.002
(0.014) (0.019) (0.013) (0.019) (0.005) (0.006) (0.005) (0.005) House Owner 0.013 0.061*** 0.008 -0.028 -0.045*** 0.030** -0.060*** -0.031** (0.019) (0.020) (0.019) (0.020) (0.014) (0.015) (0.014) (0.014) Occupation Dummies √ √ √ √ √ √ √ √ Wave Dummies √ √ √ √ √ √ √ √ Region Dummies √ √ √ √ √ √ √ √ Education Dummies √ √ √ √ √ √ √ √ Observations 45438 45206 45233 45182 97982 97530 97936 96982 Log Likelihood -54874.534 -50653.992 -55888.481 -58093.924 -135868.57 -144182.3 -138017.65 -144642.2
Standard errors in parentheses. * significant at 10%; ** significant at 5%; *** significant at 1%.
TABLE 3.Job Satisfaction by Labor Force Status Overall Job satisfaction Overall Job satisfaction Dissatisfied 14.8 15.2 14. 6 1-3 11.0 7.8 8.4 Rather satisfied 29.4 22.4 26.9 4 7.7 6.8 7.1 Satisfied 46.2 44.7 45.8 5 21.7 19.1 20.6 Very satisfied 9.2 17.7 12.7 6 45.2 47.0 44.8 Completly satisfied 7 14.4 19.3 19.0 Pay Pay Dissatisfied 42.4 47.9 57.2 1-3 23.8 19.4 24.3 Rather satisfied 31.3 25.0 22.2 4 8.7 9.9 9.6 Satisfied 23.6 23.0 17.9 5 24.0 20.5 19.2 Very satisfied 2.3 4.2 2.8 6 33.7 36.2 34.2 Completly satisfied 7 9.8 14.1 12.8
Working Conditions Working
Conditions Dissatisfied 21.8 14.7 19.3 1-3 10.3 5.4 4.8 Rather satisfied 27.1 23.8 28.9 4 7.7 5.4 4.9 Satisfied 43.1 48.3 43.9 5 20.0 15.6 15.8 Very satisfied 7.5 13.3 7.9 6 42.1 44.7 44.2 Completly satisfied 7 19.9 28.9 30.3
Job Security Job Security
Dissatisfied 24.3 40.5 29.5 1-3 13.7 17.2 16.3
Rather satisfied 22.8 23.6 24.1 4 8.7 12.1 9.9
Satisfied 37.6 28.7 36.0 5 17.4 17.4 16.7
Very satisfied 14.8 7.1 10.4 6 36.0 30.6 30.9
Completly satisfied 7 24.2 22.7 26.2
Note: Job Satisfaction in the BHPS is measured on a one to seven scale, where one means "Not satisfied at all", four means "Not satisfied or dissatisfied" and seven means "Completely satisfied". None of the other values are labelled.
Salaried First
generation SE
Second generation SE
France (ECHP) Great Britain (BHPS)
Salaried First
generation SE
Second generation SE
Table 4. Overall and Domain Job Satisfaction of the First- and Second-Generation Self-Employed: Pooled.
Overall Total Pay Work Itself Security Overall Total Pay Work Itself Security
Self-Employed 0.205*** 0.099 0.314*** -0.596*** 0.233*** 0.274*** 0.331*** -0.057**
(0.061) (0.064) (0.056) (0.062) (0.026) (0.026) (0.026) (0.027)
Mother or Father Self-Employed 0.013 0.075*** 0.030 -0.026 0.018 0.013 0.000 -0.002
(0.021) (0.023) (0.022) (0.024) (0.019) (0.019) (0.019) (0.019)
Self-Employed and Mother or Father Self-Employed -0.125* -0.264*** -0.183** 0.131* -0.097** -0.112** -0.018 0.032
(0.082) (0.084) (0.073) (0.082) (0.047) (0.048) (0.046) (0.050) Male 0.005 -0.160*** -0.036* -0.106*** -0.251*** -0.224*** -0.141*** -0.214*** (0.021) (0.023) (0.021) (0.024) (0.013) (0.014) (0.013) (0.014) Age -0.044*** -0.068*** -0.029*** -0.028*** -0.045*** -0.026*** -0.024*** -0.058*** (0.007) (0.008) (0.007) (0.007) (0.004) (0.004) (0.004) (0.004) Age-squared/1000 0.479*** 0.737*** 0.316*** 0.409*** 0.606*** 0.367*** 0.391*** 0.699*** (0.085) (0.094) (0.083) (0.090) (0.046) (0.047) (0.046) (0.047) Married 0.017 0.086*** -0.018 0.036 0.074*** 0.104*** 0.047*** 0.070*** (0.023) (0.024) (0.023) (0.024) (0.015) (0.015) (0.014) (0.015) Has Children 0.008 -0.069*** 0.026 -0.062*** 0.104*** 0.071*** 0.091*** 0.050*** (0.020) (0.021) (0.020) (0.021) (0.013) (0.014) (0.013) (0.014)
Log Monthly Labour Income 0.174*** 0.387*** 0.003 0.357*** -0.020*** 0.100*** -0.019*** 0.002
(0.015) (0.021) (0.014) (0.021) (0.005) (0.006) (0.005) (0.005) House Owner 0.011 0.064*** 0.008 -0.040* -0.045*** 0.030** -0.060*** -0.031** (0.020) (0.022) (0.020) (0.021) (0.014) (0.015) (0.014) (0.014) Occupation Dummies √ √ √ √ √ √ √ √ Wave Dummies √ √ √ √ √ √ √ √ Region Dummies √ √ √ √ √ √ √ √ Education Dummies √ √ √ √ √ √ √ √ Observations 40421 40227 40245 40204 97982 97530 97936 96982 Log Likelihood -48730.668 -44871.311 -49747.822 -51745.071 -135861.29 -144172.82 -138017.35 -144641.39
Standard errors in parentheses. * significant at 10%; ** significant at 5%; *** significant at 1%
Table 5. Overall and Domain Job Satisfaction of the First- and Second-Generation Self-Employed: Panel
All Total Pay Work Itself Security All Total Pay Work Itself Security
Self-Employed 0.880*** 0.944*** 0.384* -0.178 0.543*** 0.682*** 0.719*** -0.380***
(0.245) (0.264) (0.242) (0.240) (0.065) (0.066) (0.069) (0.065)
Mother or Father Self-Employed 0.327 0.216 -0.227 -0.353
(0.430) (0.496) (0.381) (0.417)
Self-Employed and Mother or Father Self-Employed 0.095 -1.135*** -0.430 -0.305 -0.407*** -0.474*** -0.284** -0.095
(0.392) (0.404) (0.347) (0.377) (0.123) (0.124) (0.127) (0.125)
Married -0.035 -0.082 0.066 0.006 0.022 0.112*** -0.038 0.029
(0.070) (0.082) (0.070) (0.075) (0.038) (0.039) (0.039) (0.039)
Has Children -0.058 -0.037 0.055 -0.060 0.074** 0.116*** 0.059* -0.023
(0.058) (0.066) (0.057) (0.061) (0.033) (0.034) (0.034) (0.033)
Log Monthly Income 0.113*** 0.271*** -0.050 0.245*** 0.028** 0.218*** -0.004 0.042***
(0.042) (0.048) (0.040) (0.046) (0.012) (0.014) (0.013) (0.012) House Owner 0.090 0.025 0.010 -0.054 -0.077** -0.023 -0.033 -0.031 (0.066) (0.076) (0.065) (0.071) (0.036) (0.037) (0.037) (0.037) Age Dummies √ √ √ √ √ √ √ √ Occupation Dummies √ √ √ √ √ √ √ √ Wave Dummies √ √ √ √ √ √ √ √ Region Dummies √ √ √ √ √ √ √ √ Education Dummies √ √ √ √ √ √ √ √ Observations 27555 21529 28069 24335 71029 70757 69692 70197
Standard errors in parentheses. * significant at 10%; ** significant at 5%; *** significant at 1%