HAL Id: cea-02442304
https://hal-cea.archives-ouvertes.fr/cea-02442304
Submitted on 16 Jan 2020
HAL is a multi-disciplinary open access
archive for the deposit and dissemination of
sci-entific research documents, whether they are
pub-lished or not. The documents may come from
teaching and research institutions in France or
abroad, or from public or private research centers.
L’archive ouverte pluridisciplinaire HAL, est
destinée au dépôt et à la diffusion de documents
scientifiques de niveau recherche, publiés ou non,
émanant des établissements d’enseignement et de
recherche français ou étrangers, des laboratoires
publics ou privés.
Influence of the hydride precipitation on the corrosion
kinetics of Zircaloy-4 Effect of the nanostructure and
grain boundaries properties of zirconium oxide layer on
the oxygen diffusion flux
M. Jublot, G. Zumpicchiat, M. Tupin, S. Pascal, C. Berdin, C. Bisor, M. Blat
To cite this version:
M. Jublot, G. Zumpicchiat, M. Tupin, S. Pascal, C. Berdin, et al.. Influence of the hydride
precipita-tion on the corrosion kinetics of Zircaloy-4 Effect of the nanostructure and grain boundaries properties
of zirconium oxide layer on the oxygen diffusion flux. ASTM International - 18th International
Sym-posium on Zirconium in the Nuclear Industry, May 2016, Savannah, United States. �cea-02442304�
Influence of the hydride precipitation on the corrosion kinetics of Zircaloy-4: Effect of the nanostructure and grain boundaries properties of zirconium oxide layer on the oxygen diffusion flux.
Michael Jublot1, Guillaume Zumpicchiat1, Marc Tupin1, Serge Pascal2, Clotilde Berdin3, Caroline
Bisor1, Martine Blat4
1CEA-DEN, DMN, Service d’Etudes des Matériaux Irradiés, CEA-Saclay, 91191 Gif-sur-Yvette Cedex, France 2CEA-DEN, DM2S, SEMT, CEA-Saclay, 91191 Gif-sur-Yvette Cedex, France
3Univ Paris-Sud 11, SP2M-ICMMO, CNRS UMR 8182, F-91405 Orsay cedex, France 4EDF, EDF R&D, Centre des Renardières, Ecuelles, 77818 Moret-sur-Loing Cedex France
Abstract:
Hydride precipitation at the metal/oxide interface is frequently proposed as a cause for corrosion acceleration of Zircaloy-4 at high burn-up in pressurized water reactors (PWR). In order to identify the local mechanisms possibly involved, the nanostructure of oxides formed on massive zirconium hydrides and on reference Zircaloy-4 has been studied with an innovating grain mapping technique in transmission electron microscopy (TEM).
In autoclave PWR conditions, the presence of a hydride phase, previously formed by cathodic charging technique at the surface of Zircaloy-4, clearly increases the corrosion rate, and a higher oxygen diffusion flux along oxide grain boundaries is observed, compared to the reference Zircaloy-4. The texture, grain size and grain boundaries misorientation in the oxide layer were studied in detail along the direction of the oxide growth using an automated crystal orientation mapping technique associated with a TEM for both pre-hydrided and reference Zy4 samples. The texture in the growth direction is similar on pre-hydrided and reference samples, but the grain-to-grain misorientations show differences. Indeed, on the pre-hydrided sample, the misorientation of 90° with respect to [001] monoclinic axis is less probable than in the reference oxide, and more misorientations of 60° and 140°, corresponding to larger mismatches between neighboring grain boundaries, are observed. A smaller average diameter of the columnar monoclinic grains was also clearly revealed for the oxide grown on the pre-hydrided sample, which leads to a higher number of diffusion paths for oxidizing species. These results are discussed and used in a zirconium oxidation dedicated simulation code that was developed to take into account the oxygen diffusion flux through the polycrystalline microstructure of the oxide layer as a function of the grain size.
Introduction
Zircaloy-4 alloy is widely used in Pressurized Water Reactors (PWR) as nuclear fuel cladding material because of its good overall properties: mechanical behavior, low thermal neutron absorption and satisfactory corrosion resistance. In primary water conditions, around ~ 320°C and 155 bars, the cladding tubes are gradually corroded and hydrided from the hydrogen of the water involved in the oxidation process. According to micro-beam synchrotron analyses [1,2], the oxide first nucleates in the metastable tetragonal phase, stabilized by a small grain size (5 to 25 nm) and compressive stresses at the metal/oxide interface [3,4,5]. A non-protective oxide layer of few hundred nanometers grows quickly with equiaxed grains and porosity [5,6]. The diffusing species migrate to the oxide/metal interface through the short circuits inside the oxide layer [7]. Next, the most favorable oriented grains which minimize the planar stress grow faster to become columnar with {001}tetragonal planes parallel to the interface [8,9]. Beyond a critical size, the martensitic shear relaxation transforms the tetragonal grains into the monoclinic phase maintaining the same orientation. Most of the investigations with X-ray diffraction (XRD) and transmission electron microscopy (TEM) revealed that the monoclinic oxide adopts a strong fibre texture where the (10𝑚𝑚�) planes are parallel to the sample surface, with m = 2;3;4;5;6 [4,9-12]. The highly oriented protective columnar grains limit the diffusivity of oxygen through the oxide layer and slow down the corrosion kinetics. After columnar grains reach a critical length, their growing is stopped due to stress accumulation [1]. On Zircaloy-4 alloy, TEM observations report a columnar grain width between 10 to 40 nm and a length range of 80-300 nm [3,5]. Other new layers of columnar grains grow until the stress accumulation leads to the formation of pores and cracks which break the protective properties of the layer to the corrosive species. Then, the first corrosion kinetic cycle is over and a new cycle starts quickly with equiaxed grains first followed with new protective columnar grains. In PWR, one cycle corresponds to an oxide layer thickness of about 1.8-2 µm on Zircaloy-4 [13]. The corrosion process adopts a cyclic behavior until a threshold close to 30-40 GWd/tU then the corrosion is accelerated [14]. Several potential factors have been proposed as responsible for this acceleration, like the dissolution of the Zr(Fe,Cr)2 precipitates under irradiation
[15,16]. The tin content has also a strong effect on the onset of the high burn-up corrosion
acceleration, the accelerated threshold being delayed with a lower tin concentration [14,17]. The last major factor is the hydride precipitation in the metal and its accumulation at the oxide/metal interface. As it was highlighted after 2 cycles in PWR [18], the corrosion kinetic is strongly accelerated on a defective fuel rod containing a hydride rim.
Over a threshold, the precipitation of massive hydride accelerates the corrosion kinetics, thus the hydrogen absorption, and it weakens the cladding tubes which are the first containment barrier to fission products. These reasons lead to formally evaluate the hydride effect on the corrosion kinetics. In autoclave, the presence of massive hydride leads to an acceleration of the corrosion kinetics by a factor of 2-3 [19], rather than a factor of 5 in PWRs [14]. The same observation was reported from Garde [20] who attributes the start of the acceleration to the reach of the hydrogen solubility limit, and then to the hydride precipitation close to the oxide/metal interface. In reactors, Zr-2.5Nb alloys do not usually suffer corrosion acceleration, but some corrosion experiments (in water at 350°C) performed on pre-hydrided Zr-2.5Nb samples also led to a higher corrosion rate [18]. To explain the corrosion acceleration, several authors proposed an impact of the Zr-matrix volume expansion on the precipitation of hydrides which changes the mechanical equilibrium [20,21]. Therefore , Bossis et al. [13] noted the presence of significant crack-free veins in the oxide associated to a much finer crack distribution on highly oxidized claddings in PWR. And Kim et al. [18] suggest that a weaker stress,
which affects the tetragonal to monoclinic phase transformation, induces more defaults in oxide. The corrosive species would diffuse easier through the oxide towards the interface.
In simulated PWR conditions, Tupin et al. [22] indicated the presence of a sub-oxide Zr3O layer
between the oxide and hydride layers on Zircaloy-4 whithout any significant change in the oxide microstructure according to conventional TEM observations. An apparent diffusion coefficient of 2.8 x 10⁻¹⁵ cm2/s was calculated from diffusion experiments at 360°C in oxide layers formed on pre-hydrided
samples instead of 1.6 x 10⁻¹⁵ cm2/s on reference, corresponding to a 1.8 comparative ratio. They
supposed that oxide grains grown on pre-hydrided samples may have higher misorientation angle, which could lead to a larger intergranular space for short-circuit diffusion. However, though several TEM studies were carried out to study the hydride effect on the corrosion film, none of them clearly showed a modification of the oxide microstructure.
In the framework of these previous studies, this paper investigates the influences of the oxide microstructure and texture on the oxygen diffusion through the oxide layer formed on massive hydrides, in the pre-transition stage. The grain size distribution, the texture formation and the misorientation angle between adjacent grains are compared between the reference and the pre-hydrided Zircaloy-4 samples corroded by Tupin [22] in simulated PWR conditions. The oxide grains are characterized by TEM with the automated crystal orientation mapping technique referred as ASTARTM [23]. This is the only tool able to index each grain with a width range between 10 to 40 nm,
which is over the limit of the EBSD technique on SEM. This investigation is performed on FIB lamellas cut parallel to the oxide-metal interface. Indeed the in-plane analysis is more favorable to study with a good statistic the grain boundary properties controlling the diffusion of the oxygen species, than on cross-sectional samples. To complete, oxygen diffusion simulations using Cast3M are carried out according to the grain size distribution actually measured and compared to the oxygen diffusion variations from experiments between pre-hydrided and reference oxidized samples.
Experimental procedures and Materials
Materials
The materials are sheets 0.425 mm thick of Zircaloy-4 provided by AREVA NP, recrystallized at 700°C. The average grain size is about 10 µm [24] and the chemical composition is described in Table 1. This work study two samples. The first one, named Zy4, is used as a reference and the second, named Zy4-h, was hydrided on both sides of the Zircaloy-4 sheet. A cathodic charging technique was performed to precipitate a 8 µm layer of δ-ZrH1.66 phase on the surface of the specimen. The hydriding
protocol was developed by EDF R&D [19]. The microstructural analysis confirmed that a compact layer of hydride precipitates on the sample surface [22].
TABLE 1 - Composition of addition elements in Zircaloy-4 alloy.
Alloying elements Sn, % Fe, % Cr, % O, % H, wt.ppm
Corrosion tests
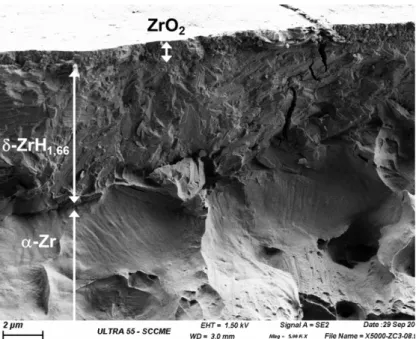
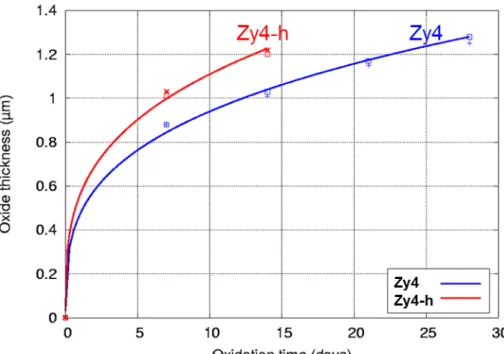
Both samples were corroded in static autoclave with light primary water at 360°C and 18.7 MPa. The water chemistry was composed of 1000 wt.ppm of boron and 2 wt.ppm of lithium prepared using boric acid and lithium hydroxide. Zy4 and Zy4-h were respectively oxidized during 28 days and 14 days in order to form an equal thickness of oxide in the pre-transition phase. The fractography of the final oxidized Zy4-h sample (Fig. 1) confirms the precipitation of a massive and brittle hydride on the ductile Zircaloy-4 substrate, covered with a homogeneous oxide layer. The kinetic curve of the pre-hydrided Zircaloy-4 sample was analyzed and compared with the reference [22]. Fig. 2 clearly highlights the impact of the presence of a massive hydride on the corrosion rate of Zircaloy-4, with an acceleration factor close to 1.8. After 14 days in PWR conditions, the oxide layer grown on Zy4-h is estimated from weight gains to be 1.2 µm while the oxide thickness is 1.3 µm on Zy4, after 28 days. This detrimental role of a massiv hydride layer on the corrosion rate was previously shown by Blat [19,21] and Tupin [22]. Both samples were additionally exposed during 24 hours to the same autoclave conditions but with water containing oxygen isotope (20% vol. of H218O) in order to analyze the 18O diffusion profiles
and to compare them with Cast3M simulated profiles function of the grain size parameter.
FIG. 1 – SEM fractography of the Zy4-h surface after cathodic charging and corrosion during 14 days in simulated PWR conditions.
FIG. 2 - Corrosion kinetics curves of reference (Zy4) and pre-hydrided (Zy4-h) Zircaloy-4 samples corroded in static autoclave with light primary water at 360°C and 18.7 MPa. The water chemistry was composed of 1000 wt.ppm of boron and 2 wt.ppm of lithium.
TEM samples preparation
The TEM analysis is performed on transparency samples to the electron beam. That requires a careful thinning below 100 nm, without changing the sample properties. The FIB sample preparation technique was chosen to locate area of interest with a few tens of nanometers. The dual beam FIB/SEM system used is a FEI Helios 650 NanoLab microscope, equipped with a gallium ion source operating in the accelerating-voltage range from0.5 to 30 kV.
Samples were prepared in plane-view for three main reasons: 1- To study the oxide grain boundaries parallel to the direction of diffusion elements across the ZrO2 layer, then boundaries controlling the
diffusion kinetic. 2- To scan a wide zone of interest having the same properties in the part of the layer controlling the diffusion rate. 3- To cut the columnar grains in their width orientation which minimize the overlapping of two grains across the FIB foil thickness close to 100 nm.
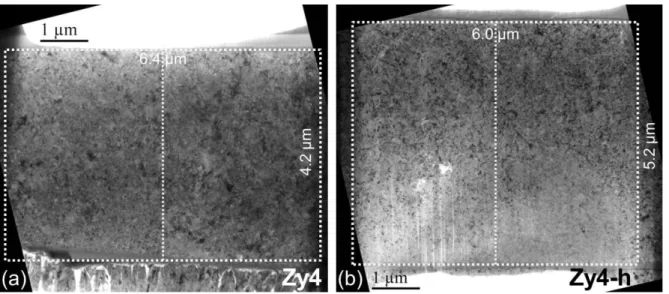
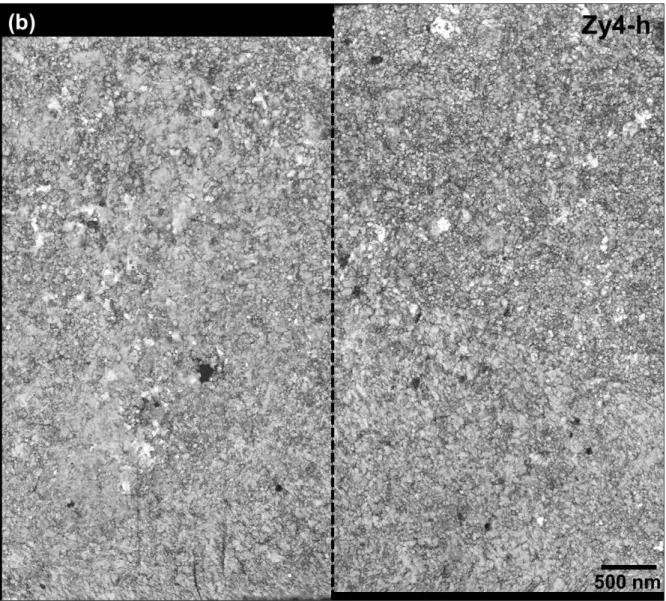
After protecting the oxide surface from damage due to the ion irradiation, a large wedge of material is taken off from the specimen and next rotated by 90° before being fixed onto the TEM grid. Both sides of the plane-view sample are then milled using decreasing ion current. The finished FIB lamellas are transverse cuttings of the columnar oxide grains, located 1 µm ± 0.1 µm above the oxide-metal or oxide-hydride interfaces for both oxidized samples Zy4 and Zy4-h. The bright-field TEM images in Fig. 3 show the entire analyze area of the FIB foils Zy4 and Zy4-h. The foil thickness of Zy4 is homogeneous and close to 60 nm but the thickness of the Zy4-h lamella varies between 65 nm and 45 nm, from top to bottom. The thinnest region of the Zy4-h sample show slight light striations on the surface only, they are due to ion channeling during the FIB preparation but not affect the phase orientation indexing as viewed below.
FIG. 3 - Bright-field TEM images of the FIB thin areas taken about 1 µm away from the oxide/metal interface, in the oxide layer formed on a) Zy4 and b) Zy4-h. The scanned regions with TEM are delineated with white dots.
Crystal orientation mapping tool on TEM
The orientation mapping microscopy was performed on a FEI tecnai 30 G2 TEM equipped with a LaB6
gun at an operating voltage of 300kV. The Automated Crystal Orientation Mapping (ACOM-TEM) is done with the ASTARTM tool provided by NanoMEGAS [23][25]. This tool is similar to an usual EBSD
(Electron Back-Scatter Diffraction) in scanning electron microscopy (SEM), with a higher sensitivity to lattice parameters and a better the spatial resolution (5 nm with ACOM-TEM against 40 nm with EBSD). The last mentioned advantage is less true, since the EBSD technique is used in transmission geometry [26], the spatial resolution of 10 nm can be achieved. The ACOM-TEM technique combines the nano-probe scanning approach with an external camera to record the corresponding spot diffraction pattern of the scanned area. The crystal orientation and/or crystal phase are indexed by comparing the collected patterns with a complete set of calculated patterns. This set of theoretical patterns corresponds to all of the simulated electron diffractograms of the expected phases taking into account the crystal symmetries. The degree of correlation is calculated between the experimental pattern and the matching simulated pattern, and provides a map of matching indexes where grain boundaries appear with a dark contrast because of a low correlation value. The validity of the proposed orientation or phase is defined by the ratio of the matching indexes between the two best solutions. This ratio is called "reliability".
In this investigation, orientation maps of the ZrO2 monoclinic phase are studied. They are filtered with
a value of reliability above 15 as defined in literature [26]. The theoretical templates of the ZrO2
monoclinic structure are generated with the following cell parameters: a = 5.15 Å; b = 5.21 Å; c = 5.32 Å; β = 99.22° [27]. The beam size was minimized to 9 nm with a condenser aperture of 50 µm. The thin samples are scanned with a step of 5 nm and an acquisition rate of 6 frames per second. This relatively low speed result from the low current beam from the LaB6 gun compared to a field emission
gun. The scanned area covers 6.4 x 4.2 µm2 on Zy4 and 6 x 5.2 µm2 on Zy4-h. This study
corresponds to more than one million electron diffraction patterns registered and exploited for each sample. After acquisition and exploitation, the orientation maps are analyzed with the HKL Channel5 software of Oxford Instrument.
Modelling of the oxide microstructure (numerical microstructure)
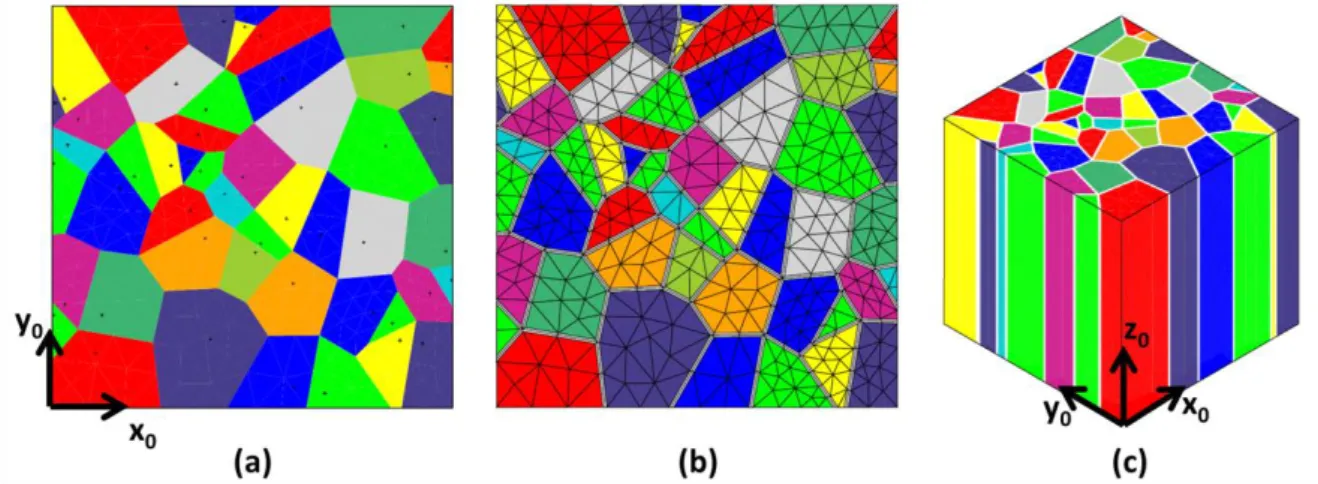
The microstructure of the oxide scale is modelled from a two-dimensional Voronoï diagram of a 0.5x0.5 μm² square with Cast3M1, the finite element tool box from CEA. A Voronoï diagram is a
mathematical decomposition of space with a random set of points, called germs. Each point is a vertex in the Delaunay triangulation. Vertices of the 2D-Voronoï diagram are the centers of the circumscribed circles of the Delaunay triangles. The edges of the Voronoï diagram are the perpendicular bisectors of the Delaunay triangulation. The polyhedra thus built are called Voronoï cells. The quantity of germ points defined the average equivalent diameter of Voronoï cells. Fig. 4a shows the example of a so-call Voronoï diagram with 50 cells.
FIG. 4 - Example of creation of a numerical microstructure with 50 grains : a) Voronoï diagram of 0.5x0.5 µm² square, b) mesh of the grains and the grain boundaries and c) final microstructure obtained by extrusion with Z0 axis parallel to the diffusion direction.
The columnar grains of zirconia are modelled by extruding the Voronoï cells in the third direction (Fig. 4c). Before the extrusion step, the grain boundaries are explicitly built with a thickness of 𝛿𝛿 using the following procedure. In each Voronoï cell, called mother cell, the same somewhat smaller cell, called daughter cell, is created. This daughter cell is created from the displacement of the points 𝑃𝑃(𝑥𝑥𝑃𝑃, 𝑦𝑦𝑃𝑃) of each edge 𝜔𝜔𝑖𝑖 of the mother cell such as:
𝑎𝑎𝑖𝑖𝑥𝑥𝑃𝑃+ 𝑏𝑏𝑖𝑖𝑦𝑦𝑝𝑝≤𝛿𝛿2 ∀𝑃𝑃�𝑥𝑥𝑝𝑝, 𝑦𝑦𝑝𝑝� ∈ 𝜔𝜔𝑖𝑖 (1)
with 𝑛𝑛𝑖𝑖(𝑎𝑎𝑖𝑖, 𝑏𝑏𝑖𝑖) the unit normal vector of the edge 𝜔𝜔𝑖𝑖, directed towards the inside of the mother cell. The space between mother cells and daughter cells is considered to be a half grain boundary. The grain boundary between two grains is thus formed by two half grain boundaries.
Finally, grains are meshed with linear tetrahedral elements and half grain boundaries with a layer of linear prismatic elements (see Fig. 4b).
Post-process of diffusion simulation consists in cutting the numerical sample into 30 slices (of individual thickness close to 17 nm) perpendicular to the diffusion direction. Nodal concentrations are integrated in each slice and averaged by the slice volume. In this way, the diffusion profile can be plotted and compared to experimental data.
Results
Oxide grains nanostructure
The ACOM-TEM analysis of each sample was divided into two equal parts, plotted on Fig. 3, in order not to exceed an acquisition time over 30 hours for each zone. The corresponding index maps (Fig. 5) provide contrasted maps that highlight structural features on oxide planes parallel to the sample surfaces, 1 µm above the oxide/metal interface. The column oxide grains are usually described with an elongated shape according to the growing direction and a more or less regular polygonal base on the normal plane. According to the oxide index maps of Zy4 (Fig. 5a), the base shape is not correctly described. The bigger grains seem elongated while the smaller grains have a more regular shape. Fig 5b corresponds to the index map of the Zy4-h oxide layer. It clearly shows a smaller base size and a lower size distribution of the oxide grains crystallized on Zy4-h than on Zy4.
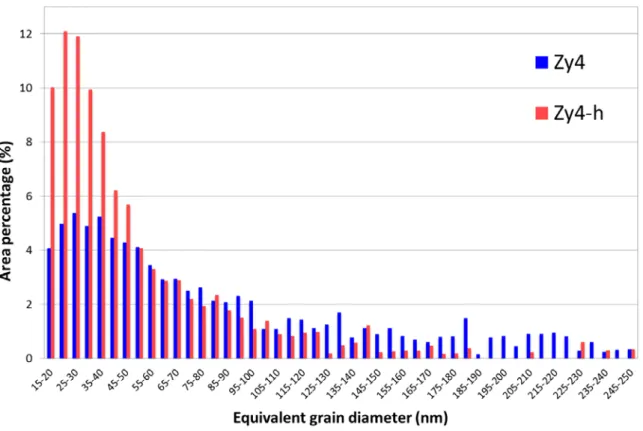
The grain size distributions of Zy4 and Zy4-h oxides are quantified in Fig. 6 versus the area proportion. They are extracted from the ACOM-TEM analysis. The statistic takes into consideration the indexed grains according to the ZrO2 monoclinic phase, with reliability above 15 [26] and a misorientation
angle above 10° to discretize adjacent grains. The oxide grain base is assumed to be a disk, to extract the grain diameter histograms of Zy4 and Zy4-h. The values below 15 nm are not considered to limit the potential errors resulting from the thick FIB foil of 60 nm with the use of the 9 nm beam size. Fig. 6 confirms the smaller size range of Zy4-h including over 50% of oxide grains below a diameter of 40 nm and 90% less than 110 nm. Average grain diameter is 27.8 nm. As a comparison, on Zy4 reference, 50% of oxide range from 15 to 75 nm and the size dispersion continues over 250 nm, in agreement with the largest distribution of grain size observed on Fig. 5a. The grains over 250 nm in size are in fact composed of several sub-grains with grain boundary misorientations lower than 10°. The corresponding average grain diameter is 34.6 nm, 24% larger than the average diameter on Zy4-h. This average is consistent with the literature (10-40 nm) [3,5] and valid the accuracy of the methodology. Around 9000 oxide grains were identified on Zy4 sample and close to 15000 grains on Zy4-h sample, which provides a high statistical analysis that could never have been achieved with conventional TEM. On the hydride sample, the microstructure of the oxide layer shows a higher grain number density, thus diffusion paths corresponding to grain boundaries are denser. Therefore, the grain boundary surface fraction (𝑓𝑓) were calculated for a hexagonal grains geometry with an intergranular space of δ = 0.5 nm. The surface fraction of a hexagonal cell is given by 𝑓𝑓 = 2𝛿𝛿 𝑎𝑎√3⁄ with 𝑎𝑎 corresponding to the edge length. From the grain size distribution, the 𝑎𝑎 length is deduced for each grain diameter, converting the circular base to the equivalent hexagonal area. The surface fraction of oxide grain boundaries are calculated by integrating grain sizes weighted of their surface fraction. On both both samples Zy4 and Zy4-h the results are 𝑓𝑓𝑍𝑍13= 0.018 and 𝑓𝑓𝑍𝑍𝑍𝑍3−ℎ = 0.029. According to the diffusion direction, the grain boundary surface fraction 𝑓𝑓 is 60% higher on hydride (Zy4-h) than on reference (Zy4). Furthermore, this ratio could be greater if the oxide grains with a width smaller than 15 nm were integrated in the distribution.
Fig. 5 - Correlation index maps of oxide planes grown on a) Zy4 and b) Zy4-h samples, 1 µm above the oxide/metal interface, which is delimited on TEM images (Fig 3) with a dashed rectangular.
Fig. 6 – Grain size distribution of columnar grain width grown on Zy4 and Zy4-h, in area percentage.
Oxygen diffusion simulation
To determine impacts of a smaller grain size on corrosion kinetics and to associate it with the diffusion coefficient ratio, simulations of 18O diffusion are performed through numerical microstructures
according to the measured average grain diameter of Zy4 and Zy4-h oxides, respectively 34.6 and 27.8 nm. The thickness of the grain boundaries is arbitrary set at 0.5 nm. Fig. 7 shows the numerical samples of Zy4 and Zy4-h, with the (y0,x0) plane normal to the diffusion direction z0 of species. The
volume of each numerical sample is 0.5x0.5x0.5 µm3. The numerical sample of Zy4 consists of 250
grains and the numerical sample of Zy4-h consists of 380 grains. Fig. 8 and Fig. 9 respectively show the grain size distributions and the grain boundary thickness distributions obtained for the numerical samples of Zy4 and Zy4-h. The grain size distributions have Gaussian shape which the mean diameter is μ = 34.6 nm and the standard deviation σ = 6.2 µm for numerical Zy4 and μ = 28.0 nm and σ = 4.5 µm for numerical Zy4-h. The grain boundary surface fraction is respectively 0.030 and 0.038 which represent a difference of 26% between the two numerical samples.
Fig. 7 - Numerical samples of Zy4 (250 grains) and Zy4-h (380 grains).
Fig. 8 - Grain size distributions for Zy4 and Zy4-h numerical microstructures.
Fig. 9 - Grain boundary thickness distributions for Zy4 and Zy4-h numerical microstructures.
18O diffusion is simulated using a Fick diffusion model. The volume diffusion coefficient of oxygen is
set at 1x10-16 cm²/s and the grain boundary diffusion coefficient of oxygen at 1x10-13 cm²/s (preferential
diffusion through the grain boundary). The initial and boundary conditions are as follows. The 18O
concentration field is initially zero in the numerical microstructure:
𝐶𝐶 = 𝐶𝐶0= 0 at 𝑡𝑡 = 0 (2)
At 𝑡𝑡 > 0, the 18O concentration is prescribed on the nodes of the surface 𝑆𝑆 (equation of the
𝐶𝐶
𝐶𝐶𝑠𝑠= 1 on 𝑆𝑆 at 𝑡𝑡 > 0 (3)
The 18O diffusion is simulated during 24h with a time step of 0.24h. Fig. 10 shows the 18O concentration profiles after diffusing for 6 hours through numerical samples. As expected, for the
same time of diffusion, the 18O penetration is more important in numerical Zy4-h than in numerical Zy4.
By fitting the concentration profiles with the classical expression:
𝐶𝐶(𝑧𝑧) = (𝐶𝐶0− 𝐶𝐶𝑠𝑠) erf � 𝑧𝑧
2�𝐷𝐷𝑎𝑎𝑝𝑝𝑝𝑝𝑡𝑡� + 𝐶𝐶𝑠𝑠 (4)
the 18O apparent diffusion coefficient is 3.1x10⁻¹⁵ cm²/s in numerical Zy4 and 4.0x10⁻¹⁵ cm²/s in
numerical Zy4-h. Thus the oxygen has an apparent diffusion coefficient 1.3 time higher in numerical Zy4-h than in the numerical Zy4, which is consistent with the difference of grain boundary surface fraction between the two numerical microstructures.
Sample were additionally exposed 24 hours in PWR autoclave environment with water composed of 20% of H218O to assess the oxidation mechanisms of the samples. Then the 18O concentration
profiles, previously published [22], were analyzed with the SIMS technique. They correspond to the dot lines on Fig. 10. From this curves, the calculated apparent diffusion coefficient of 18O is 1.8 higher on
the pre-hydrided sample. The comparison between simulation and experiment oxygen profiles clearly shows that the chosen diffusion coefficients for the simulation do not allow simulation to reproduce the SIMS profiles. Indeed, the volume diffusion should be several orders of magnitude lowered to match with the apparent diffusion coefficients calculated from experiments: 1.3x10⁻¹⁵ cm²/s in Zy4 and
2.4x10⁻¹⁵ cm²/s in Zy4-h [24]. In this case, the gap between volume and grain boundary diffusion
coefficients would induce convergence issues with the solving algorithm of the finite element problem of diffusion. As a conclusion, the simulation results show that the difference of average grain size between Zy4 and Zy4-h is far from being the only factor to explain the 1.8 apparent diffusion coefficient ratio between pre-hydrided and reference oxidized samples.
Fig. 10 - Comparison between the simulated 18O concentration profiles after diffusing for 6h and the
experimental 18O concentration profiles obtained by SIMS after isotopic exchange for 24h [22]. The
dashed lines are the results of the fitting with the classical solution of the second Fick equation.
The oxide microtexture
Oxide microtexture is investigated from the ACOM-TEM acquisitions to study the impact of hydrides precipitation on the oxide texture. The study takes into consideration indexed data points according to the ZrO2 monoclinic phase, with reliability above 15 [26]. The points satisfying these conditions are
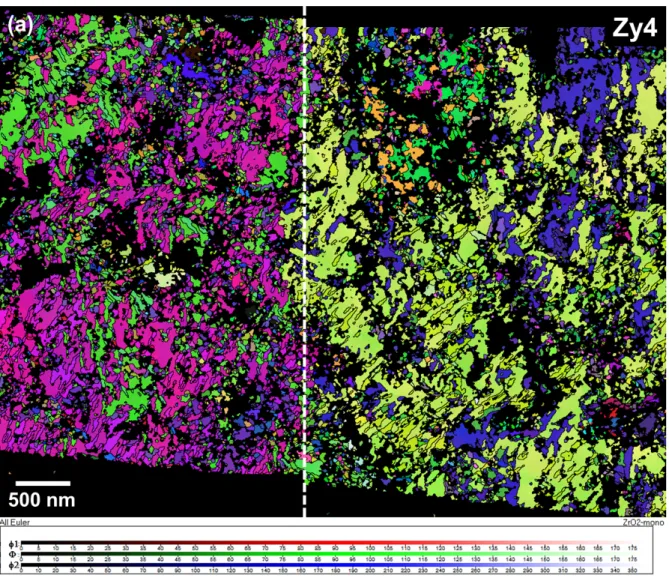
colorized on the corresponding maps of the Fig. 11 (Zy4) and Fig. 12 (Zy4-h), as a function of Euler angles (φ1, Φ, φ2) defining the monoclinic phase orientation of the columnar oxide grains, 1 µm above the oxide-metal interface. Then, the color scale allows to highlight areas where the crystallographic orientations are close. Black regions are not indexed because of a lower orientation reliability than 15, which does not guarantee good pattern identification. Next, the grains are discretized with a misorientation angle above 10° [28], the corresponding grain boundaries are plotted as black lines on Euler angle maps. According to the color scale, two main monoclinic orientations of oxide grains differ on the Zy4 map, divided into two separate regions: left and right. On the left part, a majority of grains are colored with a shade of magenta color which supposes a small disorientation between them. The same is noted on the right part between colorful shades of yellow grains. On the oxide orientation map of Zy4-h (Fig. 12), three areas are characterized with different color sets, one on the left of the picture, named region A, another on the top-right (region B) and the third on the bottom right (region C).
Despite a more important not indexed surface region (black color) on the Zy4-h map, the orientation of oxide grains can be analyzed.
Fig. 11 - Orientation map of the transverse section plane of oxide grains grown on Zy4 sample, 1 µm above the oxide/metal interface, which is delimited on Fig 3a) with a dashed rectangular. Monoclinic phase orientations are colored as a function of the corresponding Euler angles (φ1, Φ, φ2).
Fig. 12 - Orientation map of the transverse section plane of oxide grains grown on Zy4-h sample, 1 µm above the oxide/metal interface, which is delimited on Fig 3b) with a dashed rectangular. Monoclinic phase orientations are colored as a function of the corresponding Euler angles (φ1, Φ, φ2).
The oxide textures of both samples are studied with the corresponding pole figures (PF) built from the orientation maps. To compare with literature [4,9,11], the monoclinic ZrO2 texture is studied on Fig. 13
as a function of the (111), (111�) and (002) pole positions. The fact that each main pole is restricted to the same polar angle indicates a fibre texture of the oxide grains, with a rotational freedom around a particular direction. The polar angles are similar on both oxides formed on Zy4 and Zy4-h with various azimuthal positions, meaning an equivalent growth direction. This fibre texture orientation of the corrosion layer was expected according to the literature. Whatever the Zr alloys and the metal grain orientations are, the corrosion process form a fibre texture with (10𝑚𝑚�) planes parallel to the sample surface, m = 2;3;4;5;6 [4,9-12]. Moreover, the precipitated hydride on metal surface does not alter the growth orientation of oxide grains as demonstrated with this study. The most expected growth plane is (106�) which occupy the smallest growth surface [11]. The corresponding PF series simulated by Li et al. [11] are close to both oxide PF series obtained on Zy4 and Zy4-h. Fig. 13 also shows (002) poles oriented to the 65°-70° polar angles with a low intensity, independent to the (10𝑚𝑚�) growth planes. From the orientation distribution function (ODF) calculated with HKL software these additional poles
correspond to the (613�) and (7�13) planes growing respectively on Zy4 and Zy4-h samples. They are 8° close to the minor (201�) planes previously identified on recrystallized Zircaloy-4 [31].
Fig. 13 – Pole Figures of the monoclinic oxide grains located 1 µm away the oxide/metal interface. The (111), (111�) and (002) poles are shown in color intensity levels. The (106�) pole figure shows the pole position of all indexed points with the ACOM-TEM method, the color legend correspond to the angular deviation with (106�), referred Fig. 14,15 and 16.
The (106�) PF is added on Fig. 13 with a color scale function of the polar angle. The corresponding grain positions are reported on the orientation maps of Fig. 14 with the same color scale of the (106�) PF, function of the deviation angle with the (106�) fibre component. The intensity profiles of the (106�) PF function of the polar angle are distributed on Fig. 15 for both analyzed samples. According to the maximum profile intensities, the (106�) poles of the two samples are tilted ~15° from the growth direction. The ODF analysis (not shown here) identifies a major growth plane close to (103�) on both reference Zy4 and hydrided Zy4-h samples. It could be noted that the analysis on TEM, after FIB extraction and preparation do not ensure an ideal orientation of the sample with an electron beam normal to the oxide/metal interface: a tilt error of 5° can be introduced. In the angle range of 5-20°, the high intensity testifies of the good fibre texture quality of the two samples. On Zy4-h, there are also a greater proportion of grains oriented away from the ideal conditions, close to 50-55°. It would correspond to the monoclinic (201�) deviated of 52° with (103�). According to the PF (106�) (Fig. 13), these grains are randomly oriented around this texture component on Zy4-h sample. On the orientation maps, colored function of the deviation angle to the (106�) fibre component, the 50-55° deviation angles correspond to the green grains (Fig. 14). On the pre-hydrided sample (Fig. 14b), the corresponding oxide grains seem to be preferentially distributed on the top-right region, named region B on Fig. 12, and to the interface between regions A and C. The (201�) fibre texture is however more uniformly distributed with the main texture component on reference Zircaloy-4 (Fig. 14a).
Previously, regions with different grain orientations were identified on Fig. 11 and 12, but the growth direction is in the same texture orientation on all the FIB foil of Zy4 according to Fig. 14a. On the pre-hydrided sample Zy4-h, the oxide texture is identical in each individual region A, B and C, but region A is closer to the (106�) fibre component than the two others deviated of ~10°.
Fig. 14 - Orientation maps of the monoclinic ZrO2 grains colored function of the angle deviation from
(106�) fibre component of oxide foils a) Zy4 and b) Zy4-h.
Fig. 15 - Intensity profile of (106�) pole figure (Fig. 13) function of the polar angle for both Zy4 and Zy4-h samples.
Grain boundaries component
From ACOM-TEM analysis, the HKL software allows to identify the misorientation angle between adjacent grains around a mutual axe [hkl]. The corresponding misorientation angle distribution from Zy4 and Zy4-h are compared on Fig. 16 with the disorientation directions written above the main angles. More than 46000 scanned dots are identified as grains boundaries on Zy4 sample and about 70000 are indexed as grain boundaries on Zy4-h sample, which provides a good statistic to compare both material properties. On both oxide layers from Zy4 and Zy4-h, the distribution highlights specific misorientation angles reported on Table 2. On reference Zy4, 38% are twin boundaries rotated around 90° or 180° which are characteristic of the tetragonal-monoclinic transformation on zirconium oxide. These particular angles limit species diffusion across the grain boundary due to a coherent alignment of atoms. The frequency of these specific grain boundaries is lower between adjacent oxide grains on pre-hydrided sample Zy4-h, they are replaced to less coherent misorientation angles in ranges 50° to 70° and 120° to 150°. They make up 32% of the total grain boundaries on Zy4 and increase to 44% on Zy4-h. The atom alignment of these grain boundaries are less coherent which result in higher intergranular space for oxygen diffusion. This higher proportion of desoriented oxide grain boundaries (about 35% more on pre-hydrided) can therefore be a contributing parameter to the higher corrosion kinetics in simulated PWR conditions.
Boundaries between indexed oxide grains are mapped on Fig. 17 for several misorientation angle ranges: 50°-70° in green line, 85°-95° in red line and 120°-150° in blue line. Only half maps of the scanned areas are shown for Zy4 and Zy4-h oxide samples. It can be noted a homogeneous repartition of each range of grain boundaries on both maps, meaning that each large region of similar grain orientations does not affect grain boundary properties inside and between them.
Fig. 16 - Misorientation angle distribution of the monoclinic oxide grains boundaries from Zy4 and Zy4-h. The corresponding disorientation directions are written above the main angles. The color ranges (green, red and blue) on X-axis define grain boundaries mapped on Fig. 17.
Table 2 – Proportion (in pixel numbers) of the main ranges of misorientation angle between adjacent monoclinic oxide grains, in Zy4 and Zy4-h samples.
Angular range Distribution (%)
Zy4 Zy4-h
50° - 70° 12,6 15,2
85° – 95° 29,3 18,7
120° – 150° 19,7 28,4
170° – 180° 8,6 8,6
Fig. 17 - Colored maps of oxide grain boundaries on a) Zy4 and b) Zy4-h samples, function of the misorientation angle range. Only half maps of the scanned areas are shown, a) the left part of Zy4 sample and b) the right part of the Zy4-h sample.
Discussion
Oxide grain properties on Zircaloy-4
Many authors proposed an oxide growth mechanism on Zr alloys with a first step being the nucleation of a metastable tetragonal phase. The tetragonal to monoclinic phase transformation is limited by small grain size and perhaps an oxygen sub-stoichiometry and a compressive stress. Next the growth of grains providing the smallest footprint is facilitated to limit the in-plane compressive stress. Beyond a critical size, the elongated grains transform to monoclinic oxide which adopt a (10𝑚𝑚�) fibre texture with m = 2;3;4;5;6, regardless of the Zr alloy or the initial substrate orientation. This is in agreement with the (103�) growth plane of the oxide grains studied 1 µm above the oxide-metal interface on Zy4 reference sample. Pole figures of Fig. 13 testify of a good fibre texture quality, homogeneous on all the scanned area. The grain diameter average of 34.6 nm is consistent with the literature (10-40 nm) [5,30] and valid the accuracy of the technique. However this first TEM analyses in the cutted plane parallel to the oxide-metal interface reveal that monoclinic columnar grains may not have a so systematic regular base shape as described previously. Indeed over 75-100 nm width, the drawn grain boundaries on Fig. 11 and Fig. 14a delineate more elongated base shapes with a size ratio over 2:1. According to the Fig. 17, this longer shape is always associated to a grain boundary misorientation of 90° around the [001] monoclinic lattice direction. It corresponds to the twin boundary Σ71b reported in literature [4,31] with an exact misorientation of 90.81°, usually associated to the tetragonal-monoclinic phase transformation [8,32]. These twin boundaries are parallel amongst themselves in Fig. 17 and locally grouped together which suppose that tetragonal grains are split into monoclinic grains with an elongated base shape twinned along (100) and (010) planes or (110) planes. Misorientations of 180°[101] and 180°[101�] are other well-known twin boundaries (Σ1) of the monoclinic structure. With Σ71b, theses twin boundaries make up 38% of the total boundaries, they are markers of a high concentration of grains grown with an initially tetragonal structure transformed in monoclinic phase. Oxide grain properties on pre-hydrided Zircaloy-4
Despite the 8 µm thick layer of δ-ZrH1.66 hydride precipitated on the surface, the oxidation process
leads to the similar fiber texture of the monoclinic oxide grains with (103�) parallel to the Zy4-h sample surface. It confirms the texture development model of Li et al. [11], which describes that the texture orientation mainly depends on the compressive stress rather on the substrate orientation. The additional orientation maps (function of the Euler angles and the misorientation around (106�) texture) show that grains on Zy4-h are not randomly oriented in the directions parallel to oxide-metal interface. On Fig. 12 dashed lines delineate boundary regions of Zy4-h with similarly oriented grains. Before FIB milling, the SEM image of the sample surface (Fig. 18) reveals clearly the same boundaries delineating grains of 4-5 µm width which probably correspond to the grain footprints of Zircaloy-4 metal or hydride. Even if the matching stress at the oxide-substrate interface is the main factor influencing the oxide texture orientation, the grain directions parallel to the interface still match with the substrate lattices.
Fig. 18 – SEM Image of the Zy4-h sample surface before FIB milling. The dashed rectangular delineates the surface of the oxide layer thinned and scanned 0.3 µm deeper.
Away from the ideal orientation, a small proportion of grains is observed with (201�) closely parallel to the oxide-metal interface. This weaker fibre component was detected from Garner et al. [4,29] on an oxide layer grown during aqueous corrosion of Zircaloy-4 sample. The orientation maps of the (103�) fibre component, acquired on a sample section normal to the oxide-metal interface, show a higher concentration of this misorientation close to the metal [29]. That suppose that the (201�) orientation, parallel to the surface substrate could be more favorable than the (103�) at the nucleation stage. During the corrosion process, the compressive stress slow the grain growth with this orientation to favor grains with a smaller footprint planes as (103�). However, the (201�) orientated grains may persist away from the oxide-metal interface. The larger presence of these grains in Zy4-h, quantified at the 50-55° angular position in Fig. 15, suggests a lower compression stress than in the oxide layer of the reference sample Zy4. Indeed, the high molar volume ratio between zirconia and α-Zr of 1.51 decrease to the 1.29 molar volume ratio between zirconia and ZrH1.66 (PDF n°00-034-0649 [33]),
generating a lower compressive stress close to the interface.
The tetragonal phase stability of zirconia mostly depends on the stress field [34], the additional elements [35], and the grain size [36]. According to the present study, the lower average diameter of oxide grains grown on pre-hydrided Zircaloy-4 should stabilize the tetragonal phase. But previous x-rays micro-diffraction (µXRD) measurements highlight a lower volume fraction of the tetragonal phase near the oxide-hydride interface (12%) compared to the oxide-Zircaloy-4 interface (23%) [22]. From this, the stress field is the main parameter controlling the tetragonal phase stability on Zircaloy-4. The lower fraction of stabilized tetragonal oxide during the oxidation process of Zy4-h would explain the lower concentration of the twin boundary Σ71b (misorientation of 90°[001]) associated to the tetragonal-monoclinic phase transformation (Table 2).
Corrosion kinetics correlates to the oxide grain properties
It is expected that the oxidation kinetics and hydrogen permeation are mainly controlled by the diffusion properties of the grain boundaries across the oxide layer grown on Zircaloy-4 [7]. This is supported by the fact that the grain boundary density is important because of the oxide grain dimensions are in nanometer range. We measured on reference Zy-4 a mean equivalent diameter for 34.6 nm for the columnar grain width grown in pre-transition stage, consistent with literature [3,5]. The
present study highlighted that massive precipitated hydride on Zircaloy-4 surface decreases the grain distribution to the lower grain sizes which is presumably harmful for corrosion resistance : Even not counting grain sizes below 15 nm, over 50% of the 15000 indexed grains are sized below 50 nm width which decreases the average grain diameter to 27.8 nm. Assuming that the grain boundary misorientation distribution is similar on both oxide layers Zy4 and Zy4-h, the smaller oxide grain size on pre-hydrided would offer a wider surface of diffusion path through the oxide layer, with higher grain boundary proportion bringing more oxygen to accelerate nucleation and growth mechanisms of oxide grains at the oxide-metal interface. Consequences on oxygen diffusion profiles were simulated with finite element calculations. On the first 0.2 µm of the oxide surface (Fig. 10) the higher calculated concentration compared to experiment indicate that the diffusion coefficient ratio between boundaries and bulk is more than 103. That confirms that grain boundary diffusion is the principal contributor to the
diffusion properties of zirconia. The 6h simulated isotopic exchanges confirm the higher apparent diffusion coefficient of oxygen through the oxide layer grown on pre-hydrided Zircaloy-4, with 1.3 ratio. This value is lower than 1.8 ratio, calculated from experiments, and suggest that other parameters are relevant into the oxygen diffusion mechanism through zirconia. Also, modeling of numerical grains results in a size distribution according to a narrow Gaussian shape while the experimental grain size distribution (Fig. 6) is described as a strong irregular Gaussian-like function with a staggering to larger diameters. This morphology is important, it influence the grain boundary surface fraction described with a 1/x type-function: more assymetrical to large sizes it is, the lower the surface fraction. Then, the wider grain size dispersion on Zy4 compared to Zy4-h will more decrease the grain boundary surface fraction. As a consequence the surface fraction ratio of 1.26, calculated to model the diffusion mechanism, is underestimated. The apparent diffusion coefficient deduced from simulation would be higher, close to the 1.6 surface fraction ratio previously calculated between both pre-hydrided and reference Zircaloy-4 samples with the grain size distributions of Fig. 6. This value is close to the 1.8 apparent diffusion coefficient ratio of oxygen deduced from the experimental 18O concentration profiles
[22], which confirms that grain boundaries are the principal contributors to the oxygen diffusion rate through zirconia. Moreover, this study highlights that precipitation of massive hydrides close to the oxide-Zircaloy-4 interface attributes a major role to grain size reduction in acceleration of corrosion kinetic in PWR conditions.
Oxide grains smaller than 15 nm width are deliberately excluded from the study which could explain the small remaining gap. Also, Tupin and Bisor [22] speculate that the higher corrosion rate on pre-hydrided samples could be attributed to larger interatomic spaces between adjacent oxide grains. Indeed, the grain boundary surface fraction ratio does not take into account modification of the boundary misorientation distribution between both samples. The present study investigated the grain boundary misorientation distribution and it variation due to the hydride precipitation. Related to the polycrystal texture, the oxide grain boundary misorientations are not randomly distributed, Fig. 16 highlighted four preferential occurrences of misorientations: 50°-70°, 90°, 120°-150°, and 180°. The grain boundary misorientations of 90°[001], 180°[101] and 180°[101�] correspond to twins resulting from the tetragonal-monoclinic phase transformation. It forms an almost single-crystal structure where two crystals match perfectly with an extremely low interfacial energy. Then the high activation energy for diffusion across twin boundaries predicts to hinder the diffusion of corrosive species through the oxide. They composed 38% of the total grain boundary network through the oxide grown in pre-transition phase on Zircaloy-4, but decrease to 27% on pre-hydrided Zircaloy-4 probably due to a lower initial formation of tetragonal phase. However, experiments revealed hydride precipitation increases the misorientation fraction of adjacent oxide grains in ranges of 50°-70° and 120°-150°. All
the possible lattice matching between both monoclinic grains of ZrO2 were theoretically studied from
Gertsman [31]. But the 60° misorientation angle as the range angle of 120-150° are not mentioned among the coincidence site lattice misorientations, the except the misorientations 143.1°[106] and 143.1°[106�] as Σ1 and Σ30. That supposes that these ranges of misorientation angles could correspond to boundaries formed during the corrosion process, from the symmetry of the initial ZrO2
tetragonal structure. The corresponding misorientation angles are delineated with green lines (50°-70°) and blue lines (120°-150°) on Fig. 17. By comparing the equivalent position of these boundaries on the grain orientation maps (Fig. 11 and Fig. 12), it is noted that these grains boundaries separate the same two grain orientations in each large region of both samples. An example, purple grains and yellow grains in region C of Zy4-h are misoriented with an angle range of 130°-150°. Of the two grain orientations, one dominate on Zy4 (Fig. 11) but both are equal area on Zy4-h sample (Fig. 12) which increases their boundary proportions and then explains the higher misorientation fraction in ranges of 50°-70° and 120°-150°, from 32% in Zy4 to 44% in Zy4-h. Contrary to the 90° and 180° twin boundaries, these less coherent boundaries are expected to have lower activation energy for diffusion of corrosion species. This implies that the misorientation in ranges of 50°-70° and 120°-150° are also contributors which control the diffusion properties through zirconia. Their existence and their concentration will influence the corrosion kinetics rate of the oxide-metal interface on Zircaloy-4. Then the variation in the boundary character distribution contributes to the higher apparent diffusion coefficient of oxygen, calculated across pre-hydrided oxide, with a 1.8 ratio [22].
Grain properties investigation with ACOM-TEM
Automated crystal orientation mappings with TEM of oxide layers normal to the element diffusion direction led to index respectively 9000 and 15000 oxide grains on reference and pre-hydrided Zircaloy-4 samples that have dimensions in nanometer range. The analyses demonstrate that the ~30 µm2 scanned areas were sufficient to investigate the texture even if oxide orientation relations
rotated around the growing direction are missing. That underlines the plane view investigation must be complete with a cross-section analysis to exploit the growth relation with α-Zr orientation and the oxide microstructure evolution as Garner realized [4]. However, due to the nanometer grain size and the columnar grain shape according to the growth direction, the grain covering proportion is high across the FIB foil and will create indexing errors of the structure or orientation with the automated indexing software. Then TEM planar view investigation is powerful to limit grain overlapping and is the only way to investigate the grain boundary network which controls the corrosion kinetic of Zr alloys, depending of: grain shapes, grains size distribution and grain boundary misorientation distributions analysis.
Conclusion
A detailed study of the zirconium oxide grain sizes and orientations using Automated Crystal Orientation Mapping on TEM has been performed for the pre-transition oxide phase formed on a reference Zircaloy-4 (Zy4) and on a pre-hydrided Zircaloy-4 (Zy4-h) which exhibits a higher corrosion kinetics. Respectively 9000 and 15000 oxide grains were indexed on Zy4 and Zy4-h, 1 µm above the oxide-metal (-hydride) interface, on the section plane normal to the growth direction which offer a high statistical analysis.
The study confirmed the strong fibre texture of the zirconia layer with (103�) parallel to the oxide-metal interface, without significant changer on pre-hydrided sample. It is attributed to the accumulating planar stress during the corrosion process. The planar direction of oxide grains seems however to be influenced also by the lattice substrate. In addition, a second weaker fibre texture with (201�) nearly parallel to the growth plane is identified, which probably match more with the lattice substrate at the nucleation stage. The higher proportion of this weaker fibre texture formed on pre-hydrided Zircaloy-4 suggests a lower compression stress than in the oxide layer grown on Zircaloy-4, because of a smaller molar volume increase between ZrO2 and ZrH1.66. This suggestion is supported by lower stability of
the metastable tetragonal phase close to the interface with massive hydride, previously defined from µ-XRD analysis. Moreover, the analysis of the grain boundary misorientation distribution highlighted on the pre-hydrided sample a lower concentration of the twin boundaries rotated by 90° and 180°, associated to the tetragonal-monoclinic phase transformation.
Consequently, this study highlighted that hydride precipitation increases the fraction of less coherent oxide grain boundaries. The proportion of boundaries misoriented in ranges of 50°-70° and 120°-150° rise from 32% in Zy4 to 44% in Zy4-h. The potential consequence is a higher interatomic space between adjacent grains in pre-hydrided Zircaloy-4 which would promote diffusion of oxygen and hydrogen, and then increase the corrosion kinetics. According to the oxide grain size investigation, this variation is combined with a higher density of grain boundaries on pre-hydrided Zircaloy-4, which increase the diffusion number of paths. The average columnar grain width decreases from 34.6 nm on reference to 27.8 nm on pre-hydrided sample with a less spread distribution to large sizes. This study also highlighted that the columnar width is not always regular but elongated for larger grains. Consequently, this 60% rise of the grain boundary surface fraction, coupled with the less protective character of the boundaries themselves, can explain the higher apparent diffusion coefficient of oxygen calculated through pre-hydrided oxide, with a 1.8 ratio from SIMS analysis. Based on the results mentioned above, this behavior would to be related to a lower compression stress of zirconia with hydride substrate which has to be investigated with µ-DRX experiments. In addition, the modeling results confirm that oxygen transport occurs principally through grain boundaries with a diffusion coefficient more than 103 times higher than those for bulk diffusion.
The precipitation of the massive hydride close to the oxide-Zircaloy-4 interface leads to a major role in increasing grain boundary density and leading to larger mismatches between adjacent grains that could contribute to accelerate the corrosion kinetics in PWR conditions.
References
[1] Motta, A.T., Yilmazbayhan, A., Comstock, R.J., Partezana, J., Sabol, G.P., Lai, B., Zhonghou, C., " Microstructure and Growth Mechanism of Oxide Layers Formed on Zr Alloys Studied with Micro-beam Synchrotron Radiation," Zirconium in the Nuclear Industry: Fourteenth International Symposium, ASTM STP 1467, P. Rudling and B. Kammenzind, Eds., American Society for Testing and Materials International, 2005, pp. 205-232.
[2] Motta, A.T., Da Silva, M.J.G., Yilmazbayhan, A., Comstock, R.J., Cai, Z., Lai, B., " XXX," 15th International Symposium on Zr in the Nuclear Industry, Sunriver, OR, United States, American Society for Testing and Materials ASTM STP 1505, 2009, pp. 486–506.
[3] A. Yilmazbayhan, A., Breval, E., Motta, A.T., Comstock, R.J., "Transmission electron microscopy examination of oxide layers formed on Zr alloys," Journal of Nuclear Materials 349 (2006) pp. 265– 281.
[4] Garner, A., Gholinia, A., Frankel, P., Gass, M., MacLaren, I., Preuss, M., "The microstructure and microtexture of zirconium oxide films studied by transmission electron backscatter diffraction and automated crystal orientation mapping with transmission electron microscopy," Acta Materiala 80 (2014) pp. 159-171.
[5] de Gabory, B., Motta, A.T., Wang, K., "Transmission Electron Microscopy Characterization of Zircaloy-4 and ZIRLO™ Oxide Layers," Journal of nuclear Materials 456 (2015) pp. 272-280.
[6] Ni, N., Lozano-Perez, S., Jenkins, M.L., English, C., Smith, G.D.W., Sykes, J.M., Grovenor, C.R.M., " Porosity in Oxides on Zirconium Fuel Cladding Alloys, and its Importance in Controlling Oxidation Rates," Scripta Materialia 62 (2010) pp. 564-567.
[7] Godlewski, J., Gros, J., Lambertin, M., Wadier, J., Weidinger, H., "Raman spectroscopy study of the tetragonal-to-monoclinic transition in zirconium oxide scales and determination of overall oxygen diffusion by nuclear analysis of O(18)", Zirconium in the Nuclear Industry: 9th International Symposium, ASTM STP 1132, 1991, pp. 416–436.
[8] Platt, P., Frankel, P., Gass, M., Howells, R., Preuss, M., "Finite Element Analysis of the Tetragonal to Monoclinic Phase Transformation during Oxidation of Zirconium Alloys," Journal of nuclear Materials 454 (2014) pp. 290-297.
[9] Lin, J., Li, H., Nam, C., Szpunar, A., " Analysis on Volume Fraction and Crystal Orientation relationship of Monoclinic and Tetragonal Oxide grown on Zr-2.5Nb alloy," J. of Nuclear Materials 334 (2004) pp. 200-206.
[10] Pétigny, N., Barberis, P., Lemaignan, C., Valot, C., Lallemant, M., "In situ XRD Analysis of the Oxide Layers Formed by Oxidation at 743 K on Zircaloy 4 and Zr-1NbO," Journal of Nuclear Materials 280 (2000) pp. 318-330.
[11] Li, H., Glavicic, M.G., Szpunar, J.A., " A model of texture formation in ZrO2 films," Materials Science and Engineering A366 (2004) pp. 164–174.
[12] Roy, C., David, G., "X-ray Diffraction Analyses of Zirconia Films on Zirconium and Zircaloy-2," Journal of Nuclear Materials 37 (1970) p.71.
[13] Bossis, P., Pecheur, D., Hanifi, K., Thomazet, J., and Blat, M., "Comparison of the high burn-up corrosion on M5 and low tin Zircaloy-4," Zirconium in the Nuclear Industry: Fifteenth International Symposium, ASTM STP 1467, P. Rudling and B. Kammenzind, Eds., ASTM International, West Conshohocken, PA, 2005, pp. 494-525.
[14] Garzarolli, F., Broy, Y., Busch, R.A., "Comparison of the longth-time corrosion behavior of certain Zr allays in PWR, BWR and laboratory tests," Zirconium in the Nuclear Industry: 11th International Symposium, ASTM STP 1295, E.R. Bradley and G.P. Sabol, Eds, ASTM International, West Conshohocken, PA, 1995, pp.494-525.
[15] Iltis, X., Lefebvre, F., and Lemaignan, C., « Microstructure Evolutions and Iron Redistribution in Zircaloy Oxide Layers: Comparative Effects of Neutron Irradiation Flux and Irradiation Damages,” Zirconium in the Nuclear Industry: Eleventh International Symposium, ASTM STP 1295, 1996, pp. 242-264.
[16] Lemaignan, C., “Physical Phenomena Concerning Corrosion Under Irradiation of Zr Alloys,” Zirconium in the Nuclear Industry: Thirteenth International Symposium, ASTM STP 1423, 2002, pp. 20-29.
[17] Garzarolli, S., Stehle, H., and Steinberg, E., “Behavior and Properties of Zircaloys in Power Reactors: A Short Review of Pertinent Aspects in LWR Fuel,” Zirconium in the Nuclear Industry: Eleventh International Symposium, ASTM STP 1295, 1996, pp. 12-32.
[18] Kim, Y.S., Rheen, K.S., and Min, D.K., “Phenomenological Study of In-Reactor Corrosion of Zircaloy-4 in Pressurized Water Reactors,” Zirconium in the Nuclear Industry: Tenth International Symposium, ASTM STP 1245, 1994, pp. 745-759.
[19] Blat, M., and Noel, D., “Detrimental Role of Hydrogen on the Corrosion Rate of Zirconium Alloys,” Zirconium in the Nuclear Industry: Eleventh International Symposium, ASTM STP 1295, 1996, pp. 319-337
[20] Garde, A.M., “Enhancement of Aqueous Corrosion of Zircaloy-4 Due to hydride precipitation at the Metal-Oxide interface,” Zirconium in the Nuclear Industry: Ninth International Symposium, ASTM STP 1132, 1991, pp. 566-594.
[21] Blat, M., Legras, L., Noel, D., Amanrich, H., "Contribution to a Better Understanding of the Detrimental Role of Hydrogen on the Corrosion Rate of Zircaloy-4 Cladding Materials," Zirconium in the Nuclear Industry: twelfth International Symposium, ASTM STP 1354, 2000, pp. 563–591.
[22] Tupin, M., Bisor, C., Bossis, P., Chêne, J., Béchade, J.L., Jomard, F., " Mechanism of corrosion of zirconium hydride and impact of precipitated hydrides on the Zircaloy-4 corrosion behavior", Corrosion Science 98 (2015) 478-493.
[23] Rauch, E.F., Véron, M., Portillo, J., Bultreys, D., Maniette, Y., Nicolopoulos, S., "Automatic Crystal Orientation and Phase Mapping in TEM by Precession Diffraction," Microsc Anal, 22 (2008), pp. S5-S8.
[24] Y. Dali, M. Tupin, P. Bossis, M. Pijolat, Y. Wouters, F. Jomard, J. Nucl. Mater. 426 (2012) 148– 159.
[25] Rauch, E.F., Véron, M., "Automated crystal orientation and phase mapping in TEM," Materials Characterization 98 (2014) pp. 1-9.
[26] Trimby, P. W., "Orientation mapping of nanostructured materials using transmission Kikuchi diffraction in the scanning electron microscope," Ultramicroscopy, 120 (2012) pp. 16-24.
[27] Yashima, M., Hirose, T., Katano, S., Suzuki, Y., Kakihana, M., Yoshimura, M., "Structural-Changes of ZrO2-CeO2 Solid-Solutions around the Monoclinic-Tetragonal Phase-Boundary,"
Condensed Matter and Materials Physics, 51, 8018 (1995).
[28] Saylor, D.M., Dasher, B.S., Adams, B.L., Rohrer, G.S., "Measuring the five-parameter grain-boundary distribution from observations of planar sections", Metal Mater Trans A 35, (2004) pp. 1981-1989.
[29] Garner, A., Preuss, M., Frankel, P., "A Method for Accurate Texture Determination of Thin Oxide Films by Glancing-Angle Laboratory X-Ray Diffraction," Journal of Applied Crystallography (2014) 47, pp. 575-583.
[30] Spengler, D.J., Motta, A.T., Bajaj, R., Seidensticker, J.R., Cai, Z., "Characterization of Zircaloy-4 Corrosion Films Using Microbeam Synchrotron Radiation," Journal of Nuclear Materials 464 (2015) pp. 107–118.
[31] Gertsman, V.Y., Zhilyaev, A.P., Szpunar, J.A., "Grain Boundary Misorientation distributions in Monoclinic Zirconia," Modeling ans Simulation in Materials Science and Engineering, 5 (1997) pp. 35-52.
[32] Bailey, J.E., "The Monoclinic-Tetragonal Transformation and Associated Twinning in Thin Films of Zirconia," Proceedings of the Royal Society of London. Series A, Mathematical and Physical Sciences, 279 (1964) p. 395.
[33] International Centre for Diffraction Data. The Powder Diffraction file; 2006.
[34] Wei, J., Frankel, P., Polatidis, E., Blat, M., Ambard, A., Comstock, R.J., Hallstadius, L., Hudson, D., Smith, G.D.W., Grovenor, C.R.M., Klaus, M., Cottis, R.A., Lyon, S., Preuss,M., "The effect of Sn on autoclave corrosion performance and corrosion mechanisms in Zr–Sn–Nb alloys, " Acta Materialia 61 (2013) pp. 4200–4214.
[35] Garvie, R.C., "Stabilization of the tetragonal structure in zirconia microcrystals," The Journal of Physical Chemistry, vol. 82, N°2, 1978, pp. 218-224.
[36] Polatidis, E. Frankel, P. Wei, J. Klaus, M. Comstock, R.J. Ambard, A., Lyon, S., Cottis, R.A., Preuss, M., "Residual stresses and tetragonal phase fraction characterisation of corrosion tested Zircaloy-4 using energy dispersive synchrotron X-ray diffraction," Journal of Nuclear Materials 432 (2013) pp. 102–112.


![Fig. 10 - Comparison between the simulated 18 O concentration profiles after diffusing for 6h and the experimental 18 O concentration profiles obtained by SIMS after isotopic exchange for 24h [22]](https://thumb-eu.123doks.com/thumbv2/123doknet/12991428.379339/15.892.157.750.162.590/comparison-simulated-concentration-profiles-diffusing-experimental-concentration-profiles.webp)