HAL Id: hal-00003882
https://hal.archives-ouvertes.fr/hal-00003882
Submitted on 12 Jan 2005
HAL is a multi-disciplinary open access
archive for the deposit and dissemination of
sci-entific research documents, whether they are
pub-lished or not. The documents may come from
teaching and research institutions in France or
abroad, or from public or private research centers.
L’archive ouverte pluridisciplinaire HAL, est
destinée au dépôt et à la diffusion de documents
scientifiques de niveau recherche, publiés ou non,
émanant des établissements d’enseignement et de
recherche français ou étrangers, des laboratoires
publics ou privés.
in alpha-Al2O3 probed by x-ray absorption near edge
structure combined with first-principles calculations
Emilie Gaudry, Delphine Cabaret, Philippe Sainctavit, Christian Brouder,
Francesco Mauri, José Goulon, Andrei Rogalev
To cite this version:
Emilie Gaudry, Delphine Cabaret, Philippe Sainctavit, Christian Brouder, Francesco Mauri, et al..
Structural relaxations around Ti, Cr and Fe impurities in alpha-Al2O3 probed by x-ray absorption
near edge structure combined with first-principles calculations. Journal of Physics: Condensed Matter,
IOP Publishing, 2005, 17, pp.5467-5480. �10.1088/0953-8984/17/36/003�. �hal-00003882�
ccsd-00003882, version 1 - 12 Jan 2005
Structural relaxations around Ti, Cr and Fe impurities in α-Al
2O
3probed by x-ray
absorption near edge structure combined with first-principles calculations
Emilie Gaudry, Delphine Cabaret, Philippe Sainctavit, Christian Brouder, Francesco Mauri,
Laboratoire de Min´eralogie-Cristallographie UMR CNRS 7590, Universit´e Pierre et Marie Curie,
case 115, 4 place Jussieu F-75252 Paris Cedex 05, France
Jos´e Goulon, Andrei Rogalev
European Synchrotron Radiation Facility BP 220, F-38043 Grenoble Cedex, France
(Dated: January 12, 2005)
We determine the structural relaxations around paramagnetic impurities (Ti, Cr, Fe) in corundum (α-Al2O3), by combining x-ray absorption near edge structure (XANES) experiments and ab initio
calculations. The structural relaxations are found to be very local. We then show that XANES is sensitive to small variations in interatomic distances within the coordination shell of the absorbing atom. The experiments were carried out on single crystals of ruby and sapphires. Linear dichroic signals are essential to characterize the geometry of the impurity site. The calculations were per-formed within a self-consistent “non muffin-tin” framework, that uses pseudopotentials, plane-wave basis set, and the continued fraction for the absorption cross section.
PACS numbers: 61.72.-y,78.70.Dm,71.15.Mb,61.66.-f,85.40.Ry
Keywords: XANES, K edge, ab initio, pseudopotentials, ruby, sapphires, impurities, structural relaxation, angular dependence
I. INTRODUCTION
The presence of impurities in a crystal can influence its mechanical, magnetic, semiconducting, superconducting, dielectric, spectroscopic and transport properties. To cite just a few specific examples, impurities can improve the voltage holdoff capability of insulating materials1, they
are critical for the optical properties of most laser mate-rials and gemstones, and they turned out to be the secret of ancient Damascus steel blades.2
Still, the physics of impurity systems is not well de-veloped. The local crystallographic structure around im-purities is unknown in most cases, although it is an es-sential piece of information to undestand their influence on the physical properties of the host and to carry out ab initiosimulations of these materials. This situation is due to the experimental and theoretical difficulties that are met to obtain microscopic information on impurity systems. From the theoretical point of view, quantum calculations of impurity systems require the use of large supercells that have long not been computationally man-ageable. From the experimental point of view, impurity systems can only be measured with methods which can selectively probe certain atomic species. Among such methods, many of them, such as electronic paramagnetic resonance, give only indirect information on the position and nature of the atoms surrounding the impurity. Due to the advent of third-generation synchrotron radiation facilities, x-ray absorption spectroscopy (XAS) is now able to investigate impurities in solids.
The extended x-ray absorption fine structure (EX-AFS) region of a XAS spectrum provides quantitative
information about the short range organization around the absorbing atom (coordination number, interatomic distances). The x-ray absorption near-edge structure (XANES) region usually gives qualitative information about the atomic arrangement up to the medium range order. XANES is sensitive to the electronic structure (bonding) and probes the empty states of solids. In the case of dilute elements in single crystals, especially at the K edge of 3d transition elements, collecting EXAFS spectra with a good signal-to-noise ratio is a difficult task, because the intensity of diffraction peaks becomes much larger than the EXAFS signal. Taking the example of impurities in corundum α-Al2O3,3good EXAFS spectra
could be collected for 10000 wt.ppm Cr3+impurities, but
the usable energy range obtained for 1500 wt.ppm Fe3+
impurities was already quite limited, and the concentra-tion of coloring impurities is often an order of magnitude lower than this. In such cases, XANES becomes a prac-ticle and precious technique to get information about the local structure of the absorbing atom.4However, the
an-alyzis of the experimental XANES data is not straight-forward because of the photoelectron multiple-scattering processes that occur in the near-edge region. Ab initio XANES simulations are then required to relate the ex-perimental spectral features to the local geometry around the aborbing atom.
Recently, an efficient first-principle approach based on plane-wave pseudopotential formalism has been devel-oped to calculate K-edge XANES spectra.5 Here we
ap-ply this method to the K-edge of substitutional param-agnetic impurities in aluminum oxide. More precisely, we investigate the structural modifications of the corundum
crystal structure induced by the presence of substitu-tional Ti3+, Cr3+or Fe3+. This system is chosen because
corundum containing transition metal impurities is im-portant for laser applications and as gemstones. Colorless corundum (α-Al2O3) becomes red ruby, pink sapphire, or
yellow sapphire when a small amount of Cr3+, Ti3+, or
Fe3+ ions substitute for Al3+ ions, respectively.6,7 The
color of blue sapphire is due to the presence of (Fe-Ti) pairs in α-Al2O3.
For this investigation, polarized XANES spectra are measured and calculated. Corundum belongs to the trig-onal Bravais lattice, the optical axis being parallel to the [111] direction of the trigonal unit cell (i.e. to the c-axis of the hexagonal cell). Corundum is then a dichroic com-pound in the electric dipole approximation. The dichroic signal is a direct signature of the departure of the im-purity site from octahedral symmetry.3 XANES
calcu-lations are performed from structural models resulting from ab initio energy minimization calculations. The agreement of our experimental and theoretical spectra demonstrates that precise structural information can be extracted from the anglular-dependent XANES spectra, provided the electronic potential is accurately modelled.
II. EXPERIMENTS
A. Crystallographic structure of α-Al2O3 and
samples description
Corundum (α-Al2O3) belongs to the R¯3c (D63d) space
group.8The trigonal unit cell contains two Al
2O3formula
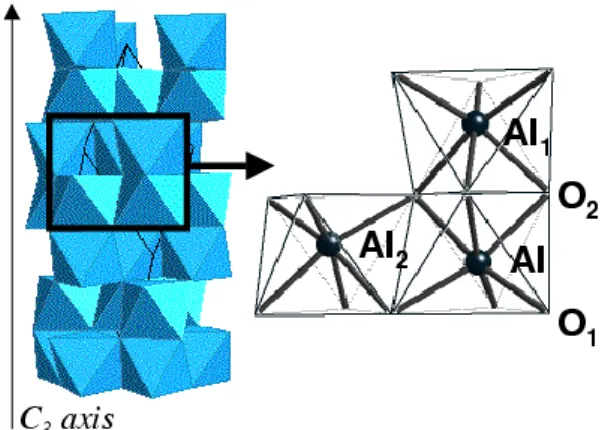
units. The atomic environment of aluminum is illustrated in Fig. 1. The atomic site of aluminum is a distorded oc-tahedron with a 3 (C3) local point symmetry. The AlO6
octahedron is characterized by two different Al-O inter-atomic distances. If we consider that the absorbing atom is denoted by Al in Fig. 1, the nearest three oxygen atoms are labeled O1in Fig. 1. The farther three oxygen atoms,
labeled O2, form a face shared by two octahedra along
the three-fold symmetry axis. Beyond the coordination shell of aluminum, the next two neighbors are aluminum atoms, labeled Al1 and Al2 in Fig. 1, and are relative
to face-shared octahedra and edge-shared octahedra, re-spectively.
Three synthetic single crystals of doped α-Al2O3
(ob-tained by the Verneuil process) are used for this study: a red ruby (α-Al2O3:Cr3+), a blue sapphire (α-Al2O3
:Fe-Ti) and a pink sapphire (α-Al2O3:Ti3+). The impurity
concentration in each sample is given in table I. They are measured with the Cameca Microbeam electron micro-probe at the CAMPARIS analytical facility of Paris. A 30 kV acceleration with a 15 nA beam current, defocused to 10µm, is used. X-ray intensities are corrected for dead-time, background, and matrix effects using the Cameca ZAF routine. The standards used are α-Al2O3, α-Cr2O3,
α-Fe2O3 and TiO2. The blue sapphire sample is
cho-sen to reprecho-sent the model compound of iron impurity
FIG. 1: Aluminum atomic site in corundum. Left: the corun-dum structure is represented as a stacking of AlO6 octahedra
(the trigonal cell and the three-fold symmetry axis are indi-cated). Right: zoom of the black-framed region of the left panel. The aluminum site with its O1, O2, Al1 and Al2 first
four neighbors are indicated.
in corundum (α-Al2O3:Fe3+). It is indeed preferred to a
yellow sapphire sample, that only contains iron impuri-ties, because synthetic yellow sapphires are known to be inhomogeneous.9Consequently, in this study, we assume
that the low concentration of titanium (750 wt.ppm) compared to that of iron (1500 wt.ppm) does not affect the site relaxation around iron.
TABLE I: Impurity concentration (in wt.ppm) in the three doped α-Al2O3 samples.
Samples Cr (wt.ppm) Fe (wt.ppm) Ti (wt.ppm) Red ruby 10000 (± 1000) - -Blue sapphire - 1500 (± 50) 750 (± 30) Pink sapphire - - 540 (± 30)
The samples are cylindrically shaped: 15 mm diame-ter and 3 mm thickness for the ruby sample, and 5 mm diameter and 1 mm thickness for the sapphire samples. They are cut so that the optical axis is in the plane of the disk surface, and the [10¯1] direction of the trigonal cell is orthogonal to the disk surface.
B. X-ray absorption measurements
X-ray absorption measurements are carried out at the European Synchrotron Radiation Facility (ESRF) on the ID12 beam line, which is dedicated to polarization depen-dent spectroscopies.10,11The monochromatic x-ray beam
is obtained through a double Si(111) crystal monochro-mator, with a resolution ∆E/E ≃ 10−4. The oriented samples are placed on a rotating holder with the normal of the disk surface parallel to the x-ray wave vector and to the rotation axis. The fluorescence intensity is mea-sured by eight detectors symmetrically set around the
3 x-ray beam.
XANES spectra are recorded for several angles θ be-tween the optical axis of the sample and the x-ray polar-ization vector. We note σk and σ⊥ the absorption cross
section obtained with θ = 0◦ and θ = 90◦, respectively.
In the electric dipole approximation, the isotropic sig-nal is given by (σk+ 2σ⊥)/3, and the dichroic signal is
given by the difference σk− σ⊥. The measurement of
x-ray absorption spectra of impurities in crystals is im-peded by the presence of large diffraction peaks. In order to decrease the intensity of diffraction peaks and elastic scattering, V and Mn filters (50 µm width) are used for the Cr K edge in ruby and the Fe K edge in blue sap-phire, respectively. By so doing, the spectra recorded for the two angles θ = 0◦ and θ = 90◦ are not affected by
diffraction peaks. On the contrary, no filter is available for the Ti K edge and the absorption was measured for 100 angles θ from 0 to 360◦. The σk and σ⊥ spectra are
reconstructed from this amount of data by using a Fourier decomposition to remove the contribution of diffraction peaks to the spectra.
C. Calculation methods
The starting point of any XANES ab initio calculation is a structural model. Two structural models are consid-ered for each compound. The first one, called non-relaxed model, corresponds to the substitution of one aluminum atom by one impurity Ti, Cr or Fe in the α-Al2O3,
with-out relaxing its structure. The second one, called relaxed model, is the result of ab initio energy minimization culation carried out on the non-relaxed model. This cal-culation is performed using Car-Parrinello molecular dy-namics with simulated annealing12as implemented in the
CPMDcode.13 The XANES calculations are then carried out within the scheme of the PARATEC code,14 using the
formalism described in Ref.5Both codes are based on the
density functional theory (DFT) within the spin polar-ized local density approximation (LSDA), and use plane-wave basis set and norm-conserving Troullier-Martins pseudopotentials15 in the Kleinman-Bylander form.16 In
the following, we give all the parameters used in both kinds of calculation.
1. Structural model construction
The structural models are constructed from the lattice parameters and atomic positions resulting from a previ-ous ab initio calculation, performed by Duan et al.17,18in
α-Al2O3. In Ref.17, the trigonal unit cell parameters are
aR = 5.11 ˚A and α = 55.41◦, the aluminum atoms are
in 4 c symmetry sites19 with x = 0.352 and the oxygen
atoms are in 6 e symmetry sites19 with x = 0.555. We
verify by using CPMD that this corundum optimized struc-ture obtained by Duan et al. corresponds to atomic forces less than 2.10−3 Ry/˚A. Since we use periodic
bound-ary conditions, we consider 2 × 2 × 2 supercells. The supercells contain 80 atoms: 48 oxygen atoms, 31 alu-minum atoms and 1 transition metal atom (Ti, Cr or Fe) in substitution for aluminum. With such large super-cells, the interaction between two impurities (belonging to two neighboring cells) is negligible. These supercells define the non-relaxed models mentioned above. The re-laxed models are obtained by minimization of the energy of the non-relaxed supercells. All atoms are allowed to relax, while the lattice constants are fixed. The impuri-ties considered in this study are known to be in a high-spin state,20therefore the spin multiplet imposed on the
trivalent impurities are S=1 2 for Ti
3+ ([Ar]4s03d1), S=3 2
for Cr3+ ([Ar]4s03d3), and S=5 2 for Fe
3+ ([Ar]4s03d5).
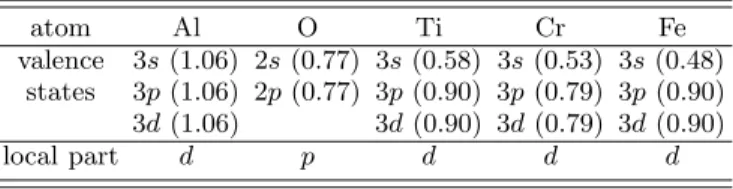
The parametrization of the norm-conserving Troulliers-Martins pseudopotentials is given in Table II. The wave functions and the charge density were expanded in plane waves with cutoff of 80 Ry and 320 Ry, respectively. Since the supercell is rather large, and since the systems are in-sulating materials, the Brillouin zone is only sampled at the Γ point.
TABLE II: Parametrization used for the generation of the pseudopotentials. The core radii of the valence states are indicated between parenthesis in ˚A.
atom Al O Ti Cr Fe valence 3s (1.06) 2s (0.77) 3s (0.58) 3s (0.53) 3s (0.48) states 3p (1.06) 2p (0.77) 3p (0.90) 3p (0.79) 3p (0.90) 3d (1.06) 3d (0.90) 3d (0.79) 3d (0.90) local part d p d d d 2. XANES calculations
The method used for XANES calculations has been al-ready described in Ref.5,21 Therefore its main aspects
are recalled here. The method uses periodic bound-ary conditions, plane-wave basis-set, pseudopotentials and reconstructs all-electron wave functions within the projector augmented wave (PAW) framework.22 In
or-der to allow the treatment of large supercells (hundreds of atoms), the scheme uses a recursion method to con-struct a Lanczos basis and then compute the cross sec-tion as a continued fracsec-tion,23,24 in the electric dipole
and quadrupole approximations.25 Electric quadrupole
transitions are relevant for the pre-edge region, in par-ticular at the K-edge of transition metals. The absorp-tion cross secabsorp-tion is calculated beyond the “muffin-tin” approximation, that is known to limit the applications of the multiple scattering theory traditionally used for XANES simulations.26,27,28
XANES spectra are computed at the transition metal K edge for both relaxed and non-relaxed models of the three compounds, using the 80-atom supercells described in the previous subsection. For the pseudopotentials con-struction, we again use the parametrization given in
Ta-0 10 20 30 40 Energy (eV) 0.4 0.6 0.8 1 Cr Fe Ti Γ/2 (eV)
FIG. 2: Energy dependence of the γ parameters used for the convolution of the XANES spectra at the Ti, Cr and Fe K edges in doped α-Al2O3. The zero in the energy scale refers
to the highest occupied level in the corresponding structure.
ble II. In order to take into account the core-hole effects in the calculations, the Ti, Cr and Fe pseudopotentials are generated with only one 1s electron. The spin multi-plet degeneracy is set by imposing the number of up and down states given by the CPMD code. Convergence of the XANES theoretical spectra is reached for the following set of parameters: a 64 Ry energy cutoff and one k-point for the self-consistent spin-polarized charge density calcu-lation, and 32 k-points29for the absorption cross section
calculation. An energy dependent broadening parameter γ is used in the continued fraction (see Ref.5,21) in
or-der to account for the two main photoelectron damping modes.30 This width γ corresponds through the
time-energy uncertainty relations to a lifetime of the photo-electron. At low energy, the lifetime of the photoelectron is only limited by the core-hole lifetime within the plas-mon pole approximation. The parameter γ was then set to a constant, which corresponds to K level full width at half maximum given by Krause and Oliver.31 At higher
energy, the kinetic energy of the photoelectron is great enough so that it can interact with the electron gas of the system. Its amplitude is damped, provoking a sharp decrease in the lifetime. Therefore the γ parameter was set to rapidly increase, and then to have a smooth linear behaviour. The γ energy-dependent parameters used in this study are displayed in Fig. 2.
III. RESULTS AND DISCUSSION
This section is organized as follows. First, we present the results of the structural relaxation around the substi-tutional Ti3+, Cr3+and Fe3+ions in α-Al
2O3(Sec.III A).
Second, we discuss the influence of the core-hole ef-fects in the case of the Cr K-edge in ruby (Sec.III B). Third, we confront with experiments the calculated spec-tra obtained with both relaxed and non-relaxed models (Sec.III C).
A. Structural model analysis
The relaxed models of α-Al2O3:Cr3+ and
α-Al2O3:Fe3+are already described and discussed in a
pre-vious work.3 However, in order to compare with the
re-laxedmodel of α-Al2O3:Ti3+, most of the results of Ref.3
are recalled here.
The analysis of the relaxation can only be done by care-ful comparison of the relaxed and non-relaxed supercells. This is achieved by comparing clusters that are built from the supercells using the method detailed in Ref.3
These clusters are centered on the impurity and contain 66 atoms (5.2 ˚A radius). In order to avoid the influence of the impurity displacement in the relaxed model, we define the mass center Ω of each cluster by calculating
~
OΩ = P1
imi
P
imiOM~ i, where O is the impurity
posi-tion, Mi refers to all the atoms within a given cluster
except the impurity and mi is the mass of the atom i.
For each atom i around the impurity, we evaluate the norm of the displacement vector, ~Vi,
| ~Vi|2 = (X i relaxed− X i non-relaxed) 2 + (Yi relaxed− Y i non-relaxed) 2 + (Zi relaxed− Z i non-relaxed) 2 , where (Xi non-relaxed, Y i non-relaxed, Z i non-relaxed) and (Xi relaxed, Y i relaxed, Z i
relaxed) are the cartesian
coordi-nates of ΩM~ i vector in the non-relaxed and relaxed
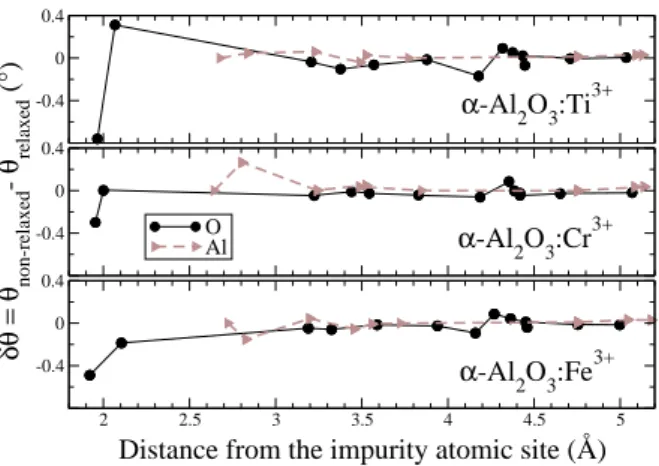
clusters, respectively. The angular relaxation was also determined. It was defined by the quantity δθ = θnon-relaxed− θrelaxed, where θrelaxed and θnon-relaxed
are the angles between the ΩM~ i directions and the C3
axis in the relaxed and non-relaxed clusters, respectively. The comparison of the relaxed and non-relaxed clusters leads to the following conclusions.
-0.4 0 0.4
2 2.5 3 3.5 4 4.5 5
Distance from the impurity atomic site (Å)
-0.4 0 0.4 -0.4 0 0.4 δθ = θ non-relaxed - θ relaxed (°) O Al α-Al2O3:Ti3+ α-Al2O3:Fe3+ α-Al2O3:Cr3+
FIG. 3: Angular relaxation around the paramagnetic impuri-ties in doped α-Al2O3: δθ angle (see text for explanation) as
a function of distance from the impurity in the relaxed model.
First, the impurity site symmetry is conserved: the Ti, Cr and Fe atoms are still in a C3 point symmetry site,
5
TABLE III: M-O and M-Al bond lengths in α-Al2O3:M3+(M=Ti, Cr, Fe) issued from the energy minimization calculations
presented in Sec.III A. These bond lengths are compared with the experimental and calculated Al-O and Al-Al interatomic distances in α-Al2O3 and to the M-O and M-M distances in α-M2O3. It is worth noting that the distances indicated for
α-Al2O3relative to Ref.18are the M-O and M-Al distances in the non-relaxed models.
Compound Interatomic distances (in ˚A)
cation-oxygen cation-cation
α-Al2O3(exp.8) dAl−O1 =1.86 dAl−O2 =1.97 dAl−Al1=2.65 dAl−Al2=2.79
α-Al2O3 (calc.18) dAl−O1 =1.84 dAl−O2 =1.95 dAl−Al1=2.62 dAl−Al2=2.77
α-Al2O3:Ti3+ (this calc.) dTi−O1 =1.97 dTi−O2 =2.07 dTi−Al1=2.72 dTi−Al2=2.83
α-Al2O3:Cr3+(calc.3) dCr−O1 =1.95 dCr−O2 =2.00 dCr−Al1=2.64 dCr−Al2=2.80
α-Al2O3:Fe3+(calc.3) dFe−O1 =1.92 dFe−O2 =2.10 dFe−Al1=2.72 dFe−Al2=2.83
α-Ti2O3 (exp.8) dTi−O1 =2.01 dTi−O2 =2.08 dTi−Ti1=2.59 dTi−Ti2=2.99
α-Cr2O3 (exp.48) dCr−O1 =1.96 dCr−O2 =2.01 dCr−Cr1=2.65 dCr−Cr2=2.88
α-Fe2O3(exp.48) dFe−O1 =1.94 dFe−O2 =2.11 dFe−Fe1=2.90 dFe−Fe2=2.97
(M = Ti, Cr or Fe). The angular relaxation is found to be very small (i.e. less than 0.8 degrees). This is illustrated in Fig. 3, which gives δθ as a function of the distance between the impurity and its neigboring atoms in the relaxed clusters.
Second, a displacement of the impurity from the initial aluminum site is observed in the three relaxed models. This displacement occurs along the C3 axis, but its
ab-solute value depends on the impurity. Chromium is dis-placed by 0.03 ˚A towards Al1atom, titanium is displaced
by again 0.03 ˚A but in the opposite direction, and iron is further moved (0.09 ˚A towards Al1 atom). The small
displacement of chromium is in agreement with various experimental studies of the literature.32,33,34,35,36The
re-sult for iron is consistent with an analysis of electronic paramagnetic resonance (EPR) experiments, that gives a displacement of 0.04 ± 0.02 ˚A.37
0 0.05 0.1
Norm of the displacement vector (Å)
O Al
2 2.5 3 3.5 4 4.5 5
Distance from the impurity atomic site (Å)
0 0.05 0.1 0 0.05 0.1 α-Al 2O3:Cr 3+ α-Al2O3:Fe3+ α-Al2O3:Ti3+
FIG. 4: Radial relaxation around the paramagnetic impuri-ties in doped α-Al2O3: norm of atomic displacement vectors
(oxygen atoms in solid line with circles and aluminum atoms in dashed line with triangles) as a function of distance from the impurity in the relaxed model.
Third, an increase of distances within the coordina-tion shell of the impurity is observed. This result is
expected since the ionic radii of Ti, Cr and Fe in oc-tahedral site38 (r
Ti3+ = 0.670 ˚A, rCr3+ = 0.615 ˚A and
rFe3+ = 0.645 ˚A) are all greater than the ionic radius
of aluminum (rAl3+ = 0.535 ˚A). The calculated M-O1
and M-O2bond lengths in doped α-Al2O3were found to
be close to M-O1 and M-O2 bond lengths in the
corre-sponding metal oxides, α-M2O3(α-Ti2O3, α-Cr2O3 and
α-Fe2O3). On the contrary, the distances M-Al1and
M-Al2were less affected by the relaxation process: they are
closer to Al-Al1 and Al-Al2 bond lengths in corundum
than the M-M1and M-M2distances in the corresponding
oxides α-M2O3. Tab.III gathers the M-O1, M-O2, M-Al1
and M-Al2 distances in α-Al2O3:M3+ deduced from the
calculation, and compares them with the corresponding distances in α-Al2O3, α-Ti2O3, α-Cr2O3 and α-Fe2O3,
resulting from x-ray diffraction experiments. One can re-mark in Tab. III that the Ti-O1and Ti-O2bond lengths
in α-Al2O3:Ti3+ (1.97 ˚A and 2.07 ˚A) are quite similar to
those in α-Ti2O3 (2.01 ˚A and 2.07 ˚A). Besides, the
Ti-Al1 and Ti-Al2 distances in α-Al2O3:Ti3+ (2.72 ˚A and
2.83 ˚A) are closer to the Al-Al1 and Al-Al2 distances
in corundum (2.65 ˚A and 2.79 ˚A) than to the Ti-Ti1
and Ti-Ti2 distances in α-Ti2O3 (2.59 ˚A and 2.99 ˚A).
One can notice that the experimental distances Cr-Cr1
in α-Cr2O3 and Al-Al1 in α-Al2O3 are both equal to
2.64 ˚A. Thus one expects that Cr-Al1 distance in ruby
(α-Al2O3:Cr3+) should be around 2.64 ˚A. The calculated
distances of α-Al2O3:Cr3+are slightly larger (+0.015 ˚A)
than those determined from EXAFS measurements on powder samples,36 and in good agreement (+0.005 ˚A)
with EXAFS measurements performed and on the same single crystal as the one used in the present study.3
They are also consistent with data extracted from opti-cal spectroscopy.39For α-Al
2O3:Fe3+, the calculated
dis-tances are in agreement with EXAFS experiments3 and
with EPR results.37
Finally, the M-O and M-Al distances deduced from the ab initio relaxation calculations suggest that the structural relaxation around the transition metal impu-rities is quite local and mainly concern the coordina-tion shell. This point is confirmed by the calculacoordina-tions of
the atomic displacements between the relaxed and non-relaxed. Fig. 4 represents the norm | ~Vi| as a function of
the distance between the impurity and its neighbors in the relaxed model. It clearly shows that the oxygen co-ordination shell absorbs almost the relaxation. The dis-placement of atoms farther than 2.5˚A from the impurity is less than 0.035 ˚A. Comparing the three compounds, one also observes that the relaxation is slightly larger around titanium and iron than around chromium.
B. Core-hole effects
The influence of the core-hole can be described by cal-culating a self-consistent potential around a core-hole or by solving a Bethe-Salpeter equation.40,41 For impurity
systems, solving a Bethe-Salpeter equation is probably beyond the reach of available computer programs. More-over, it was already observed that both methods give quite similar results.5 Therefore, we shall describe the
influence of the core-hole by calculating a self-consistent potential in the presence of a 1s core-hole.
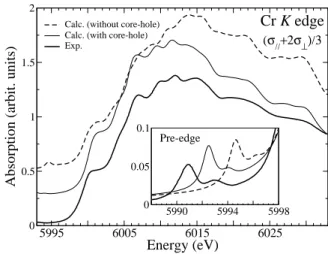
Calculated spectra performed with or without the pres-ence of a 1s core-hole on the chromium absorbing atom are compared in Fig. 5. It clearly appears that the core-hole is needed to obtain a good agreement with the ex-perimental curve. In particular, the intensity and the energy positions of the features within the 6005-6017 eV energy range are not well reproduced if the core-hole is not taken into account in the calculation. We have no-ticed similar behaviors due to the presence of the core-hole at the titanium and iron K-edges in α-Al2O3:Ti3+
and α-Al2O3:Fe3+, respectively.
On the other hand, the presence of the core-hole has a non-negligible impact in the pre-edge region. This is illus-trated in the inset of Fig. 5, which represents the pre-edge region (5985-5998 eV) of the Cr K edge in α-Al2O3:Cr3+.
An interpretation of this region in terms of group theory has been detailed in Ref.42 In the pre-edge region both
electric dipole (1s → p) and quadrupole (1s → 3d) tran-sitions occur. Since the site of the impurity in doped α-Al2O3is not centrosymmetric, the p states are present in
the pre-edge through p − d hybridization. electric dipole (1s → p) and quadrupole (1s → 3d) transitions occur. Since the site of the impurity in doped α-Al2O3 is not
centrosymmetric, the p states are present in the pre-edge through p−d hybridization. The calculated curves shown in the inset of Fig. 5 are the sum of both contributions. For the calculation of electric quadrupole transitions, the direction of the wave vector of the photon beam, k, has to be specified. In the experiments, the single crystals were placed on the rotating holder so that the wave vector was parallel to the [10¯1] crystallographic direction. Con-sequently, the spectra (σk+ 2σ⊥)/3 shown in Fig. 5 are
calculated with k//[10¯1].43The two features of the
exper-imental pre-edge are reproduced with or without the 1s hole (see inset of Fig. 5). The presence of the core-hole essentially provokes a 2.5 eV shift towards lower
en-5995 6005 6015 6025 Energy (eV) 0 0.5 1 1.5 2
Absorption (arbit. units)
Calc. (without core-hole) Calc. (with core-hole) Exp. 5990 5994 5998 0 0.05 0.1 Pre-edge (σ//+2σ⊥)/3 Cr K edge
FIG. 5: Influence of the core-hole effects in XANES calcula-tion at the Cr K edge in ruby. Inset: zoom of the pre-edge region. For pre-edge simulations, the calculated spectra in-clude both electric dipole and electric quadrupole transitions (the wave vector k is along the [10¯1] direction of the trigonal cell of ruby43).
ergy of the pre-edge features, while the main rising edge is not shifted. A similar energy shift due to the core-hole was already observed for electric quadrupole tran-sitions at the Ti K pre-edge in rutile.44 Unfortunately,
here the shift induced by the presence of the core-hole is not large enough to give a perfect agreement with ex-periment. This problem may be due to the limit of the density functional theory within LDA to model the core hole-electron interaction for empty d states of 3d transi-tion metals. LDA+U calculatransi-tions could possibly improve the agreement in the pre-edge region. Indeed in Ref.45,
the authors show that LDA+U calculations performed on ruby essentially affect the positions of Cr d level relative to the valence and the conduction band.
C. Comparison between experimental and calculated XANES spectra
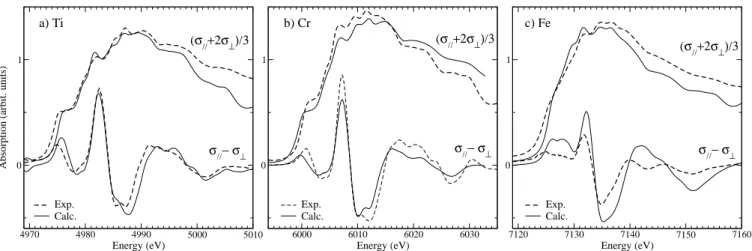
Fig. 6 compares experimental XANES data with the theoretical spectra obtained with the relaxed models. The (σk+ 2σ⊥)/3 and σk− σ⊥ signals are displayed at
the Ti K edge for the pink sapphire sample (Fig.6a), at the Cr K edge for the ruby sample (Fig.6b) and at the Fe K edge for the blue sapphire sample (Fig.6c).
One observes that the experimental spectra present comparable overall shapes. The Fe K edge seems to be less resolved than the Ti and Cr K edges, probably due to the following two reasons: (i) the core-hole lifetime is shorter at the Fe edge (1.25 eV) than at the Cr K-edge (1.08 eV) and at the Ti K-K-edge (0.94 eV);31 (ii)
the instrumental resolution is estimated to 0.9 eV at the Fe K-edge while it is 0.6-0.7 eV at both the Cr and Ti K-edges. We also noticed similarities between the M K edges (M=Ti, Cr, Fe) in α-Al2O3:M3+ and in α-M2O3
7
4970 4980 4990 5000 5010
Energy (eV)
0 1
Absorption (arbit. units)
Exp. Calc. 6000 6010 6020 6030 Energy (eV) 0 1 Exp. Calc. 7120 7130 7140 7150 7160 Energy (eV) 0 1 Exp. Calc. a) Ti b) Cr c) Fe (σ//+2σ⊥)/3 (σ//+2σ⊥)/3 (σ//+2σ⊥)/3 σ//− σ⊥ σ//− σ⊥ σ//− σ⊥
FIG. 6: Comparison between experimental XANES data (dashed line) and calculated spectra obtained with the relaxed models (solid line): a) the Ti K edge in pink sapphire (α-Al2O3:Ti3+); b) the Cr K edge in ruby (α-Al2O3:Cr3+); c) the Fe K edge
in blue sapphire (α-Al2O3:Fe-Ti). An energy shift was added to valence band maximum in the calculations in order to match
(see Ref.46 for the Cr K edge in α-Cr
2O3 and the Fe
K edge in α-Fe2O3, and Ref.47 for the Ti K edge in
α-Ti2O3). At least to a certain extent, these spectra could
be considered as the signature of a transition metal ion with a +III oxydation state in six-fold coordinated envi-ronment. However it is here necessary to perform calcu-lations to go farther in the XANES analysis.
It can be seen in Fig. 6 that a good agreement is ob-tained between experimental data and calculated spectra carried out on the relaxed structural models. The agree-ment is especially good for ruby at the Cr K edge, where energy positions and relative intensities of the various fea-tures are well reproduced. It should be emphasized that not only the averaged (σk+ 2σ⊥)/3 spectra are correctly
reproduced, but also the dichroic signal, from which more precise structural information could be extracted. Such a good agreement with angular dependent spectra has been also obtained with the same calculation method: at the Al K edge in corundum21 and at the Si K edge in
α-quartz.5
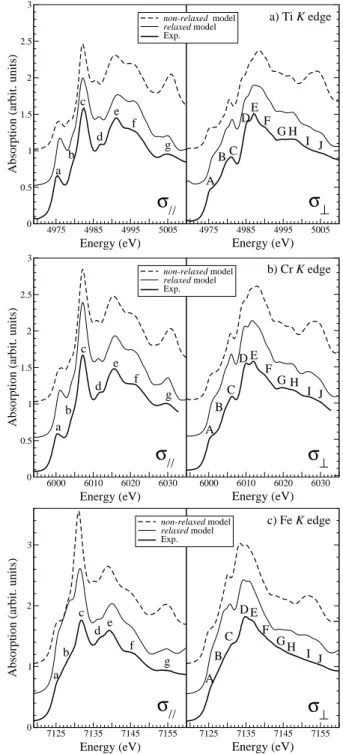
We have seen in Sec. III A that the differences be-tween the relaxed and non-relaxed structures are essen-tially concerned with the interatomic distances within the coordination shell of the impurity. Therefore, it is interesting to test the sensitivity of XANES to such sub-tle structural modifications. Fig. 7 compares σk and σ⊥
experimental spectra with the corresponding calculated ones performed from both non-relaxed and relaxed mod-els. First of all, it is worth noting that the differences observed between calculated spectra are small but not negligible. For all compounds, peaks labeled g in σk and
labeled I and J in σ⊥ are too strong in the non-relaxed
calculated spectra. Consequently, these features (all lo-cated at about 30 eV above the edge) are clearly corre-lated to the first interatomic distances around the impu-rity. The same conclusion can be made for the shoulders labeled A and B in σ⊥ and b in σk. Especially at the Cr
K edge in σ⊥ signal, one can see that the double-feature
(D and E) is better reproduced by the relaxed calculation than by the non-relaxed one.
In a previous study,3 the relaxed model was validated
up to the second neighbors around the impurity by com-parison with EXAFS measurements. Here, thanks to the very good agreement obtained between experimental and relaxedcalculated XANES spectra, the relaxed structural model is again validated and this time to greater extent.
IV. CONCLUSIONS
In this paper, we have shown that XANES can pro-vide precious information about the small structural re-laxation occuring within the atomic site of impurity in an aluminum oxide matrix. This has been achieved by (i) measuring angular dependent XANES spectra in or-der to probe the distortion of the impurity site, (ii) cal-culating structural model by ab initio energy minimiza-tion, (iii) calculating the XANES spectra from the
previ-4975 4985 4995 5005 Energy (eV) 0 0.5 1 1.5 2 2.5 3
Absorption (arbit. units)
4975 4985 4995 5005 Energy (eV) non-relaxed model relaxed model Exp.
σ
// Aσ
⊥ BC DEF G H a b a) Ti K edge c d e f g I J 6000 6010 6020 6030 Energy (eV) 0 0.5 1 1.5 2 2.5 3Absorption (arbit. units)
6000 6010 6020 6030 Energy (eV) non-relaxed model relaxed model Exp.
σ
//σ
⊥ A B C D E F G H a b b) Cr K edge c d e f g I J 7125 7135 7145 7155 Energy (eV) 0 1 2 3Absorption (arbit. units)
7125 7135 7145 7155 Energy (eV) non-relaxed model relaxed model Exp.
σ
//σ
⊥ A B C D E F GH a b c) Fe K edge c d e f g I JFIG. 7: Comparison between σk(left) and σ⊥(right)
experi-mental data (thick solid line) and calculated spectra obtained with both relaxed model (thin solid line) and non-relaxed model (dashed line): a) the Ti K edge in pink sapphire, α-Al2O3:Ti3+; b) the Cr K edge in ruby, α-Al2O3:Cr3+; c) the
Fe K edge in blue sapphire, α-Al2O3:Fe-Ti.
ous theoretical structural models using the full-potential pseudopotential self-consistent method of Ref.5The good
agreement obtained between experimental and calculated spectra permits the validation of the structural models. We have also pointed out the importance of the elec-tronic potential construction to carry this study to a
suc-9 cessful conclusion. These results opens new applications
in XANES analysis, in particular for dilute samples for which good quality EXAFS measurements are difficult to collect.
Acknowledgments
We wish to acknowledge the computational support of the French Institut du D´eveloppement et de Recherche en
Informatique Scientifique in Orsay, where all the calcu-lations of this study were carried out.
1 H. Miller, Physica C 104, 183 (1981).
2 J. D. Verhoeven, A. H. Pendray, and W. E. Dauksch, JOM
50, 58 (1998).
3 E. Gaudry, A. Kiratisin, Ph. Sainctavit, Ch. Brouder,
F. Mauri, A. Ramos, A. Rogalev, and J. Goulon, Phys. Rev. B 67, 094108:1 (2003).
4 G. A. Waychunas, C. C. Fuller, J. A. Davis, and J. J. Rehr,
Geochim. Cosmochim. Acta 67, 1031 (2003).
5
M. Taillefumier, D. Cabaret, A.-M. Flank, and F. Mauri, Phys. Rev. B 66, 195107 (2002).
6 R. G. Burns, Mineralogical Applications of Cristal Field
Theory, vol. 5 of Cambridge topics in Mineral Physics and Chemistry (Cambridge University Press, 1993), 2nd ed.
7 K. Nassau, The Physics and Chemistry of Color (Wiley
Interscience, 1983).
8 R. Newnham and Y. de Haan, Zeit. Kristallogr. 117, 235
(1962).
9 H. K. Eigenmann, Ph.D. thesis, Eidgen¨ossischen
Technis-chen Hochschule, Z¨urich (1970).
10 J. Goulon, A. Rogalev, C. Gauthier, C. Goulon-Ginet,
S. Paste, R. Signorato, C. Neumann, L. Varga, and C. Mal-grange, J. Synchrotron Rad. 5, 232 (1998).
11 A. Rogalev, J. Goulon, C. Goulon-Ginet, and C.
Mal-grange, in Magnetism and Synchrotron Radiation, edited by E. Beaurepaire, F. Scheurer, G. Krill, and J.-P. Kappler (Springer, 2001).
12 R. Car and M. Parrinello, Phys. Rev. Lett. 55, 2471 (1985). 13 ”CPMD V3.7 Copyright IBM Corp 1990-2003, Copyright
MPI fuer Festkoerperforschung Stuttgart 1997-2001”. For more information see http://www.cpmd.org.
14 Calculations were performed with PARATEC (PARAllel
Total Energy Code) by B. Pfrommer, D. Raczkowski, A. Canning, S.G. Louie, Lawrence Berkeley National Labo-ratory (with contributions from F. Mauri, M. Cote, Y. Yoon, Ch. Pickard and P. Haynes). For more information see www.nersc.gov/projects/paratec.
15 N. Troullier and J. L. Martins, Phys. Rev. B 43, 1993
(1991).
16 L. Kleinman and D. M. Bylander, Phys. Rev. Lett. 48,
1425 (1982).
17 W. Duan, R. M. Wentzcovitch, and K. T. Thomson, Phys.
Rev. B 57, 10363:10369 (1998).
18 W. Duan, G. Paiva, R. M. Wentzcovitch, and A. Fazzio,
Phys. Rev. Lett. 81, 3267 (1998).
19 Within the R¯3c space group, the 4 c symmetry site
cor-responds to the positions ±(x, x, x; x + 1 2, x +
1 2, x +
1 2)
and the 6 e symmetry site corresponds to the positions ±(x,1 2−x, 1 4; 1 2−x, 1 4, x; 1 4, x, 1 2−x)).
20 A. Lever, Inorganic Electronic Spectroscopy (Elsevier,
1984).
21 D. Cabaret, E. Gaudry, M. Taillefumier, P. Sainctavit,
and F. Mauri, Physica Scripta, Proc. XAFS-12 conference (2004), to be published.
22 P. E. Bl¨ochl, Phys. Rev. B 50, 17953 (1994).
23 R. Haydock, V. Heine, and M. J. Kelly, J. Phys. C: Solid
State Phys. 5, 2845 (1972).
24
R. Haydock, V. Heine, and M. J. Kelly, J. Phys. C: Solid State Phys. 8, 2591 (1975).
25 For electric dipole and quadrupole transitions, the operator
O of Eq.2 in Ref.5 is equal to ˆε · r and to i
2 ε · r k ·ˆ
r, respectively. The unit vector ˆε is the direction of the polarisation of the incident photon beam, and k is the wave vector.
26 A. L. Ankudinov, B. Ravel, J. J. Rehr, and S. D.
Conrad-son, Phys. Rev. B 58, 7565 (1998).
27 C. R. Natoli, D. K. Misemer, S. Doniach, and F. W.
Kut-zler, Phys. Rev. A 22, 1104 (1980).
28 M. Benfatto, S. D. Longa, and C. R. Natoli, J. Synchrotron
Rad. 10, 51 (2003).
29 H. J. Monkhorst and J. D. Pack, Phys. Rev. B 13, 5188
(1976).
30 J. Kokubun, K. Ishida, D. Cabaret, F. Mauri, R. V.
Vedrinskii, V. L. Kraizman, A. A. Novakovich, E. V. Kriv-itskii, and V. E. Dmitrienko, Phys. Rev. B 69, 245103 (2004).
31 M. Krause and J. Oliver, J. Phys. Chem. Ref. Data 8, 329
(1979).
32 N. Laurance, E. C. McIrvine, and J. Lambe, J. Phys.
Chem. Solids 23, 515 (1962).
33 L. L. Lohr and W. H. Lipscomb, J. Chem. Phys. 38, 1607
(1963).
34 S. C. Moss and R. E. Newnham, Zeitschr. Kristallogr. 120,
359 (1964).
35 J. W. McCauley and G. V. Gibbs, Zeitschr. Kristallogr.
135, 453 (1972).
36 P. Kizler, J. He, D. R. Clarke, and P. R. Kenway, J. Am.
Ceram. Soc. 79, 3 (1996).
37 W.-C. Zheng, Physica B 245, 119 (1998). 38 R. D. Shannon, Acta. Cryst. A32, 751 (1976). 39 K. Langer, Z. Kristallogr. 216, 87 (2001). 40 E. L. Shirley, Phys. Rev. Lett. 80, 794 (1998).
41 J. A. Soininen and E. L. Shirley, Phys. Rev. B 64, 165112(1
(2001).
42 E. Gaudry, D. Cabaret, Ph. Sainctavit, Ch. Brouder,
F. Mauri, A. Rogalev, and J. Goulon, Physica Scripta Proc. XAFS-12, Sweden, 2003(2004).
43 One should keep in mind that (σ
k+ 2σ⊥)/3 is what has
been measured. It corresponds to the isotropic spectrum only in the electric dipole approximation, but under no circumstances in the electric quadrupole approximation.
44 Y. Joly, D. Cabaret, H. Renevier, and C. R. Natoli, Phys.
Rev. Lett. 82, 2398 (1999).
45 V. V. Mazurenko, A. N. Varaksin, V. G. Mazurenko, V. S.
Kortov, and V. I. Anisimov, Physica B 344, 385 (2004).
46 L. A. Grunes, Phys. Rev. B 27, 2111 (1983). 47 G. A. Waychunas, Am. Mineral. 72, 89 (1987).