HAL Id: hal-01512562
https://hal.archives-ouvertes.fr/hal-01512562
Submitted on 28 Apr 2017HAL is a multi-disciplinary open access archive for the deposit and dissemination of sci-entific research documents, whether they are pub-lished or not. The documents may come from teaching and research institutions in France or abroad, or from public or private research centers.
L’archive ouverte pluridisciplinaire HAL, est destinée au dépôt et à la diffusion de documents scientifiques de niveau recherche, publiés ou non, émanant des établissements d’enseignement et de recherche français ou étrangers, des laboratoires publics ou privés.
Spatiotemporal indicators of solar energy potential in
the Guiana Shield using GOES images
Erwann Fillol, Tommy Albarelo, Antoine Primerose, Lucien Wald, Laurent
Linguet
To cite this version:
Erwann Fillol, Tommy Albarelo, Antoine Primerose, Lucien Wald, Laurent Linguet. Spatiotemporal indicators of solar energy potential in the Guiana Shield using GOES images. Renewable Energy, Elsevier, 2017, 111, pp.11-25. �10.1016/j.renene.2017.03.081�. �hal-01512562�
1
Spatiotemporal indicators of solar energy potential in the Guiana Shield using GOES 1
images 2
3
Erwann Fillola, Tommy Albareloa, Antoine Primerosea, Lucien Waldb and Laurent 4
Lingueta* 5
a Université de Guyane, UMR 228 Espace-DEV, IRD, Université de Montpellier, Université de la Réunion, 275
6
Route de Montabo, BP 165, 97323 Cayenne Cedex, Guyane Française 7
tommy.albarelo@ird.fr, erwann.fillol@gmail.com, antoine.primerose@univ-guyane.fr, 8
laurent.linguet@univ-guyane.fr
9
b MINES Paris Tech, PSL Research University, Centre Observation, Impacts, Energy, BP 204, 06905, Sophia
10
Antipolis Cedex, France 11 lucien.wald@mines-paristech.fr 12 * Corresponding author 13 14
Abstract: The purpose of this article is to evaluate the potential for solar energy in the Guiana 15
Shield and propose indicators to encourage the exploitation of solar energy systems in this
16
area. For this, we use the Heliosat-2 optimized method to process images from the
17
geostationary meteorological satellite GOES acquired in the period from April 2010 to July
18
2015. We calculated the average daily global horizontal irradiation (GHI) and direct normal
19
irradiation (DNI) throughout the study period. The results obtained allowed us to establish
20
four indicators: maps of production potential, the inter-day variability of DNI and GHI, maps
21
of solar panel orientation related to maximum solar potential, and maps of areas where the
22
solar resource is under the exploitable potential threshold. We also added an additional
23
indicator, the suitability of areas for solar system installation depending on the ground slope.
24
Our study shows that the average value of production potential for the entire Guiana Shield is
25
approximately 1780 kWh.kWc-1.year-1 for GHI and 2040 kWh.kWc-1.year-1 for DNI.
26
Comparisons with pyranometer measurements indicate an error relative bias of less than 2 %
27
and a relative RMSE of less than 21 % for hourly estimates of GHI. Although the Guiana
28
Shield region is covered by many clouds, few areas show insufficient solar potential for the
29
exploitation of GHI and DNI, but the hilly nature of the area limits possible locations of very
30
large power plants and instead favors more medium-sized plants. This is the first study that
31
offers exploitability indicators for solar resources in the Guiana Shield. In conclusion, the
32
established indicators provide a new perspective on the solar potential in the Guiana Shield
33
and are expected to promote the development of new solar energy operating systems.
34 35
Keywords: renewable energy, solar irradiation, indicators, suitability areas, Guiana Shield, 36 Heliosat-2. 37 38 39
2
1. Introduction 40
41
Climate change is largely due to emissions of greenhouse gases created by human
42
activity. Without a mitigation strategy, the average temperature on the Earth's surface could
43
increase by between 3.7 °C and 4.8 °C before 2100 (IPCC, 2014). The electricity generation
44
sector is the primary sector in which carbon emissions can be quickly reduced. In particular,
45
the renewable energy sector is promising because of its low environmental impact. Among
46
the available forms of renewable energy, photovoltaics has the most global future potential.
47
According to the International Energy Agency (IEA) [1], the worldwide installed capacity of
48
photovoltaic power has been experiencing significant growth for several years and shows
49
growth prospects of about 40 GW/year from 2015 to 2020. At the end of 2014, the worldwide
50
installed capacity was approximately 177 GW, divided in the following manner: 51 % in
51
Europe, 36 % in Asia, 12 % on the American continent (21 GW mainly installed in North
52
America), and 1 % in Africa. One reason for the growth of photovoltaics is related to the
53
falling cost of photovoltaic systems by 50 % between 2010 and 2014. This cost reduction
54
offers new opportunities to provide electricity to millions more people around the world.
55 56
Indeed, photovoltaics is increasingly seen as an effective and economical way to
57
supply electricity to isolated areas rather than extending electricity networks. Another
58
advantage that may encourage the use of solar energy in developing countries is that it is
59
relatively well distributed over a large part of the planet, and much more abundant near the
60
equator. However, several regions in the world located near the equator have a poorly
61
developed capacity for energy production based on solar power. This is the case in the Guiana
62
Shield area in the north of South America. In 2015, according to IEA, the maximum net
63
capacity of installed photovoltaic (PV) capacity in the countries of the Guiana Shield was 0
64
MW in Suriname, 2 MW in Guyana, and 3 MW in Venezuela. There are few or virtually no
65
solar power plants in Amapá, North Brazil, while French Guiana has installed 39 MW [2-5].
66
Electrical networks are underdeveloped and electricity production of the Guiana Shield
67
countries is mostly fossil dependant (diesel generators) or hydroelectric. The poor
68
development of solar power generation projects is almost certainly related to a lack of
69
knowledge regarding the solar energy potential in this region.
70 71
Development of solar power generation projects in the Guiana Shield can only be
72
accomplished with increased knowledge of the solar radiation potential and its variability in
73
this region. This knowledge can be achieved through a network of terrestrial solar radiation
74
measuring stations. Although in-situ data interpolation allows acquisition of solar radiation
75
maps, the data interpolation is valid only up to an average distance of 50 km between stations
76
for daily radiation totals and up to 34 km between stations for hourly radiation measurements
77
[6]. Beyond this distance, it is recommended that satellite imagery is used to obtain significant
78
results.
79 80
Solar radiation potential is generally derived from satellite imagery by using models
81
that can be categorized as physical, statistical and semi-empirical. The physical models offer
3
more generality, however, they are complex and require atmospheric data (aerosol properties,
83
precipitable water, ozone, cloud fraction, optical depth, effective radius, height, phase, aerosol
84
optical depth, etc.) as input to a Radiative Transfer Model (RTM). The RTM models the
85
effects of the atmosphere on the incoming solar radiation to generate estimates of surface
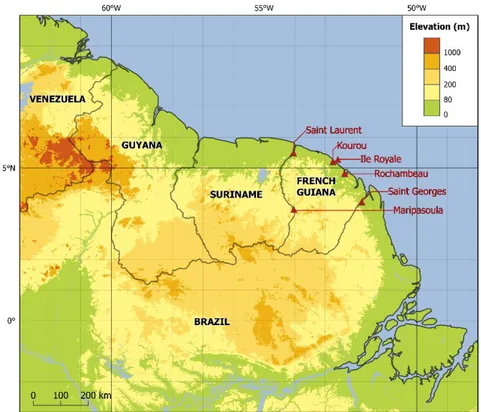
86
solar radiation [7, 8]. Statistical models have an advantage of simplicity, they usually use a
87
parameter called "cloud index" defined as a function of the reflectance of the ground (i.e.,
88
without clouds or minimal albedo) and the reflectance of very bright clouds [9]. Solar
89
radiation at the Earth surface is obtained by linking the cloud index to the irradiance obtained
90
under clear skies [10, 11]. Moreover, semi-empirical model combine the use of a RTM and
91
the calculation of a cloud index [12, 13]
92 93
Among the existing methods for estimating solar potential from satellite images, one is
94
widely exploited by the scientific community: the Heliosat-2 method [9-10]. The Heliosat-2
95
method uses input data from the visible channel of the Meteosat satellite and a cloud index
96
coupled with a clear sky model to estimate solar radiation on the ground. The spatial coverage
97
of data is identical to the spatial extent of the images of the Meteosat geostationary
98
meteorological satellite (Europe, Africa, Middle East and western part of the South America
99
continent). The solar radiation data is provided every 15 minutes with a spatial resolution of
100
0.03° x 0.03° (about 3 km x 3 km). This method was optimized by Albarelo et al. in 2015 [14]
101
to produce estimates of solar radiation in western South America using images from the
102
visible channel of the GOES-E satellite. To address the lack of mapping of solar potential and
103
its features in the Guyana Shield area, we use the Heliosat-2 method optimized by Albarelo et
104
al. The effectiveness of this Heliosat-2 optimized method has been evaluated in one of the
105
countries of the Guyana Shield (French Guyana) with conclusive results that allow its use on a
106
larger scale.
107 108
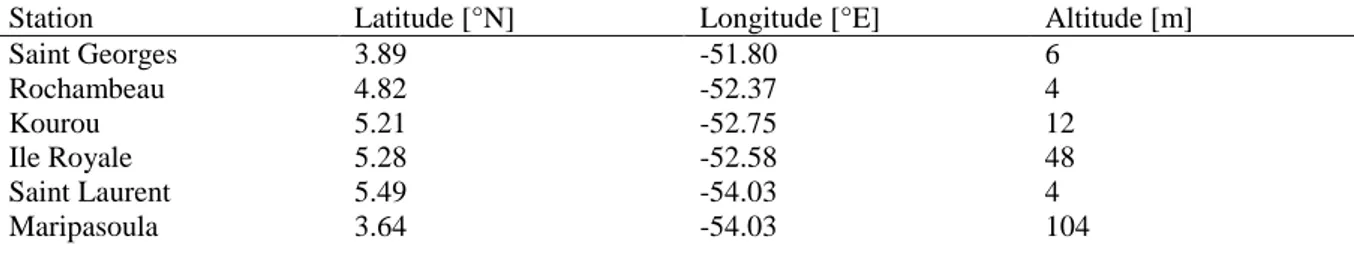
This study aims to produce information currently lacking on the usability of solar
109
radiation. There are several studies in the tropics on solar potential, predominantly regarding
110
global radiation in the horizontal plane (global horizontal irradiation - GHI) and occasionally
111
regarding direct radiation normal to the incident surface (direct normal irradiance - DNI).
112
These include the work of Janjai et al. [15-16] on mapping of the solar potential in Southeast
113
Asia, that of Gastli & Charabi [17] on the Middle East, and of Pillot et al. [18] in Djibouti.
114
The solar potential of Brazil was also evaluated in the SWERA (Solar and Wind Energy
115
Resources Assessment), which resulted in the design of the Brazilian Atlas of Solar Energy
116
[19]. Estimates of GHI and DNI from this atlas were obtained using the Brasil-SR estimation
117
method [20-22]. This is a physical model that combines weather and climate data with GOES
118
satellite images in the visible and infrared channel.
119 120
Other solar potential studies have done more than simply map the solar potential.
121
Some studies have integrated the analysis of constraints operability including Polo et al. [23],
122
who conducted a study of solar potential in Vietnam by analyzing the constraints related to a
123
minimum level of potential in terms of GHI as DNI, in order to optimize the operation and
124
productivity of PV plants (to exploit the GHI) and concentrator solar power, or CSP (to
4
exploit the DNI). Another example is Mahtta et al. [24], who also conducted a study of solar
126
potential through DNI and GHI in India. They analyzed the constraints related to the
127
minimum irradiation threshold (4 kWh.m-2.day-1 for GHI-1, 5.47 kWh.m-2.day-1 for DNI), but
128
also the constraints related to the type of land (only land classified as "wasteland" was used)
129
and the slope (less than 2.1 %). Gherboudj & Ghedira [25] carried out even more research on
130
this issue. They estimated the potential of GHI and DNI in the United Arab Emirates, and
131
they studied the constraints on the production capacity of solar systems, such as climatic
132
factors that may impact system productivity (humidity, wind, aerosol particle size,
133
temperature). Others constraints were also analyzed, such as topography, vegetation, and the
134
presence of roads, which limit availability of production areas.
135 136
However, to our knowledge no study exists that deals with solar potential and
137
constraints related to the use of solar energy in the Guiana Shield. This study seeks to fill this
138
gap and aims to map the solar potential of the area and identify the most suitable areas for the
139
operation of solar power systems. This knowledge is vital for overcoming the barrier to
140
developing production projects based on solar energy. To carry out this study, we build
141
indicator maps relating to the usability of solar energy production systems. Following this
142
work, we identify the most suitable areas for the deployment of solar energy production
143
systems. This study is part of a genuine effort to promote the development of solar energy
144
exploitation in the Guiana Shield. The article is structured as follows: the study area and data
145
is presented in Section 2. Section 3 describes the methodology used to convert a satellite
146
image map of solar radiation. In Section 4, the results are presented and discussed. Finally, we
147
present conclusions and our future research prospects.
148 149
2. Data
150 151
The Guiana Shield is a region of South America composed of Venezuela, Guyana,
152
Suriname, French Guiana, and northern Brazil (states of Pará, Amapá, and Roraima) (Figure
153
1). The Guiana Shield is located between 3° S and 10° N and 63° W and 48° W and is a low
154
population density area covering 2.3 million km² [26]. It is covered entirely by the Amazon
155
rainforest. This area is located near the equator and is subjected to high cloud cover as part of
156
a regular and important cycle of evaporation and precipitation due to the Intertropical
157
Convergence Zone (ICTZ) or monsoon trough. The ICTZ passes twice over the Guiana
158
Shield, causing heavy rainfall and defining two main seasons: the dry season from July to
159
October, when the ICTZ is located north of the Guiana Shield and the sky is mostly clear, and
160
the rainy season from November to June.
161 162
2.1. Satellite data 163
The satellite images used in this study comes from the meteorological geostationary
164
satellite GOES-13, orbiting at 74.5° W. Images are from the visible channel (0.55 µm – 0.75
165
µm) and are taken every 30 minutes, with a spatial resolution of 1 km in latitude and 0.6 km
166
in longitude, with a ground spot of approximately 1 km in diameter. The selected images are
167
from April 27th 2010 to July 15th 2015 (5 and a half years) and were provided by the
5
Comprehensive Large Array-data Stewardship System (CLASS) catalogue. We divided the
169
day into hourly slots, as suggested by Rigollier [27]. The period of the day for this study lasts
170
from slot 18 (8h45 GMT) to slot 46 (22h45 GMT). Satellite data related to ground elevation
171
were also used in this study. The elevation map is obtained from the Shuttle Radar
172
Topography Mission (SRTM) digital elevation model downloaded at a resolution of 90 m
173
[28]. Figure 1 shows the ground elevation map of the study zone.
174
Data from the radiation datasets of Meteosat Second Generation solar radiation
175
products, provided by Satellite Application Facility on Climate Monitoring (CM-SAF) were
176
also used in this study. The selected product is named Surface Solar RAdiation data set -
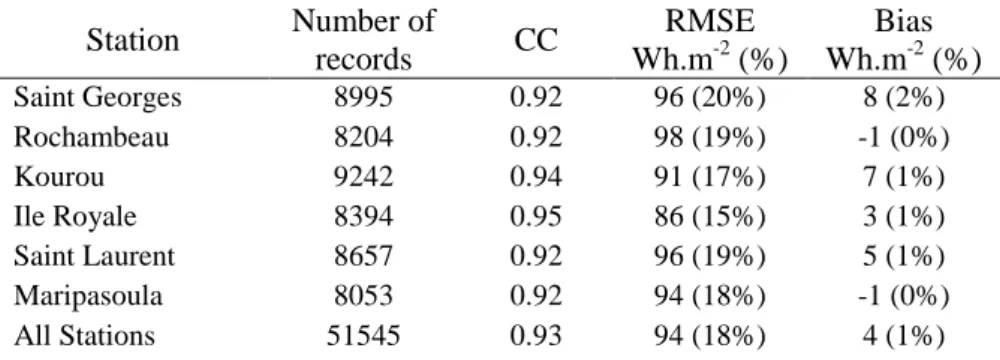
177
Heliosat (SARAH), it spans the period from 1983 to 2013 with a spatial resolution of
178
0.05°×0.05° and covers the region ± 65° in latitude and ± 65° in longitude. A detailed
179
description of the data by the CM-SAF can be found in Ref. [29, 30].The variables used from
180
this dataset are the hourly Surface Incoming Shortwave Irradiance (SIS) and hourly Direct
181
Normal Irradiance (DNI). SIS is usually also called global horizontal irradiance (GHI) or
182
solar surface irradiance (SIS) [30]. It is expressed in W.m-2. Only days in which measured
183
GHI by pyranometers and estimated GHI from SARAH and optimized Heliosat2 datasets
184
overlapped were considered. This period runs from 27th April 2010 to 31th December 2013
185
except 17 days between 1st and 17th October 2010 which have been discarded due to
186
apparently poor SARAH dataset quality over the area of interest.
187 188
2.2. In situ data 189
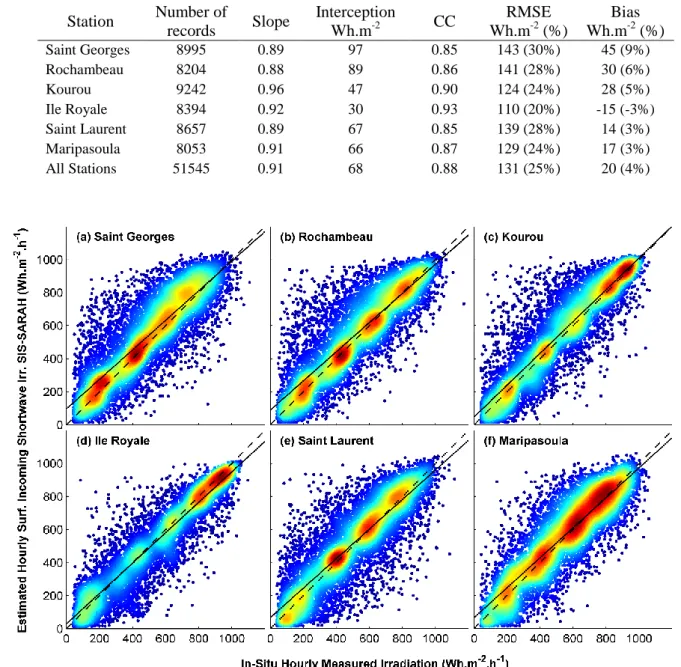
Very few stations measuring solar irradiation have been established in the Guiana
190
Shield and they have very sparse coverage. Measurements of global irradiation used in this
191
study are from six ground stations located in French Guiana and managed by the French
192
national meteorological agency (Meteo France). The list of the stations and their latitude,
193
longitude, and altitude are given in Table 1.
194 195
Table 1. Latitude, longitude, and altitude of ground meteorological stations in French Guiana 196
197
There are not, to our knowledge, global solar irradiation ground stations in Guyana and
198
Suriname. In Venezuela, although there are global irradiation ground stations [31], we did not
199
have access to these data. Ground stations in French Guiana are equipped with Kipp and
200
Zonen pyranometers of type CM6B and CMP11, considered as having an accuracy of up to 3
201
% by the WMO [32]. Preventive maintenance of these pyranometers is carried out every two
202
months and they are calibrated in the Radiometry National Center of Meteo France located in
203
Carpentras, France. Standard exchange of the pyranometers is systematically carried out every
204
two years. All of the in situ stations are located in flat or low relief areas and are not subject to
205
Station Latitude [°N] Longitude [°E] Altitude [m]
Saint Georges 3.89 -51.80 6 Rochambeau 4.82 -52.37 4 Kourou 5.21 -52.75 12 Ile Royale 5.28 -52.58 48 Saint Laurent 5.49 -54.03 4 Maripasoula 3.64 -54.03 104
6
shadow effects. As only global irradiation was available from the in-situ measurements, we
206
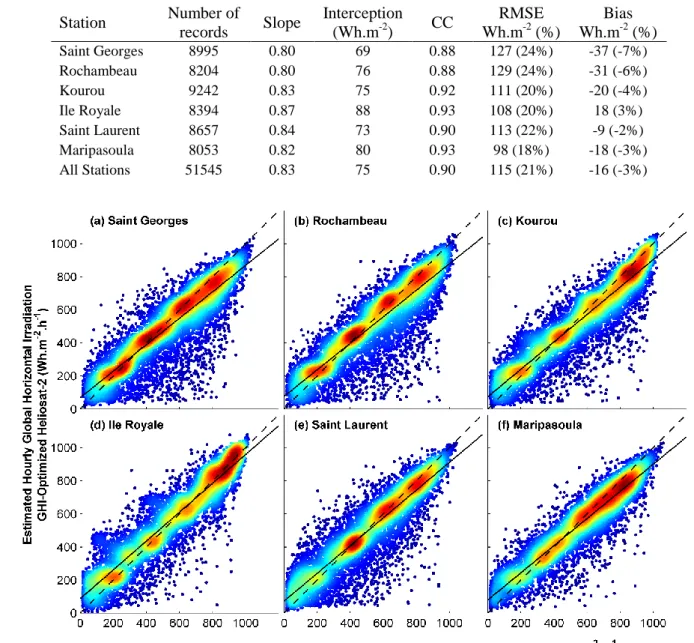
performed a quality check process based on extreme values, following the method proposed
207
by Geiger et al. [33] and the SoDa website [34]. Hourly global irradiation (Gh, in Wh.m-2)
208
was considered valid when it respected the following condition:
209 210
0.03.GhTOA < Gh < min ((1.2.I0), ((1.5.I0.cos(θs).1.2) + 100)) (1)
211
where GhTOA is the top of atmosphere hourly irradiance, θs is the sun zenith angle, and I0 is the
212
solar constant (1367 W.m-2).The localization of the ground stations is shown in Figure 1.
213 214
215
Figure 1. Elevation map (from Shuttle Radar Topography Mission SRTM) 216
217
3. Methods
218 219
3.1. Optimized Heliosat-2 method 220
The Heliosat-2 method [7,28] was developed in MINES Paris Tech. The principle of
221
the method is that variation in the cloud cover above a pixel from a satellite image leads to a
222
variation in the albedo of that pixel. This variable albedo influences the solar irradiance of the
223
pixel. The method makes it possible to convert the reflectance of a pixel in an image from the
224
meteorological satellite METEOSAT into values of solar irradiation. In order to determine the
225
potential related to solar irradiation in the Guiana Shield, we used the optimized Heliosat-2
226
method, developed by Albarelo et al. [9], but with some changes. The optimized Heliosat-2
227
method can be run with images from the meteorological satellite GOES (for more details see
228
[9]). The GOES satellite images were downloaded in the AREA format encoded in 16 bits
229
and then transformed into digital counts CN10 encoded in 10 bits. This operation was
7
performed by moving 3 bits to the right. Once converted from 16 bits to 10 bits, the data was
231
calibrated into radiance values.
232 233
The optimized method uses the following calibration formula provided by the National
234
Aeronautics and Space Administration (NASA) [36], because it offers the advantage of
235
correcting the sensor drift on a daily basis:
236
L = (g2.d² +g1.d + g0) * (CN10-CN0) (2)
237
where L is the radiance (W.m-2.sr-1.μm-1), g0 is the initial gain, g1 and g2 are the first and
238
second order polynomial terms of the gain trend, respectively, d is the number of days since
239
the launch, CN10 is the 10-bit digital count, and CN0 is an offset (equal to 29 for the GOES
240
imager). Radiance was then converted into reflectance by:
241 ) cos( . . _ 0 sat s sat E L (3) 242
where ρsat is the satellite-derived reflectance or apparent reflectance, Lλ is the satellite-derived
243
radiance (W.m-².sr-1.µm-1), E0_sat is the solar constant in the visible channel for the studied
244
sensors (W.m-².sr-1.µm-1), ε is the Earth-Sun distance correction factor, and θs is the sun zenith
245
angle (radians). The satellite reflectance was then converted into apparent reflectance by
246
accounting for the atmospheric effects:
247 ) ( ) ( ) , , ( v s v s atm sat T T (4) 248
where ρ is the apparent reflectance or apparent albedo, ρsat is the satellite-derived reflectance,
249
ρatm is the apparent reflectance of the atmosphere, T(θs) is the downward transmittance, T(θv)
250
is the upward transmittance, θs is the sun zenith angle (radians), θv is the satellite viewing
251
angle (radians), and ψ is the difference between the sun and satellite azimuthal angles. From
252
the apparent albedo, a cloud index (n) [9, 35] was calculated to determine the cloud cover
253 over a pixel: 254 g c g n (5) 255
where ρg and ρc are the ground albedo and the cloud albedo, respectively. The ground albedo 256
(ρg) was selected, for each pixel, as the second minimum detected on a sliding time window
257
of 61 days by considering all of the slots where the solar elevation angle is higher than 40°.
258
The size of the time window was significant but it is explained by a weak annual evolution of
259
the ground albedo because of the weak phenology of the vegetation and the absence of
260
snowfall.
261
Regarding the calculation of the cloud albedo, unlike Albarelo et al. [14] we did not
262
retain the maximum value of pixel reflectance for the whole zone. Instead, because of the size
263
of the study site (ten times bigger than French Guiana, therefore the slot when the sun is
8
directly overhead is not the same everywhere) and calculation time, we kept the original
265
formula suggested by Rigollier et al. [10] (equation 6):
266 ) ( ) ( ) , , ( v s v s atm eff c T T (6) 267
5
)) (cos( 4 1 13 . 0 85 . 0 e s eff (7) 268where ρeff is the effective cloud albedo. This formula was applied to every pixel and at every
269
slot. From the cloud index, we calculated the clear sky index Kc [37-38]:
270 271 2 . 0 n Kc1.2 272 8 . 0 2 . 0 n Kc1n 273 1 . 1 8 . 0 n Kc2.06673.6667n1.6667n² 274 n 1 . 1 Kc0.05 (8) 275
Assessment of the global horizontal irradiation (GHI) on the ground was obtained by
276
combining the clear-sky index (Kc) [39] and the clear-sky irradiation (Gch) using the
277
following equation (9):
278
GHI = Kc * Gch (9)
279
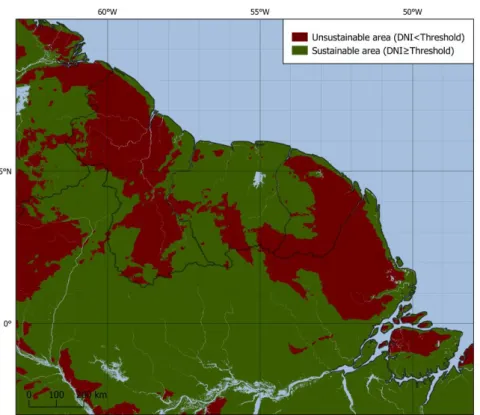
The clear-sky irradiation (Wh.m-2) is the irradiation on the ground in the case of a cloudless
280
sky, only attenuated by aerosols and gases. We derived it using the ESRA model [27] in
281
which attenuations by aerosols and gases (scattering by aerosols, absorption by gases) are
282
modeled using the Linke turbidity factor (TL). Climatological values of TL, calculated over 20
283
years (1983 – 2003), were obtained via the SoDa website as a monthly set of values. The
284
methodology used to obtain these values has been published by [40]. Monthly values were
285
temporally and linearly interpolated in order to obtain daily values. For the selected window
286
concerning the Guiana Shield, the Linke turbidity factor is equal to 4.1 on average,
287
corresponding to a hot and moist air, and varies between 2.9 in the dry season and 6.1 in the
288
wet season. We did not adopt a fixed Linke turbidity factor, as was the case in Albarelo et al.
289
[14], because of the extent of the study zone and the variability of TL across different zones.
290
To obtain the direct normal irradiation (DNI), we used the following formulas:
291
Gch = Dch + Bch (10)
292
where Dch is the diffuse clear sky irradiation (Wh.m-2) and Bch is the direct clear sky
293
irradiation (Wh.m-2). Then, the following equation was used:
294
BHI = Kc * Bch (11)
295
DNI = BHI / cos(θz) (12)
296
where BHI is the direct hourly irradiation (Wh.m-2) and DNI is the direct irradiation normal to
297
a surface (Wh.m-2).
298 299
9
4. Results and discussion 300
301
4.1. Validation 302
We assess estimates of the optimized Heliosat-2 method by using two types of data :
303
in situ measurement data and SARAH solar radiation data. Validation of the GHI estimates
304
derived from the optimized Heliosat-2 method is first performed by comparing global
305
irradiation measurements from six ground stations located in French Guiana. Figure 2 exhibits
306
the scatter plots between hourly GHI estimates from optimized Heliosat2 and hourly
307
measured GHI. In order to see if the local conditions have an impact on the skill of the model,
308
separate scatter plots between estimated GHI and measured GHI were constructed for each
309
station. The dotted line with a slope of one represents the ideal case, in which optimized
310
Heliosat2 estimations would be identical to the measured data. The full line represents the
311
least-square fitting line. GHI comprise a large variety of hourly irradiation, the dots cover a
312
large range of values : [0, 1000 Wh.m-²] which lie along the line 1:1. The scattering is weak
313
indicating that the optimized Heliosat-2 method reproduces well the GHI. Scatter plots are
314
similar for stations near the ocean and for inland stations. We note, however, a small
315
overestimation for low irradiation values as seen by a high density of dots above the ideal
316
regression line (dotted line in Figure 2). Nevertheless, the effect of this overestimation is
317
limited because of its small contribution to the daily irradiation. Statistical indices RMSE,
318
Bias and correlation coefficient for each station are summarized in Table 2. The statistical
319
errors calculated on these six stations agree with the results obtained from the Heliosat-2
320
method for other geographical zones [41-45]. The correlation coefficient (CC) varies between
321
0.92 and 0.95 (Table 2). The day-to-day variations are well represented by the optimized
322
Heliosat2 data for all sites The relative MBE and the relative RMSE are normalized by their
323
mean values. RMSE values are around 18% and biases are close to 1% for all stations. The
324
method produces good results in estimating hourly GHI for all stations regardless of their
325
geographical location.
326 327
Table 2. Comparison between hourly GHI from optimized Heliosat-2 and hourly measured GHI (in 328
Wh.m-2) for 2010-2013 period. In brackets, quantities are relative to the mean measured GHI. 329 330 331 332 333 334 335 336 Station Number of records CC RMSE Wh.m-2 (%) Bias Wh.m-2 (%) Saint Georges 8995 0.92 96 (20%) 8 (2%) Rochambeau 8204 0.92 98 (19%) -1 (0%) Kourou 9242 0.94 91 (17%) 7 (1%) Ile Royale 8394 0.95 86 (15%) 3 (1%) Saint Laurent 8657 0.92 96 (19%) 5 (1%) Maripasoula 8053 0.92 94 (18%) -1 (0%) All Stations 51545 0.93 94 (18%) 4 (1%)
10 337
Figure 2. Comparison between hourly GHI from optimized Heliosat2 and hourly measured GHI for 338
the 2010-2013 period for the 6 stations in French Guiana. 339
340
Solar radiation estimates from the optimized Heliosat-2 method were thoroughly compared
341
with solar radiation estimates from SARAH database [29, 30].First we evaluated the accuracy
342
of the SARAH data by comparing the SIS-SARAH estimates with GHI measurements using
343
statistical methods. Table 3. summarizes statistical errors between SIS-SARAH estimates and
344
in situ GHI measurements. Comparatively to Table 2, the overall bias increases by 16 Wh/m²
345
(3 %) indicating that SIS-SARAH overestimates the GHI. The overall RMSE increases by 37
346
Wh/m² (7%). The correlation coefficient drops to an overall value of 0.88. Figure 3 exhibits
347
the scatter plots between hourly SIS-SARAH estimates and hourly measured GHI for each
348
station. The dots are scattered over the regression line which may explain the lower value of
349
the correlation coefficient and the overestimation of the SIS-SARAH. The scatter plots show
350
that the GHI estimates from SARAH is less accurate than GHI estimates from optimized
351
Heliosat-2. The discrepancies in performances of the SIS-SARAH estimates are probably due
352
to the longitude of the Meteosat satellite (0°) with respect to the eccentric position of the
353
stations that may contribute to the bias uncertainty because what the satellite sees is not
354
exactly what is happening in the atmospheric column right above a station. Albarelo et al. [14]
355
demonstrates that the satellite viewing angle has an impact on the accuracy of the estimates:
356
the smaller the satellite viewing angle, the better the accuracy of the estimates. Given the
357
location of the stations the deviation of the GOES-East satellite is lower than that of the
358
Meteosat satellite. It can be concluded that the GHI optimized Heliosat-2 estimates provide
359
best accuracy compared with SIS-SARAH estimates in estimating hourly global solar
360
irradiance.
11 362
Table 3. Comparison between hourly estimates from SIS-SARAH and hourly measured GHI (in 363
Wh.m-2) for the 2010-2013 period. In brackets, quantities are relative to the mean measured GHI. 364
365
366
367
Figure 3. Comparison between hourly estimates from SIS-Sarah and measured GHI for the 2010-2013 368
period for the 6 stations in French Guiana. 369
370
We also compare GHI from optimized Heliosat-2 method with SIS estimates from SARAH
371
database. Table 4. summarizes statistical errors between GHI from optimized Heliosat-2 and
372
SIS- SARAH. The mean bias is around -16 Wh/m² (-3 %) and the mean RMSE is 115 Wh/m²
373
(21%). The overall value of correlation coefficient is 0.90. Figure 4 exhibits the scatter plots
374
between GHI estimates from optimized Heliosat2 and SIS estimates from SARAH. The
375
scattering is important under the regression line indicating that the GHI from optimized
376
Heliosat-2 is underestimated comparatively to the SIS-SARAH data.
377 378 Station Number of records Slope Interception Wh.m-2 CC RMSE Wh.m-2 (%) Bias Wh.m-2 (%) Saint Georges 8995 0.89 97 0.85 143 (30%) 45 (9%) Rochambeau 8204 0.88 89 0.86 141 (28%) 30 (6%) Kourou 9242 0.96 47 0.90 124 (24%) 28 (5%) Ile Royale 8394 0.92 30 0.93 110 (20%) -15 (-3%) Saint Laurent 8657 0.89 67 0.85 139 (28%) 14 (3%) Maripasoula 8053 0.91 66 0.87 129 (24%) 17 (3%) All Stations 51545 0.91 68 0.88 131 (25%) 20 (4%)
12 Table 4. Statistical errors between hourly estimates from GHI optimized Heliosat-2 and SIS-Sarah for 379 the 2010-2013 period 380 381 382 383
Figure 4. Comparison between hourly estimates from GHI optimized Heliosat-2 and SIS-Sarah for the 384
2010-2013 period and for the 6 stations in French Guiana. 385
386
Since no measurements of DNI are available, we compare DNI estimates from
387
SARAH database and DNI from optimized Heliosat-2 method. Table 5 summarizes statistical
388
errors between DNI- SARAH estimates and DNI estimates from optimized Heliosat-2. The
389
mean bias is around -5 Wh/m² (-1 %) and the mean RMSE is 180 Wh/m² (42%). The overall
390
value of correlation coefficient is 0.76. Again, DNI from optimized Heliosat-2 is
391
underestimated comparatively to the SIS-SARAH data. Since SARAH data tends to
392
overestimate solar radiation, it can be concluded that the Heliosat-2 estimates are relevant and
393
correctly reproduce the solar radiation values.
394 395 Station Number of records Slope Interception (Wh.m-2) CC RMSE Wh.m-2 (%) Bias Wh.m-2 (%) Saint Georges 8995 0.80 69 0.88 127 (24%) -37 (-7%) Rochambeau 8204 0.80 76 0.88 129 (24%) -31 (-6%) Kourou 9242 0.83 75 0.92 111 (20%) -20 (-4%) Ile Royale 8394 0.87 88 0.93 108 (20%) 18 (3%) Saint Laurent 8657 0.84 73 0.90 113 (22%) -9 (-2%) Maripasoula 8053 0.82 80 0.93 98 (18%) -18 (-3%) All Stations 51545 0.83 75 0.90 115 (21%) -16 (-3%)
13 Table 5. Statistical errors between hourly estimates from DNI-optimized Heliosat-2 and DNI-Sarah 396
for the 2010-2013 period for the 6 stations in French Guiana. 397
398 399 400
4.2. Global and direct irradiation potential 401
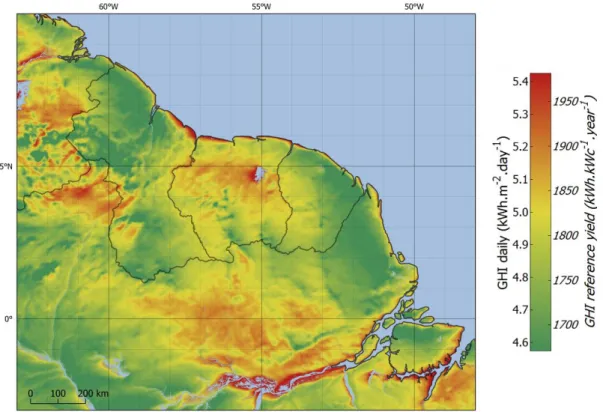
Figure 5 is a map of the daily average GHI from 2010 to 2015. For the whole study
402
area, GHI daily average values vary from 4.46 to 5.48 kWh.m-2.day-1. Zones showing the best
403
global solar potential are mostly coastal zones up to a distance of 5 to 10 km from the
404
coastline. Here, we find an irradiation potential 8 to 12 % higher than the mean value of
405
global irradiation. This can be explained by the specific wind system and the sea
406
breeze phenomenon that diminishes diurnal clouds in coastal zones [46]. This phenomenon is
407
also observed at the mouths of rivers. Zones located west of stretches of water also show 10
408
% higher GHI. Four zones can be distinguished with a potential greater than 5 kWh.m-2.day-1:
409
east Venezuela, the Venezuela/Guyana/Brazil border, the central strip of Suriname, and north
410
Brazil.
411
412
Figure 5. Map of the annually averaged daily global irradiation (GHI) and the annual reference yield 413
for photovoltaic energy production 414 415 416 Station Number of records CC RMSE in Wh.m-2 (%) Bias in Wh.m-2 (%) Saint Georges 8995 0.70 181 (44%) -13 (-3%) Rochambeau 8204 0.72 187 (43%) -13 (-3%) Kourou 9242 0.82 175 (37%) -37 (-8%) Ile Royale 8394 0.79 187 (40%) -8 (-2%) Saint Laurent 8657 0.72 186 (49%) 28 (7%) Maripasoula 8053 0.75 165 (41%) 18 (5%) All Stations 51545 0.76 180 (42%) -5 (-1%)
14
For most of the study zone, results show that the range of GHI values on the Guiana
417
Shield (between 4.2 and 5.6 kWh.m-2.day-1) agree with the range of GHI values in tropical
418
regions published in other studies. This solar energy potential is nearly three times higher than
419
in countries of the European Union [19], where initiatives towards solar energy are more
420
widespread [47-49]. However, if we compare the average solar potential in the Guiana Shield
421
(4.91 kWh.m-2.day-1) to that of other studies conducted in tropical zones, for example, we
422
notice that it is slightly lower. Indeed, the average GHI of the whole Guiana Shield is lower
423
than in Myanmar and in Cambodia, where it is approximately 5.1 kWh.m-2.day-1 [15-16], as
424
well as in Djibouti (5.92 kWh.m-2.day-1) [50]. This is almost certainly because of the regular
425
presenceof cloud masses in the Guiana Shield due to the ITCZ.
426 427
On the other hand, the average GHI value agrees with that from Pereira et al. [19], in
428
the framework of the SWERA (Solar and Wind Energy Resources Assessment) project that
429
resulted in the creation of the Brazilian Solar Energy Atlas. The GHI reported in the Atlas is
430
equal to 5.5 kWh.m-2 with a bias of 7 % (353.48 Wh.m-2) and a RMSE of 15 % (640.29
431
Wh.m-2). This average potential corresponds to the GHI values in Figure 5. Figure 5 also
432
shows the spatial distribution of the annual average potential production of photovoltaic
433
energy. The second scale of the map (annual reference yield) indicates the theoretical number
434
of hours in the year that a photovoltaic system would run at maximum efficiency. The higher
435
this indicator is, the higher the production of photovoltaic energy. This indicator is especially
436
useful because it allows refining of the size of photovoltaic facilities as a function of the
437
location and the amount of energy required. In terms of GHI, production potential is highest
438
in the north of Brazil, Suriname, and Venezuela. On average, the production potential of
439
photovoltaic energy of the Guiana Shield is about 1780 kWh/kWc.year-1.
440 441
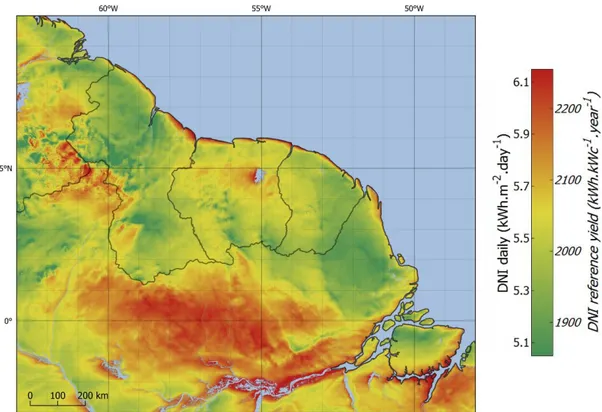
Figure 6 shows the distribution of the annually averaged daily DNI on the Guiana
442
Shield. The direct irradiation values are between 5.11 and 6.24 kWh.m-2.day-1. Three zones
443
can be distinguished with a potential greater than 5.8 kWh.m-2.day-1: the
444
Venezuela/Guyana/Brazil border region, the surroundings of the Brokopondo reservoir in
445
Suriname, and northern Brazil. The daily mean value of DNI reaches 5.64 kWh.m-2.day-1,
446
which correspondsto the average DNI from the Brazilian Atlas, which reaches 5.4 kWh.m-2.
447
Comparison of our estimates of GHI and DNI solar potential and the ones obtained in the
448
framework of the SWERA project (solar Atlas of Brazil) shows that our results for the
449
Brazilian part of the Guiana Shield agree with those obtained by other authors.
450 451
15 452
Figure 6. Map of the annually averaged daily direct normal irradiation (DNI) and the annual 453
reference yield for photovoltaic energy production 454
455
4.3. Spatiotemporal indicators 456
457
This section proposes the development of innovative maps for describing land relative
458
suitability indices for the implementation of solar energy systems (PV and CSP) over the
459
Guiana Shield. This implementation requires knowledge of: a) areas with specific
460
characteristics of land slope and land use, although, since remote inhabited locations are
461
common on the Guiana Shield, land accessibility (distance from the roads and electricity
462
transmission grid) has not been considered as a constraint; and b) solar irradiance
463
characteristics, since weather conditions of the Guiana Shield have high spatiotemporal
464
variability (due to the ICTZ) characterized by extreme rainfall during the wet season and
465
partly cloudy skies during the dry season. Consideration of these two conditions is
466
challenging but necessary for understanding their effect on solar irradiance, as well as solar
467 energy systems. 468 469 4.3.1 Slope indicator 470
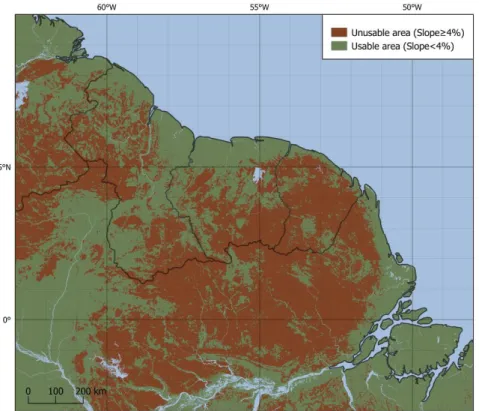
Several research studies have demonstrated that a significant slope is a limiting factor
471
for the implementation of both PV and CSP plants [51]. Figure 7 shows a map of usable areas
472
with a slope less than 4 % (or approximately 2.29°). The threshold value of the slope is based
473
on the work of Gherboudj & Ghedira [20]. It is noted that land within the center of the Guiana
474
Shield is not favorable for installation of solar plants over very large areas (several km²),
475
because of the hilly nature of the area. Areas with lower relief, allowing the installation of
476
photovoltaic plants over large areas, are located on the coast, in the border region between
16
Venezuela, Guyana, the southwest part of the Guiana Shield, and in the mouth of the Amazon.
478
These latter areas are considered suitable for the setting of both PV and CSP facilities and
479
represent an area of 54 % from the Guiana Shield total land.
480 481
482
Figure 7. Map of usable areas for photovoltaic energy production
483 484
4.3.2 Operability Indicator
485
Figures 8 and 9 show the operability indicator maps. This spatial indicator represents
486
areas where resource exploitation is sustainable, because the average annual energy potential
487
is above a minimum threshold. This minimum level of exploitability is set to 1600 kWh.m
-488 2
.year-1 for GHI [25] and 2000 kWh.m-2.year-1 for DNI [52]. Very few areas are affected by
489
this exclusion with regards to GHI (1 % of the Guiana Shield total land). The areas excluded
490
due to the DNI threshold are more important, especially in the northeast, Amapá, and across
491
the mountainous areas on the border between Guyana and Venezuela. These areas represent
492
an area of 31 % from the Guiana Shield total land.
493 494
17 495
Figure 8. Map of sustainable areas for photovoltaic energy production
496
497
Figure 9. Map of sustainable areas for concentrator solar power energy production
498
4.3.3 Suitable indicator
499
Figure 10 shows the result map of combination of the slope indicator and the
500
operability indicator. This map represents areas where solar resource exploitation is suitable
501
for PV (GHI) or/and CSP (DNI) power plants. The first limitation of the suitable areas is due
18
to the terrain slope. The second limitation is due to the minimum level of exploitability
503
described as a minimum average annual energy potential threshold under which the area is
504
considered as unsustainable. It should be noted that areas sustainable for DNI are sustainable
505
for GHI as well. Table 6 shows the total surface area occupied by each class of suitability.
506
This results show that 46% of the land is unsuitable, mainly due to high terrain slope, 54% of
507
the land is suitable of PV plants and 40% for both PV and CSP plants. Mainly, all coast areas
508
are suitable for both PV and CSP plants, as well as the border of Amazon river and the main
509
part of the state of Roraima in North Brazil.
510
Table 6. Surface area of each class of suitability for photovoltaic and concentrator solar
511
power energy production
512 513 514 515 516 517 518
Figure 10. Map of suitable areas for photovoltaic and concentrator solar power energy production 519
520
4.3.4 Variability indicator
521
Figure 11 is a map of the inter-day GHI variability calculated for the period of
2010-522
2015. The inter-day variability was calculated as the standard deviation of daily radiation
523
averaged over the year. Average GHI variability is 0.80 kWh.m-2 with a range from 0.54 to
524
1.20 kWh.m-2. Figure 12 shows the map of the average inter-day DNI variability, also
525
Operability Class Surface area
(103 km2)
Surface area (%)
Unsuitable area 706 46
Suitable area for PV only 222 14
19
calculated on an annual basis from 2010-2015. The values range between 0.58 and 1.58
526
kWh.m-2 with an average of 1.00 kWh.m-2. Overall, the Guiana Shield GHI has a variability
527
of less than 0.8 kWh.m-2 except in three zones: northwest Guyana, a region including
528
northeast Suriname, French Guiana and northeast Brazil, and part of the northern region of
529
Brazil.
530
531
Figure 11. Map of the annual inter-day standard deviation of GHI 532
In the context of photovoltaic power generation, knowledge of the standard deviation of the
533
solar potential provides information on the variability of photovoltaic electricity. Variability
534
characterizes the intermittency of the solar resource. In order to stabilize the production of
535
solar energy, photovoltaic plants built in areas with a high standard deviation of the solar
536
potential will have higher energy storage requirements, and electricity production to the grid
537
will be very unstable. Therefore, knowledge of the inter-daily standard deviation allows us to
538
evaluate the need to integrate predictive photovoltaic systems that are connected to the
539
network.
540
Indeed, when solar electricity production is anticipated, this reduces the electrical hazard for
541
the network. The higher the standard deviation, the more prediction systems will be needed to
542
reduce this hazard. Knowledge of inter-day standard deviation is also a support factor in the
543
decision to install photovoltaic power plants in a given area, because the implementation
544
strategy will differ depending on the standard deviation of solar potential. Several studies
545
show that, in areas where the solar potential variability is high, it is best to deploy multiple
546
small power plants instead of one large power plant (e.g., 9 plants of 1.1 MW instead of a 10
547
MW plant) [53] because the "profusion effect" allows the grid to more effectively absorb
548
solar electricity variations.
20 550
551
Figure 12. Map of the annual inter-day standard deviation of DNI 552
4.3.5 Optimal orientation indicator
553
Figure 13 shows a map of the orientation indicator, which allows for decisions
554
regarding solar panel orientation in order to make optimal use of the solar resource. The
555
orientation indicator was obtained by calculating the ratio between the energy received before
556
and after solar noon (AM/PM ratio) for each pixel. This indicator represents the maximum
557
direction of solar potential depending on the time of the day (before solar noon or after solar
558
noon). In areas shown in green, the AM/PM ratio is greater than 1, which corresponds to a
559
surplus of energy receipt before solar noon, thus optimal solar resource exploitation will
560
prioritize an eastern orientation of solar collectors (in the case of fixed orientation solar
561
systems).
562
In the areas shown in brown, the AM/PM ratio is less than 0.8, which corresponds to
563
an energy surplus received after solar noon, therefore optimal use of the solar resource will
564
favor an orientation towards the west. Of course, this orientation indicator only summarizes
565
information on the most accurate optimum angle and adjusting the orientation of the solar
566
collectors should be considered to maximize the performance of any proposed solar power
567
plant.
568 569
21 570
Figure 13. Map of orientation indicator 571
572
5. Conclusions 573
574
In this article, we have estimated the solar potential in the Guiana Shield and the
575
operability of the solar resource. We used the Heliosat-2 method, optimized by Albarelo et al.
576
[9], to exploit images of the geostationary meteorological satellite GOES. We estimated the
577
global horizontal irradiation (GHI) and direct normal irradiation (DNI) for the entire area
578
using the visible channel images from the GOES-13 satellite from April 2010 to July 2015, on
579
an hourly basis and with a spatial resolution of 1 km x 1 km. The resulting time series allowed
580
us to map the daily average global and direct solar radiation. In addition, we created indicator
581
maps to identify:
582
- the annual average solar potential (GHI and DNI);
583
- operational areas that can be employed for solar systems, which correspond to areas with a
584
slope less than 4 %. Consideration of the impacts of the land capability map decreased the
585
suitable areas for solar power plants to 48.6 %;
586
- areas where exploitation of the solar resource is not viable due to insufficient energy
587
potential, i.e. energy potential below a minimum threshold (1600 kWh.m-2.year-1 for GHI
588
and 2000 kWh.m-2.year-1 for DNI);
589
- inter-day variability of DNI and GHI over 5 years;
22
- the optimum orientation of the solar panels in order to effectively exploit the solar
591
resource.
592
This is the first study to produce spatiotemporal indicator maps on the exploitability of the
593
solar resource. They bring new knowledge regarding the solar potential in the Guiana Shield
594
and can help promote the exploitation of solar energy systems such as photovoltaic plants,
595
solar water heaters (GHI), or solar concentrators (DNI). By making such knowledge available,
596
the authors wish to contribute to the development of renewable energy and help mitigate
597
climate change.
598
We aware that our research may have one limitation which lies in the limited number of
599
ground stations used for the validation of the method. It would have been interesting to have
600
better spatially distributed ground stations throughout the Guiana Shield to validate the
601
radiation estimates.
602
Future work is planned in order to map the solar potential on the entire South American
603
continent by validating radiation estimates from Baseline Surface Radiation Network (BSRN)
604
stations present in the region.
605
Acknowledgments 606
The authors thank the FEDER European program in French Guiana, and Meteo France, who
607
enabled the realization of this study within the SOLAREST research project.
608 609
23
References 610
611
[1] International Energy Agency - Photovoltaic Power Systems Program. 2015. Trends 2015 in 612
Photovoltaic Applications. 613
[2] IRENA. 2015. Renewable Energy Policy Brief: Brazil. IRENA, Abu Dhabi. 614
[3] IRENA. 2015. Renewable Energy Policy Brief: Guyana. IRENA, Abu Dhabi. 615
[4] IRENA. 2015. Renewable Energy Policy Brief: Suriname. IRENA, Abu Dhabi. 616
[5] IRENA. 2015. Renewable Energy Policy Brief: Venezuela. IRENA, Abu Dhabi. 617
[6] Perez, R., Schlemmer, J., Renne, D., Cowlin, S., George, R. and Bandyopadhyay, B. 2009. 618
“Validation of the SUNY Model in a Meteosat Environment”. Proceedings of ASES Annual 619
Conference, Buffalo, New York. 620
[7] Pinker, R., and Laszlo, I. 1992. “Modeling Surface Solar Irradiance for satellite applications on a 621
global scale.” Journal of Applied Meteorology, Vol. 31, pp. 194–211. 622
[8] Janjai, S., Pankaew, P. and Laksanaboonsong, J. 2009. A model for calculating hourly global 623
solar radiation from satellite data in the tropics. Applied Energy, Vol. 86, Issue 9, pp 1450–1457 624
[9] Cano, D., Monget, J.M., Albuisson, M., Guilllard, H., Regas, N. and Wald, L. 1986. “A method 625
for the determination of the global solar radiation from meteorological satellite data”. Solar Energy, 626
Vol. 37, pp. 31-39. 627
[10] Rigollier, C., Lefèvre, M. and Wald, L. 2004. “The method Heliosat-2 for deriving shortwave 628
solar radiation from satellite images”. Solar Energy, Vol. 77, No. 2, pp. 159-169. 629
[11] Perez R., P. Ineichen, K. Moore, M. Kmiecik, C. Chain, R. George and F. Vignola. 2002. A New 630
Operational Satellite-to-Irradiance Model. Solar Energy, Vol. 73, 5, pp. 307-317. 631
[12] Martins, F., Pereira, E. and Abreu, S. 2007. “Satellite-derived solar resource maps for Brazil 632
under SWERA project”. Solar Energy, Vol. 81, No. 4, pp. 517-528. 633
[13] Zhipeng Qu. La nouvelle méthode Heliosat-4 pour l’évaluation du rayonnement solaire au sol. 634
PhD Thesis. Ecole Nationale Supérieure des Mines de Paris, 2013. 635
[14] Albarelo, T., Marie-Joseph, I., Primerose, A., Seyler, F., Wald, L. and Linguet, L. 2015. 636
“Optimizing the Heliosat-II Method for Surface Solar Irradiation Estimation with GOES Images”. 637
Canadian Journal of Remote Sensing: Journal Canadien de télédétection, Vol. 41, No. 2, pp. 86-100. 638
[15] Janjai, S., Pankaew, P., Laksanaboonsong, J. and Kitichantaropas, P. 2011. “Estimation of solar 639
radiation over Cambodia from long-term satellite data”. Renewable Energy, Vol. 36, pp. 1214-1220. 640
[16] Janjai, S., Masiri, I. and Laksanaboonsong, J. 2013. “Satellite-derived solar resource maps for 641
Myanmar”. Renewable Energy, Vol. 53, pp. 132-140. 642
[17] Gastli, A. and Y. Charabi. 2010. « Solar electricity prospects in Oman using GIS-based solar 643
radiation maps ». Renewable and Sustainable Energy Reviews, Vol. 14, pp. 790-797. 644
[18] Pillot, B., Muselli, M., Poggi, P. and Dias J. B. 2015. “Satellite-based assessment and in situ 645
validation of solar irradiation maps in the Republic of Djibouti”. Solar Energy, Vol. 120, pp. 603-619. 646
[19] Pereira, E.B., Martins, F.R., Abreu, S.L. and Rüther R. 2006. Atlas Brasileiro de Energia Solar. 647
ISBN 978-85-17-00030-0. 60 p. 648
[20] Pereira, E., Martins, F., Abreu, S., Couto, P., Stuhlmann, R. and Colle, S. 2000. “Effects of 649
burning of biomass on satellite estimations of solar irradiation in Brazil”. Solar Energy, Vol. 68, No. 1, 650
pp.91-107. 651
[21] Martins, F. and Pereira, E. 2006. “Parameterization of aerosols from burning biomass in the 652
Brazil-SR radiative transfer model”. Solar energy, Vol. 80, pp. 231-239. 653
24 [22] Martins, F., Pereira, E. and Abreu, S. 2007. “Satellite-derived solar resource maps for Brazil 654
under SWERA project”. Solar Energy, Vol. 81, No. 4, pp. 517-528. 655
[23] Polo, J., Bernardos, A., Navarro, A.A., Fernandez-Peruchena, C.-M., Ramìrez, L., Guisado, M.V. 656
and Martìnez, S. 2015. “Solar resources and power potential mapping in Vietnam using satellite-657
derived and GIS-based information”. Energy Conversion and Management, Vol. 98, pp. 348-358. 658
[24] Mahtta, R., Joshi, P.K. and A.K. Jindal. 2014. “Solar power potential mapping in India using 659
remote sensing inputs and environmental parameters”. Renewable Energy, Vol. 71, pp. 255-262. 660
[25] Gherboudj, I. and Ghedira H. 2016. “Assessment of solar energy potential over the United Arab 661
Emirates using remote sensing and weather forecast data”. Renewable and Sustainable Energy 662
Reviews, Vol. 55, pp. 1210-1224. 663
[26] Gond, V., Freycon, V., Molino, J.-F., Brunaux, O., Ingrassia, F. et al. 2011. “Broad-scale spatial 664
pattern of forest landscape types in the Guiana Shield”. International Journal of Applied Earth 665
Observation and Geoinformation, pp. 357-367. 666
[27] Rigollier, C., Bauer, O. and Wald, L. 2000. “On the Clear Sky model of the ESRA – European 667
Solar Radiation Atlas – with respect to the Heliosat method”. Solar Energy, Vol. 68, No. 1, pp. 33-48. 668
[28] Jarvis, A., H.I. Reuter, A. Nelson, E. Guevara, 2008. Hole-filled SRTM for the globe Version 4, 669
available from the CGIAR-CSI SRTM 90m Database (http://srtm.csi.cgiar.org) 670
[29] Posselt, R., Mueller, R.W., Stöckli R., Trentmann, J. 2012. Remote sensing of solar surface 671
radiation for climate monitoring - the CM-SAF retrieval in international comparison. Remote Sensing 672
of Environment Vol. 118, pp. 186–198. 673
[30] Müller, Richard; Pfeifroth, Uwe; Träger-Chatterjee, Christine; Cremer, Roswitha; Trentmann, 674
Jörg; Hollmann, Rainer. 2015. Surface Solar Radiation Data Set - Heliosat (SARAH) - Edition 1. 675
Satellite Application Facility on Climate Monitoring. 676
DOI:10.5676/EUM_SAF_CM/SARAH/V001. http://dx.doi.org/10.5676/EUM_SAF_CM/SARAH/V0 677
01 678
[31] Almorox, J., Benito, M. and Hontoria, C. 2008. “Estimation of Solar Radiation in Venezuela”. 679
Interciencia, Vol. 33, No. 4, pp. 280-283. 680
[32] WMO. 2008. Guide to Meteorological Instruments and Methods of Observation. WMO-No. 8. 681
Geneva: World Meteorological Organization. 682
[33] Geiger M., Diabaté L., Ménard L., Wald L., 2002. A web service for controlling the quality of 683
measurements of global solar irradiation. Solar Energy, Vol. 73, No 6, pp. 475-480 684
[34] SoDa – Solar radiation Data. http://www.soda-is.com/eng/index.html. 685
[35] Diabaté, L., Demarcq, H., Michaud-Regas, N. and Wald, L. 1988. “ Estimating incident solar 686
radiation at the surface from images of the Earth transmitted by geostationary satellites : the Heliosat 687
Project “. International Journal of Solar energy, Vol. 5, pp. 261 -278. 688
[36] Nguyen, L., Doelling, D.R., Minnis, P. and Ayers, J.K. 2004. “Rapid technique to cross calibrate 689
satellite imager visible channels”. In Proceedings of SPIE 49Th Annual Meeting, Earth Observing 690
Systems IX Conference, August 2-6, Denver, CO, United States. Vol. 5542, pp. 227-235. 691
[37] Rigollier, C. and Wald, L. 1998. “Using Meteosat images to map the solar radiation: 692
improvements of the Heliosat method”. In Proceedings of the 9th Conference on Satellite Meteorology 693
and Oceanography.Published by Eumetsat, Darmstadt, Germany, EUMP22, pp.432-433. 694
[38] Hammer, A., Heinemann, D., Hoyer, C., Kuhlemann, R., Lorenz, E., Mueller, R. and Beyer, H.G. 695
2003. “Solar energy assessment using remote sensing technologies”. Remote Sensing of Environment, 696
Vol. 86, pp. 423-432. 697
[39] Beyer, H.G., Constanzo, C. and Heinemann, D. 1996. “Modifications of the Heliosat procedure 698
for irradiance estimates from satellite images”. Solar Energy, Vol. 56, No. 3, pp.207-212. 699
25 [40] Remund, J., Wald, L., Lefèvre, M., Ranchin, T. and Page, J. 2003. “Worldwide Linke turbidity 700
information”. In Proceedings of ISES Solar World Congress, 16-19 June 2003, Göteborg, Sweden. 701
[41] Lefèvre, M., Wald, L., and Diabaté, L. 2007. “Using reduced data sets ISCCP-B2 from the 702
Meteosat satellites to assess surface solar irradiance.” Solar Energy, Vol. 81: pp. 240–253. 703
[42] Aculinin, A. 2008. “Latitudinal variability of surface solar radiation in Moldova”. Moldavian 704
Journal of the Physical Sciences, Vol. 7, pp. 247-253. 705
[43] Abdel Wahab, M., El-Metwally, M., Hassan, R., Lefèvre, M., Oumbe, A. and Wald, L. 2010. 706
“Assessing surface solar irradiance and its long-term variations in the northern Africa desert climate 707
using Meteosat images”. International Journal of Remote Sensing, Vol. 31, No. 1, pp. 261-280. 708
[44] Al-Jumaily, K.J, Al-Salihi, A.M. and Al-Tai, O.T. 2010. “Evaluation of Meteosat-8 709
measurements using daily global solar radiation for two stations in Iraq”. International Journal of 710
Energy and Environment, Vol. 1, pp. 635-642. 711
[45] Zhang, M., Liu, J., Li, G., Fan, J., Deng, H., Ren, J. and Chen, Z. 2011. “Solar Irradiance 712
estimated from FY-2 data at some North China sites”. In Proceedings of the Geoscience and Remote 713
Sensing Symposium (IGARSS) 2011, July 24-29, Vancouver, BC, Canada, pp. 3284-3287. 714
[46] Météo-France. 2011. Le climat guyanais. ISBN 978-2-11-128228-5. 57p. 715
[47] Fontoynont, M., Dumortier, D., Heinemann, D., Hammer, A., Olseth, J.A., Skarveit, A., Ineichen, 716
P., Reise, C., Page, J., Roche, L., Beyer, H.G. and Wald, L. 1997. “Satel-Light, Processing of 717
Meteosat data for the production of high quality daylight and solar radiation data available on a World 718
Wide Web Internet server. Mid-term progress report JOR3 – CT 95 – 0041”. Project Satel-Light, for 719
the Commission of the European Communities, Ecole Nationale des Travaux Publics de l’Etat, Vaulx-720
en-Velin, France. 721
[48] Gschwind, B., Ménard, L., Albuisson, M. and Wald, L. 2006. “Converting a successful research 722
project into a sustainable service: The case of the SoDa Web service”. Environmental Modelling & 723
Software, Vol. 21, pp. 1555-1561. 724
[49] Blanc, P., Gschwind, B., Lefèvre, M. and Wald, L. 2011. “The HelioClim Project: Surface Solar 725
Irradiance Data for Climate Applications”. Remote Sensing, Vol. 3, pp.343-361. 726
[50] Pillot, B., Muselli, M., Poggi, P. and Dias J. B. 2015. “Satellite-based assessment and in situ 727
validation of solar irradiation maps in the Republic of Djibouti”. Solar Energy, Vol. 120, pp. 603-619 728
[51] Robbins N, Burger M. “Feasibility of Solar Power in South Africa and the existing barriers to its 729
implementation”. 4th Virtual International Conference on Advanced Research in Scientific Areas 730
(ARSA-2015) Slovakia, November 9 - 13, 2015. 731
[52] International Energy Agency. 2010. World Energy Outlook 2010. 732
[53] Australian Renewable Energy Agency. 2015. Investigating the Impact of Solar Variability on 733
Grid Stability. 734