HAL Id: hal-01898398
https://hal.univ-brest.fr/hal-01898398
Submitted on 12 Apr 2021HAL is a multi-disciplinary open access
archive for the deposit and dissemination of sci-entific research documents, whether they are pub-lished or not. The documents may come from teaching and research institutions in France or abroad, or from public or private research centers.
L’archive ouverte pluridisciplinaire HAL, est destinée au dépôt et à la diffusion de documents scientifiques de niveau recherche, publiés ou non, émanant des établissements d’enseignement et de recherche français ou étrangers, des laboratoires publics ou privés.
Variable Ni isotope fractionation between
Fe-oxyhydroxides and implications for the use of Ni
isotopes as geochemical tracers
Bleuenn Gueguen, Jeffry Sorensen, Stefan Lalonde, Jasquelin Peña, Brandy
Toner, Olivier Rouxel
To cite this version:
Bleuenn Gueguen, Jeffry Sorensen, Stefan Lalonde, Jasquelin Peña, Brandy Toner, et al.. Variable Ni isotope fractionation between Fe-oxyhydroxides and implications for the use of Ni isotopes as geo-chemical tracers. Chemical Geology, Elsevier, 2018, 481, pp.38 - 52. �10.1016/j.chemgeo.2018.01.023�. �hal-01898398�
1
Chemical Geology
March 2018, Volume 481 Pages 38-52
http://dx.doi.org/10.1016/j.chemgeo.2018.01.023 http://archimer.ifremer.fr/doc/00423/53473/
© 2018 Elsevier B.V. All rights reserved.
Archimer
http://archimer.ifremer.fr
Variable Ni isotope fractionation between Fe-oxyhydroxides
and implications for the use of Ni isotopes as geochemical
tracers
Gueguen Bleuenn 1, 2, *, Sorensen Jeffry V. 3, Lalonde Stefan 1, Pena Jasquelin 4, Toner Brandy M. 3, Rouxel Olivier 2
1
Univ Brest, Lab Geosci Ocean, Inst Univ Europeen Mer, UMR 6538, F-29280 Plouzane, France.
2
IFREMER, Ctr Brest, Unite Geosci Marines, F-29280 Plouzane, France.
3
Univ Minnesota, Dept Soil Water & Climate, St Paul, MN 55108 USA.
4
Univ Lausanne, Inst Earth Surface Dynam, CH-1015 Lausanne, Switzerland.
* Corresponding author : Bleuenn Gueguen, email address : bleuenn.gueguen@univ-brest.fr
Abstract :
Nickel (Ni) isotopes have recently emerged as a new biogeochemical tracer in marine environments, but our understanding of the mechanisms of Ni isotope fractionation in natural systems with regards to its fractionation by mineral surfaces is incomplete. This study aims to provide experimental constraints on Ni isotope fractionation during adsorption to goethite and 2-line ferrihydrite, two Fe minerals that vary in terms of distinct crystalline properties. We conducted two types of adsorption experiments: one with variable pH (5.0 to 8.0) and constant initial Ni concentration, one at a constant pH of 7.7 and variable initial Ni concentrations. Isotopic measurements were made on both the solid phase and the supernatant solutions in order to determine the Ni isotope fractionation factors (Δ60/58Nimin-aq = δ60/58Nimin − δ60/58Niaq) between the mineral and aqueous phases. Our results show preferential adsorption of lighter Ni isotopes during adsorption of Ni to Fe oxyhydroxides presumably under conditions of near equilibrium conditions. Adsorption to goethite generates the greatest fractionation, with Δ60/58Nimin-aq = −0.77 ± 0.23‰ (n = 14, 2sd), whereas adsorption to 2-line ferrihydrite samples yield Δ60/58Nimin-aq = −0.35 ± 0.08‰ (n = 16, 2sd). Using Ni K-edge extended X-ray absorption fine structure (EXAFS) spectroscopy, we found that Ni forms an inner-sphere complex and that its coordination environment does not vary significantly with pH nor with surface loading. In addition, we found no evidence of Ni incorporation into the mineral. We suggest that the more than two-fold increase in Ni isotope fractionation in goethite relative to 2-line ferrihydrite is due to the lower Ni-Fe coordination number in the second shell, which results in the formation of a weaker surface complex and thus favors the adsorption of lighter Ni isotopes. These results show that Ni isotope fractionation during sorption by Fe-oxyhydroxides is dependent on mineralogy, which has important implications for the use of Ni isotopes as environmental tracers and the interpretation of their record in sedimentary rocks.
26
1. Introduction
27 28
Nickel is a micro-nutrient in modern oceans and displays a nutrient-type profile in 29
seawater, where it is depleted in surface waters due to biological uptake (Bruland, 1980; Price 30
and Morel, 1991; Morel and Price, 2003). The evolution of marine biogeochemical Ni cycling 31
has become a topic of much interest as ancient metalliferous deposits because Banded Iron 32
Formations (BIF) appear to record a dramatic decrease in marine Ni concentrations through 33
geological time (Konhauser et al., 2009; Konhauser et al., 2015), attributed to a shift from 34
ultramafic volcanism and eruption of Ni-rich komatiites to basaltic volcanism as the Earth’s 35
crust cooled. Iron-rich sedimentary rocks such as Granular Iron Formations (GIF) and BIF 36
were deposited from seawater throughout much of the Precambrian and have been widely 37
used as an archive to reconstruct the geochemical composition of seawater in Precambrian 38
marine environments, in which Fe-oxyhydroxides were the carriers of trace metals (e.g., 39
Bekker et al., 2010). Hence, Ni isotope systematics of Iron Formations hold great promise for 40
the study of ancient biogeochemical cycles and paleo-environments. But first, the mechanisms 41
of Ni isotope fractionation during Fe-oxyhydroxide precipitation and burial need to be well 42
constrained. 43
The geochemical cycling of Ni in modern oceans is largely controlled by input from 44
continental weathering and riverine transport and removal from seawater through 45
precipitation in authigenic Mn-rich sediments (Sclater et al., 1976; Gall et al., 2013; Cameron 46
and Vance, 2014). Preliminary investigations have shown that seawater is characterized by an 47
average δ60/58Ni value of 1.44 ±0.15‰ (2sd, n=29) relative to the NIST SRM 986
48
international standard, which is heavier than the average crustal value (estimated at 0.05 49
±0.05‰; Gueguen et al., 2013). The riverine input flux is estimated at a δ60/58Ni value of
0.80‰ with a range of values from 0.29 ‰ to 1.34‰ (Cameron and Vance, 2014). The 51
oceanic output flux, dominated by authigenic Mn-oxyhydroxides (Krishnaswami, 1976; 52
Leinen, 1987; Koschinsky and Halbach, 1995; Manceau et al., 2002; Peacock and Sherman, 53
2007b), has a δ60/58Ni value of ~1.7‰ (i.e., the average Ni isotope composition of
54
hydrogenetic ferromanganese crusts as reported by Gall et al. (2013) and Gueguen et al. 55
(2016)). The isotopically heavy signature of rivers relative to the bulk crust implies that a 56
light Ni isotopic reservoir should be retained in the continental crust, probably during soil 57
formation (Ratié et al., 2015). Based on isotopic mass balance considerations, Cameron and 58
Vance (2014) identified a missing source of isotopically heavy Ni in modern oceans. 59
Alternatively, the heavy Ni isotopic composition of seawater could be balanced by an oceanic 60
sink enriched in light Ni isotopes, perhaps in sulfides (Gueguen et al., 2013; Hofmann et al., 61
2014) associated with anoxic or suboxic marine sediments enriched in organic matter that 62
accumulate in reducing environments (e.g., continental margins with strong upwelling 63
regimes, restricted anoxic basins, fjords). However, the role of organic-rich sediments in the 64
Ni isotope mass balance is unclear as bulk δ60/58Ni of organic-rich sediments display a large
65
range from 0.28‰ to 2.5‰ (Porter et al., 2014). 66
Large terrestrial Ni reservoirs exist in ultramafic complexes (Manceau and Calas, 67
1985; Valeton et al., 1987; Butt and Cluzel, 2013), and weathering of these complexes can 68
lead to significant Ni enrichment in laterites. While Ni released during weathering of 69
ultramafic complexes will have a greater affinity for Mn-oxides (Manceau et al., 1987), a 70
significant portion of Ni is in fact sequestered in the abundant Fe-oxides (mostly goethite) 71
formed during lateritization (Manceau et al., 2000; Quantin et al., 2008; Dublet et al., 2012; 72
Dublet et al., 2014; Ratié et al., 2015). In a recent study, Ratié et al. (2015) demonstrated that 73
weathering of ultramafic complexes leads to the enrichment of light Ni isotopes (by -0.47 ‰) 74
in Ni-rich laterites relative to unweathered bedrock, consistent with the preferential loss of 75
heavy Ni isotopes to the mobile phase and eventually to the riverine flux. Nickel in these 76
laterites is either incorporated into the mineral lattice or sorbed onto the mineral surface. 77
Nickel sorption on Fe-oxyhydroxides may therefore influence the isotope signature of Ni in 78
weathering environments, and in turn, the riverine flux of Ni to the oceans. 79
The use of Ni isotopes as biosignatures has also garnered attention in the recent 80
literature and the evolution of Ni biogeochemical cycling in the ancient oceans may be 81
recorded in the Ni isotope composition of coeval authigenic sediments. However, 82
understanding the isotope fractionation of metals such as Ni during adsorption to Fe-oxides 83
and other authigenic minerals is paramount to accurately reconstruct the biogeochemical 84
cycling of nutrients using the sedimentary record. Wasylenki et al. (2015) reported the 85
equilibrium Ni isotope fractionation factor during Ni sorption to ferrihydrite (experiments 86
done at room temperature), showing an enrichment of the light Ni isotopes on the solid phase 87
by -0.35 ±0.10 ‰ (1 sd). However, further studies are needed in order to evaluate in more 88
detail the mechanisms and range of parameters controlling Ni isotope fractionation during 89
adsorption onto mineral phases, including the effects of coordination environment or the type 90
of mineral phase (e.g., poorly crystalline versus more crystalline phases). For instance, 91
different Ni isotope fractionation could be expected among different Fe-oxyhydroxides based 92
on coordination chemistry considerations, because this effect has been observed for other 93
metal/metalloid isotope systems such as Cu, Ge, Mo and Zn (Pokrovsky et al., 2008; Li and 94
Liu, 2010; Wasylenki et al., 2011; Pokrovsky et al., 2014). These experimental data are 95
crucial to interpret the trace metal isotopic records in Iron Formations, where the mechanism 96
of formation of Fe-oxyhydroxides- precursor mineral phases and scavenging of trace metals 97
are poorly known, and to evaluate the preservation of the isotopic signal during 98
recrystallization. The role of iron oxides recrystallization on the Ni cycling is also important 99
to consider as it could have impacted the Ni signal preserved in Iron Formations (Frierdich et 100
al., 2011). 101
To address this problem, we conducted Ni adsorption experiments on two synthetic 102
Fe-oxyhydroxides, 2-line ferrihydrite and goethite, as a function of pH, variable Ni loading to 103
pre-formed minerals, (i.e., no co-precipitation) and duration of experiments. Our goal is to 104
mechanistically understand the isotope fractionation during Ni adsorption to Fe-phases with 105
different crystallinity, with special consideration to Ni speciation, coordination, and structure 106
of adsorbent. The local coordination environment of Ni at the mineral surface was evaluated 107
by Ni K-edge EXAFS spectroscopy, while the isotopic fractionation of Ni between solid and 108
aqueous phases were measured by Multi Collector-Inductively Coupled Plasma-Mass 109
Spectrometer (MC-ICP-MS) using double-spike (61Ni-62Ni) correction of instrumental mass
110
bias. Our results build on the results of Wasylenki et al. (2015) regarding the causes for Ni 111
isotope fractionation. We expand on the role of Fe-oxides in the transfer of continental Ni to 112
the oceans and in the biogeochemical cycling of Ni isotopes, furthering the development of Ni 113
isotopes as a geochemical tracer in surface environments. 114
115
2. Materials and methods
116 117
We used synthetic mineral phases to investigate surface driven Ni isotope 118
fractionation. The use of synthetic mineral phases allowed for Ni K-edge EXAFS 119
spectroscopy on samples with low Ni concentration without interference from significant 120
amounts of incorporated Ni. Goethite (α-FeOOH) and 2-line ferrihydrite were synthesized by 121
raising the pH of a Fe(NO3)3 solution with KOH at 25°C. Goethite was formed by heating the
122
solid precipitate at 70°C for 60 hours following the protocol of Cornell and Schwertmann 123
(2003). The precipitates were washed three times with ultrapure water and centrifuged at 124
7,000 rpm for 30 minutes. The goethite was stored freeze-dried while the 2-line ferrihydrite 125
was synthesized within 48 hours of each experiment and stored at -30°C. The synthetic 126
minerals were characterized by BET (Brunauer-Emmett-Teller) surface area, powder X-ray 127
diffraction, and electrophoretic mobility. For BET, samples were dried and degassed at 150°C 128
before specific surface area was measured by N2 adsorption (Micromeritics Tristar II 3020).
129
The specific surface areas for goethite and 2-line ferrihydrite were 25.5 and 119 ± 3 m2/g,
130
respectively. Bulk powder X-ray diffraction was performed using a Pananalytical X’Pert Pro 131
diffractometer (Characterization Facility, University of Minnesota). Mineral surface charge, 132
which is reflected in surface electrokinetic potential, was determined using a ZetaPALS 133
analyzer (Brookhaven Instruments Corp.) for 0.98 - 1.44 g/L of mineral suspended in 134
ultrapure water. Instrumental settings consisted of an applied voltage of 7.54V and electric 135
field of 9.29 V/cm. Data were acquired over 3 cycles of 5 measurements per mineral 136
(Electronic Annex, Table A1). 137
138
2.1. Nickel sorption experiments 139
140
For the Ni sorption experiments, a stock solution of 17 mmol/L Ni (1000 mg/L Ni) 141
was made with a Ni(NO3)2·H2O(aq) salt (Fischer Scientific). Aqueous suspensions were
142
prepared with 0.15 g of goethite or 2-line ferrihydrite in 150 mL of 0.05 mol/L NaNO3 in 250
143
mL Teflon bottles. The Fe-oxyhydroxides were allowed to equilibrate for 24 hours at the 144
target experimental pH before the addition of an aliquot of Ni from the stock solution. Nickel 145
was added slowly using a micropipette over a 15 minutes’ period, with continuous mixing 146
with a Teflon-coated stir bar to reduce changes to the pH of the suspension. A control 147
consisting of the mineral in 0.05 mol/L NaNO3 solution with no Ni added was included with
148
each set of experiments and Ni in the blank did not exceed 0.1% of the total amount of Ni 149
measured during Ni sorption experiments. Samples were named according to the adsorbent 150
(i.e., “Fh” for 2-line ferrihydrite and “Goe” for goethite) and the type of experiment (i.e., 151
“pH” for pH-dependent experiments, “C” for varying initial Ni concentration experiments and 152
“T” for time-dependent experiments). 153
Nickel sorption experiments (Table 1) were performed as a function of pH (pH 5.0, 154
6.0, 7.0, 7.7 and 8.0) with an initial Ni concentration of 170 µmol/L Ni (10 mg/L Ni). A 155
separate set of Ni sorption experiments were also performed at pH 7.7 as a function of initial 156
Ni concentration (17, 85, 170, 341, and 426 µmol/L Ni). The suspension pH was maintained 157
constant within ± 0.2 pH units with a custom-built pH control system consisting of 6 Hanna 158
Instruments HI 504 controllers, each equipped with a Thermo Scientific Orion 9110 pH 159
electrode. Adjustments of the pH were made with additions of 0.05 mol/L HCl and 0.05 160
mol/L NaOH using two 3-way General ValveTM solenoid valves and a Manostat Carter
161
peristaltic cassette pump. The pH electrodes were calibrated using pH 4 and pH 7 commercial 162
buffers before each experiment. After the addition of Ni, the suspension was allowed to react 163
for 24 hours before the solution was separated from the solids by vacuum filtration (0.22 µm 164
polycarbonate filter, Millipore). The solids were not rinsed prior to storage or analysis. After 165
filtration, the supernatant solution was refrigerated at 2°C until analysis by ICP-MS and the 166
solid material on filter was stored at -20° C. The solid-phase samples on the filter membranes 167
were cut in half and reserved for Ni K-edge EXAFS spectroscopy and isotopic analysis. 168
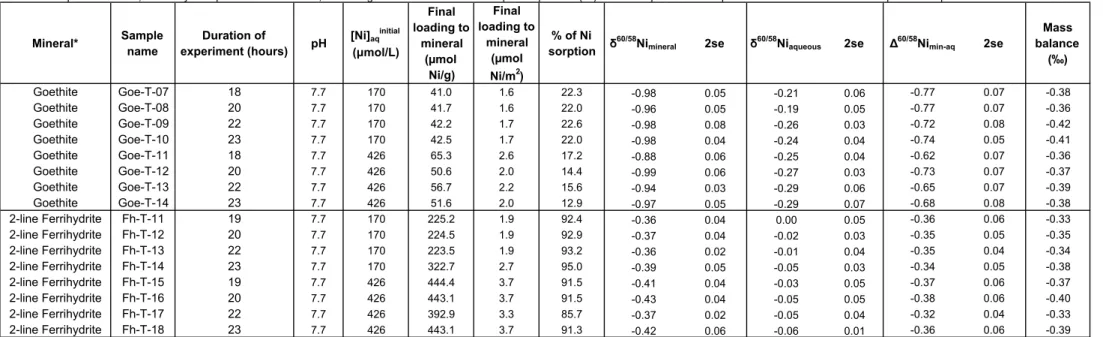
Time-dependent experiments were done to check whether kinetic isotopic effects are 169
affecting our experiments (Table 2). They were performed at a fixed pH of 7.7 and at two 170
different initial Ni concentrations of 170 µmol/L and 426 µmol/L, in order to assess the 171
potential effect of dissolved Ni concentration (i.e., Ni loading) on Ni isotope fractionation 172
factor. Four different batches were prepared for each initial Ni concentration and were 173
allowed to react for 18 (or 19 hours for 2-line ferrihydrite), 20, 22, and 23 hours, respectively. 174
A maximum equilibration time of 24 hours was chosen based on our initial test time-175
dependent experiments with goethite and ferrihydrite in which the aqueous Ni concentration 176
stabilized after 18 to 23 hours of reaction, consistent with experimental design implemented 177
by Wasylenki et al. (2015). These findings are consistent with bulk chemical equilibrium and 178
were used to choose the reaction time for the adsorption experiments. This also prevents the 179
potential effect of diffusion-controlled penetration of Ni into Fe (oxy)hydroxides on Ni 180
isotope fractionation, since this process has been shown to occur over long (week to month) 181
timescales, while surface adsorption reaches completion within a few hours (Bruemmer et al., 182
1988). As discussed below, at bulk chemical equilibrium the mineral continues to exchange 183
Ni with the aqueous phase, so isotopic changes are still possible. By contrast, no net change in 184
loading to the mineral occurs, implying that the Ni concentration in the mineral is constant. 185
186
2.2. Nickel K-edge EXAFS spectroscopy 187
188
Nickel K-edge EXAFS spectroscopy measurements were conducted at the Advanced 189
Photon Source (Argonne National Laboratory) at beamline 20-BM in fluorescence mode 190
using a 12-element Canberra germanium detector. The Ni-sorbed minerals were prepared for 191
Ni K-edge EXAFS analysis by thawing to room temperature and transferring from the filter to 192
a mylar adhesive with a microspatula. Multiple mylar layers were stacked (6-8 layers) and the 193
edges sealed to form an envelope around the sample. Measurements were conducted at room 194
temperature and individual scans were examined for systematic changes in peak-position or 195
shape to detect photon-induced sample alteration; none was observed. Multiple scans were 196
averaged to improve the signal to noise ratio. The Athena program was used for averaging 197
replicate scans and energy calibration (Ni foil with inflection point set to 8334.5 eV), and the 198
Artemis program was used to generate phase and amplitude paths for Ni K-edge EXAFS 199
fitting (Ravel and Newville, 2005). Data reduction, including background subtraction and 200
conversion to k-space, and shell-by-shell fitting were performed using the SixPack software 201
package (Webb, 2005) with the following settings: E0=8347 eV, Rbkg =1.0 Å (Kelly et al.,
202
2008), a Gaussian pre-edge function, quadratic post-edge function, no clamping, default 203
spline knots value, a Kaiser-Bessel window function, and a k-weight =3. The amplitude 204
reduction factor, S02 = 0.96, was determined by fitting the first coordination shell of aqueous
205
published standards (NiCl2 and Ni-EDTA) (Peña et al., 2010). Fits were evaluated using the
206
calculated R-factor with a value of 0.05 or less representing a reasonable fit (Kelly et al., 207
2008). 208
X-ray absorption spectra were collected from 8130 to 9300 eV. Models for the 209
adsorption geometry of Ni were based on the assumption that Ni coordinates to Fe octahedra 210
via edge-sharing or corner-sharing linkages. First, the Ni-O shell was fit with all parameters 211
varied. The optimized parameters for the first shell were constrained in subsequent fits, which 212
included second-shell Ni-Fe paths. 213
The Ni-Fe second shell was modeled assuming to the occurrence of short and long 214
bond distances, following the model used for Ni/Zn sorption on ferrihydrite (Arai, 2008; 215
Cismasu et al., 2013). Specifically, two types of bond orientations between Fe and Ni 216
octahedral were modeled. Type 1 is comprised of a Ni octahedron that shares an edge, two 217
bond via two shared oxygen molecules, with an Fe octahedra (mineral surface). Type 2 is 218
comprised of a Ni octahedron that shares a corner, or one bond via a shared oxygen, with an 219
Fe octahedra (mineral surface). Type 1 bond distances are shorter and share more bonds with 220
the mineral surface than Type 2. Distortion of the Ni-O coordination sphere can be influenced 221
by either the number of bonds with the mineral surface, or geometric strain introduced due to 222
the type of surface site (e.g., number/type of Fe octahedra) to which the Ni binds. 223
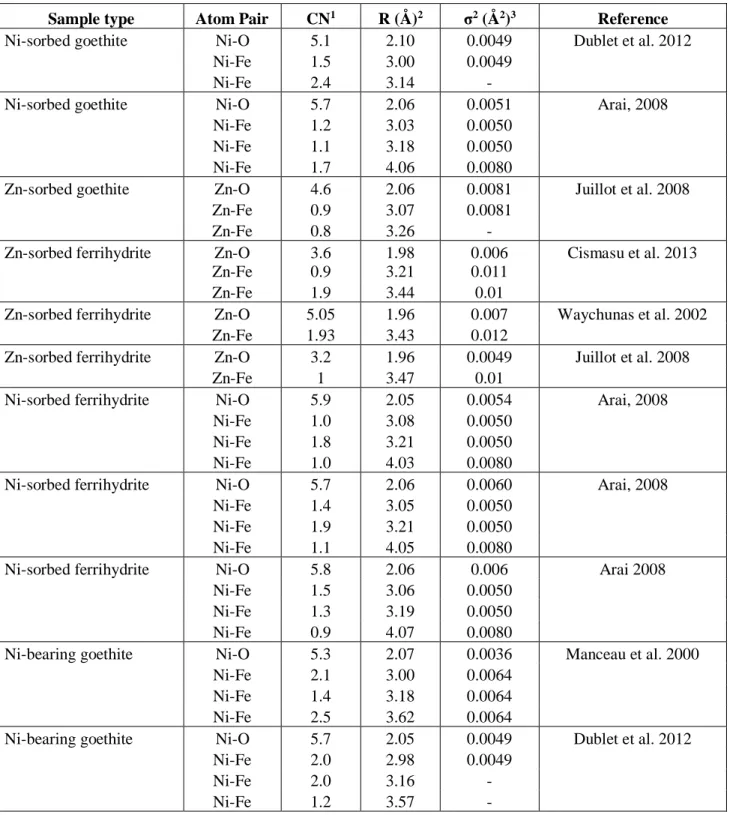
The Ni K-edge EXAFS model was based on published coordination number (CN) 224
ratios of a short and long Ni-Fe and Zn-Fe paths in the second shell of Ni K-edge EXAFS 225
data from Ni/Zn-adsorbed 2-line ferrihydrite samples (Table 3) (Manceau and Gates, 1997; 226
Carvalho-E-Silva et al., 2003; Arai, 2008; Dublet et al., 2012; Cismasu et al., 2013). Reported 227
CN ratios for Ni-sorbed 2-line ferrihydrite ranged from 0.4 :0.7 (CNshort :CNlong) with a
228
maximum total second-shell CN of 5 (Arai, 2008). Thus, CNshort :CNlong ratios of 1:1 to 4:5
229
were tested in the model. A ratio of 2:3 best described the Ni K-edge EXAFS data in both fit 230
statistics and uncertainty of varied parameters. In the final model, two type 1 Ni-Fe paths 231
were modeled for every three type 2 Ni-Fe paths. The uncertainties on the CN values are 232
between 0.144 and 0.931 (estimated to be ~25% of the CN value) and the uncertainties on the 233
interatomic distances are between 0.0078 and 0.0618 Å. 234
235
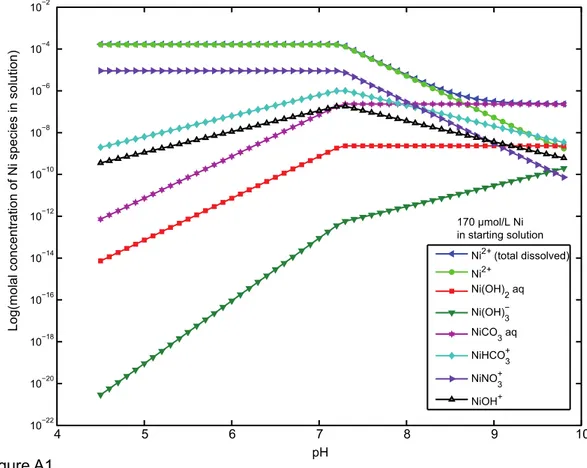
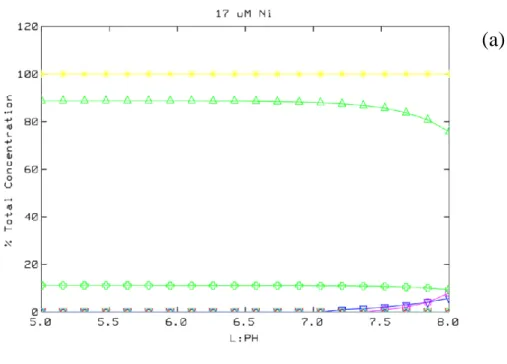
2.3. Aqueous speciation of Ni 236
237
The aqueous speciation of Ni was calculated for the initial experimental conditions 238
using the MINEQL+ v.4.6 software program (Environmental Research Softaware) with 239
default stability constants. The calculations used the initial Ni concentrations (17, 85, 170, 240
341, and 426 µmol Ni/L), pH range (5.0 to 8.0 in 20 steps), ionic strength (0.05 mol/L 241
NaNO3), and partial pressure of CO2 g (0.03943 vol%) for a system in contact with the
242
atmosphere and showed that no Ni precipitation is predicted for our experimental conditions. 243
We used Ni surface complexation values for bidentate adsorption on goethite [ 2 =SOH + Ni2+
244
=2(SOH)Ni + 2H+, log K = -2.45 ] from Xu et al. (2006), and for ferrihydrite, monodentate
245
adsorption per Dzombak and Morel (1990) (their classic two-site ferrihydrite model, strong 246
and weak sites, as already included in vMINTEQ). For aqueous speciation calculations during 247
adsorption modeling, the default vMINTEQ thermo.vdb database was used, which is an 248
expanded version of the MINTEQA2 database. Between pH 5.0 and 7.0, the dominant Ni 249
species in aqueous solution, under the initial experimental conditions considered here, is the 250
Ni2+ (hexaquo) (> 88 %). In addition to Ni2+ (hexaquo), NiNO
3+ is present and accounts for >
251
11% of the Ni in solution. For the experiments with a pH value greater than 7.0, the aqueous 252
Ni species include minor contributions from NiHCO3+ and NiCO30. Slow addition of Ni
253
during the experiments over a 15-minutes period reduced the risk of precipitation of Ni above 254
pH 7.8. For the experiments at pH 7.7, Ni occurs as: (1) 83.7% Ni2+ (hexaquo); (2) 10.7 %
255
NiNO3+; (3) 4.1 % NiHCO3+; and (4) 1.5 % NiCO30 for initial Ni concentrations ranging from
256
17 to 426 µmol/L. 257
258
2.4. Concentration determinations and column chromatographic purification of Ni 259
260
All manipulations were performed in a class 1000 clean room and exclusively used 261
acid-cleaned plasticware and teflonware. Solid samples were digested in 6 mol/L HCl at room 262
temperature for 72 hours. The total concentrations of Ni and Fe in the solids were determined 263
by quadrupole ICP-MS (X-series2, Thermo Scientific) at the Pôle Spectrométrie Océan (PSO, 264
Brest, France). Nickel concentrations in the filtrates were first estimated by mass balance 265
using the initial concentrations in solutions used at the start of each experiment and the Ni 266
concentrations in the solids determined by quadrupole ICP-MS at the end of the experiment. 267
Nickel concentrations were then recalculated by isotope dilution after isotope measurements. 268
For the separation of Ni onto chromatographic columns, an aliquot of each filtrate was 269
evaporated to dryness at 80°C prior to redissolution in 1 ml of 6 mol/L HCl. A full description 270
of the purification method can be found in Gueguen et al. (2013). Briefly, our two-step 271
separation procedure involved: (1) separation of Fe onto an anion exchange chromatographic 272
resin (BioRad AG1-X8, 100-200 mesh); (2) separation of Ni from the remaining matrix using 273
a Ni-specific resin (Ni-Spec by Eichrom). This Ni-resin contains dimethylglyoxime (DMG) 274
functional groups, which complexes Ni in ammonium citrate solutions at pH 8-9. Nickel is 275
then eluted with 3 mol/L HNO3 after breakdown of the Ni-DMG complex.
276 277
2.5. Ni isotope mass spectrometry and double-spike correction scheme 278
279
Nickel isotope compositions were measured by MC-ICP-MS (Neptune, Thermo 280
Scientific) at the PSO (Brest, France) using a double spike for mass bias correction following 281
the method described in Gueguen et al. (2013). The double spike is a mixture of 61Ni and 62Ni
282
that was added to samples at spike/natural ratio of 1 prior to the chromatographic separation 283
on Ni-specific resin. Corrected ratios were calculated using an iterative scheme following the 284
method described by Siebert et al. (2001). An ESI (Elemental Scientific Inc., USA) 285
desolvating introduction system (ApexQ) was employed for all measurements. The nine 286
Faraday cups of the instrument allowed simultaneous measurement of Ni isotopes 58Ni, 60Ni,
287
61Ni, 62Ni, 64Ni, and potential isobaric interferences from Zn (measured on 66Zn) and Fe
288
(measured on 57Fe). Argon oxide interferences (e.g., 40Ar18O+ on 58Ni+ and 40Ar17O on 57Fe)
289
were resolved using the medium resolution mode of the MC-ICP-MS. 290
Nickel isotope values were reported according to the conventional delta notation 291
(equation 1) relative to the Ni international isotopic standard NIST SRM 986 : 292
δ60/58Ni (‰) = (60/58Ni
sample/60/58NiNIST986 – 1) x 1000 (1)
293
For each sample, 50 measurement cycles were performed, resulting in an internal standard 294
error (2se) value typically between 0.02 and 0.04 ‰. The external precision was evaluated 295
through the duplicated measurements of geostandards (USGS Nod-P-1, δ60/58Ni=0.33‰; and
296
USGS Nod-A-1, δ60/58Ni=1.04‰) and was found to be ~0.06 ‰ (2sd).
297 298
3. Results
299 300
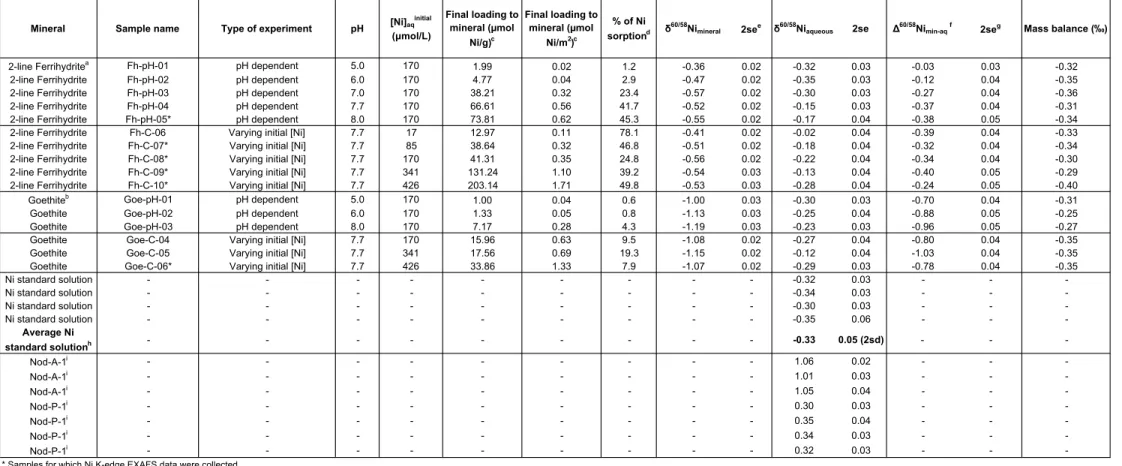
3.1. Nickel sorption by Fe oxyhydroxides 301
302
The loadings of Ni onto both 2-line ferrihydrite and goethite expressed in terms of the 303
percent of Ni sorbed for pH-dependent and varying initial [Ni] experiments are displayed in 304
Table 1. The sorption of Ni onto 2-line ferrihydrite for pH ranging from 5.0 to 8.0 (i.e., pH-305
dependent experiments, with initial Ni concentration of 170 µmol/L) resulted in Ni uptake 306
between < 1% and 45% translating into 0.02 to 0.62 µmol Ni/m2 mineral (Figure 1a). At pH
307
7.7 (varying initial Ni concentrations experiments, 17 to 426 µmol/L Ni), final Ni loadings on 308
2-line ferrihydrite ranged from 0.11 to 1.71 µmol Ni/m2 mineral (Figure 1), which correspond
309
to a percentage of sorbed Ni between 25% and 78%. 310
Nickel sorption to goethite at pH 5.0, 6.0, and 8.0 resulted in Ni uptake between < 1% 311
and 4.3% of the initial 170 µmol/L aqueous Ni (Figure 1), corresponding to Ni loadings 312
ranging from 0.04 and 0.28 µmol Ni/m2. At pH 7.7, Ni uptake from solutions with initial
313
concentrations of 17, 170, and 426 µmol/L Ni yielded final Ni loadings onto the mineral 314
between 0.63 to 1.33 µmol Ni/m2, corresponding to percentage of sorbed Ni between 8% and
315
19%. 316
Zeta potential measurements at pH 7 indicated that 2-line ferrihydrite exhibits a net 317
negative surface charge with a value of -3.44 mV (Electronic Annex, Table A1). Zeta 318
potential measurements at pH 7 indicated that goethite exhibits a net positive surface charge 319
with a value of +3.46 mV. 2-line ferrihydrite has more Ni-sorbed at pH 7 than goethite, which 320
is consistent with the more negative surface charge of 2-line ferrihydrite relative to goethite. 321
322
3.2. Surface complexation modeling 323
324
Constant capacitance surface complexation modeling (CCM) for Ni adsorption to 2-325
line ferrihydrite and goethite (Figure 2) was implemented using adsorption parameters 326
provided by Dzombak and Morel (1990), Xu et al. (2006) and Davis and Kent (1990), in order 327
to verify that sorption processes control Ni behavior in our experiments. Our experimental 328
data for 2-line ferrihydrite were in good agreement with the surface complexation model 329
calculated with parameters from Dzombak and Morel (1990) (Figure 2). The best fit of our 330
data for Ni adsorption to goethite was obtained with a constant capacitance model (Figure 2) 331
generated using adsorption constants from Xu et al. (2006) for bidentate adsorption in the Ni-332
goethite system, our BET-measured surface area of 25.5 m2/g, solid concentrations close to 1
333
g/L, and a goethite site density of 1 site per nm2. Adopting higher literature values for the
334
latter (e.g., 2.3 sites per nm2 (Davis and Kent, 1990) or 6 sites per nm2 (Xu et al., 2006))
335
results in model adsorption values significantly higher than what was observed. Finally, it is 336
important to point out that the CCM is a simple surface complexation model that integrates a 337
smaller number of parameters in comparison to the diffuse-layer model and the triple-layer 338
models (Hayes et al., 1991) and thus may not approximate natural conditions as closely. 339
340
3.3. Nickel K-edge EXAFS Spectroscopy 341
342
Nickel K-edge EXAFS spectra were collected for six Ni-sorbed 2-line ferrihydrite 343
samples (Fh-pH-05, Fh-C-07, Fh-C-08, Fh-C-09, and Fh-C-10) and one Ni-sorbed goethite 344
sample (Goe-C-06) as indicated in Table 1. The Ni K-edge EXAFS spectra collected for the 345
2-line ferrihydrite samples at pH 7.7 and 8.0 are similar in phase and amplitude despite 346
different Ni-loadings and pH values (displayed in k-space with best fits; Figure 3). All Ni K-347
edge EXAFS spectra were fit with ~ 6 Ni-O atom pairs in the first-shell at a distance of 2.05 ± 348
0.01 Å (Table 3). For the Ni-Fe second-shell atom pairs, two sub-shells were required to 349
describe the data: ~ 1.5 Ni-Fe (type 1) at 3.10 ± 0.02 Å and ~ 0.6 Ni-Fe (type 2) at 3.56-3.60 350
± 0.06 Å. Errors in the second shell coordination numbers were estimated using the fractional 351
parameter error as an indicator. As these error values were low we estimated CN error to be 352
~25% of the value. 353
The magnitude and imaginary portion of the Fourier transformed Ni K-edge EXAFS 354
spectra and fits are displayed in Figure 4. The only notable difference in the Ni K-edge 355
EXAFS derived fit parameters obtained for 2-line ferrihydrite and goethite was a lower Ni-Fe 356
coordination number in the type 1 second shell for Ni-sorbed goethite. Nickel sorbed to 357
goethite had on average 1.0 ± 0.4 Fe in its second shell, while Ni-sorbed to 2-line ferrihydrite 358
had an average of 2.2 ± 0.56 Fe atoms in its second shell (Table 3). This difference can be 359
viewed by comparing peak amplitudes of the two minerals whereby 2-line ferrihydrite 360
samples have greater peak amplitudes than goethite. The Ni K-edge EXAFS data are also 361
consistent with the formation of inner-sphere complexes with no evidence for a separate Ni 362
phase. 363
364
3.4. The Ni isotope composition of sorbed Ni and supernatant solutions 365
366
The Ni isotope composition of the initial Ni stock solution was determined at δ60/58Ni
367
= -0.33 ± 0.05 ‰ (2sd, n=4, Table 1). The Ni isotope compositions of mineral-associated Ni 368
(i.e, sorbed onto 2-line ferrihydrite and goethite) and solution are reported in Table 1. 369
The difference in Ni isotopic composition between the mineral sorbed-Ni and Ni 370
remaining in solution, which we define as the fractionation factor, is expressed as Δ60/58Ni
min-371
aq (equation 2) according to:
372 373
Δ60/58Ni
min-aq = δ60/58Nimineral - δ60/58Niaqueous (2)
374 375
Figure 5 presents δ60/58Ni values of the mineral and the associated filtrate versus
376
corresponding percent Ni sorbed in pH-dependent, variable initial Ni concentration and time-377
dependent experiments. The results show a systematic enrichment in light Ni isotope 378
compared to the starting solution during Ni sorption to the mineral surface, which is 379
accompanied by enrichment of the residual aqueous Ni in heavy isotopes. Isotopic mass 380
balance (equation 3), was verified for each sample and was consistent within uncertainty with 381
the Ni isotope composition of the original stock solution (Table 1). 382
383
δ60/58Ni
bulk = (%Nisorbed/100 x δ60/58Nimineral) + ((1 - %Nisorbed/100) x δ60/58Niaqueous) (3)
384 385
The magnitude of the Ni isotope fractionation factor ∆60/58Ni
min-aq (equation 2) between the
386
solid phase and aqueous phase is larger for goethite (-0.77 ±0.23 ‰) than for 2-line 387
ferrihydrite (-0.32 ±0.20 ‰), with no significant correlation with the percentage of adsorption 388
(Figures 5 and 7). We observe consistent and similar ∆60/58Ni
min-aq values for pH-dependent
389
and variable Ni concentration experiments for 2-line ferrihydrite on the one hand, and for 390
goethite on the other hand. 391
The pH-dependent adsorption experiments on 2-line ferrihydrite yielded surface 392
loadings from 0.02 to 0.62 µmol Ni/m2 mineral with ∆60/58Ni
min-aq values ranging from -0.37
393
to -0.03 ‰ (Figure 6). At low loadings of Ni onto 2-line ferrihydrite, i.e., 0.02 – 0.04 µmol 394
Ni/m2 mineral which correspond to 1 and 3% percent of to the total added Ni sorbed in the pH
395
5.0 and 6.0 experiments, Ni isotopes were not fractionated (∆60/58Ni
min-aq = -0.03‰) or weakly
396
fractionated (∆60/58Ni
min-aq = -0.12 ‰) respectively. Although Figure 6 seems to indicate that
397
decreasing ∆60/58Ni
min-aq values are correlated with increasing pH for 2-line ferrihydrite, we
think these data are an artifact since low pH values (5.0 and 6.0) also correspond to very low 399
Ni loadings (see discussion). For this reason, we decided to not include these data when 400
discussing average Ni isotope fractionation factors. In contrast, at pH 7.7, the percent Ni 401
sorbed was generally higher and Ni loadings of 0.32 – 1.71 µmol Ni/m2 mineral were
402
achieved, which represent between 23 and 78% Ni-sorbed on 2-line ferrihydrite. This gave a 403
range of ∆60/58Ni
min-aq values between -0.40 and -0.24 ‰ (Figures 6 and 7).
404
Nickel sorption by goethite for the pH-dependent experiment was minimal, ranging 405
from 0.6 to 4% of the initial Ni (corresponding to loadings of 0.04 – 0.28 µmol Ni/m2
406
mineral), and Ni isotope fractionation was characterized by Δ60/58Ni
min-aq values between -0.96
407
and -0.70 ‰ (Figure 6). At pH 7.7 and for different initial Ni concentrations, final loadings of 408
Ni of 0.63 to 1.33 µmol Ni/m2 mineral yielded Δ60/58Ni
min-aq values between -1.03 and -0.78
409
‰ (Figure 6). Goethite with the lowest loading of Ni (also corresponding to the lowest pH) 410
displayed the smallest Ni isotope fractionation factor relative to other samples, with 411
∆60/58Ni
min-aq = -0.70 ‰ and -0.88 ‰ for pH 5.0 and 6.0, respectively. The largest ∆60/58Ni
min-412
aq value of -1.03 ‰ was measured at pH 7.7 for goethite with the highest Ni loading.
413
Time-dependent experiments were performed in order to identify potential kinetic 414
effects (i.e., non-equilibrium Ni fractionation) in our experiments. Experiments were 415
conducted for four different durations, i.e., 18 or 19, 20, 22, and 23 hours and for two 416
different initial Ni concentrations of 170 µmol/L and 426 µmol/L (Table 2). The Ni isotope 417
fractionation factor ∆60/58Ni
min-aq is between -0.77 and -0.72 ‰ (average ∆60/58Nimin-aq = -0.75
418
± 0.05 ‰; 2sd, n=4) and ∆60/58Ni
min-aq values are between -0.73 to -0.62 ‰ (average
419
∆60/58Nimin-aq = -0.67 ± 0.09 ‰; 2sd, n=4) for the two experiments respectively.
420 421
4. Discussion
422 423
Previous work on non-traditional isotope systems, such as Mo (Barling and Anbar, 424
2004; Goldberg et al., 2009; Kashiwabara et al., 2009; Wasylenki et al., 2011), Zn (Pokrovsky 425
et al., 2005; Juillot et al., 2008), Cu (Balistrieri et al., 2008; Pokrovsky et al., 2008), Tl 426
(Rehkämper et al., 2002), Cd (Wasylenki et al., 2014), Hg (Jiskra et al., 2012), Fe (Icopini et 427
al., 2004; Mikutta et al., 2009; Beard et al., 2010; Wu et al., 2011; Wu et al., 2012; Frierdich 428
et al., 2014), Ge (Li and Liu, 2010; Pokrovsky et al., 2014), and Se (Mitchell et al., 2013) 429
have shown that adsorption reactions are often accompanied by significant isotope 430
fractionation processes that may vary according to sorbent composition and sorbate structure. 431
By contrast, sorption of Cr(VI) to Fe-oxyhydroxides is not accompanied by significant isotope 432
fractionation (Ellis et al., 2004). Hence, the combination of spectroscopic and isotopic 433
measurements is essential for understanding isotopic fractionation processes. Here, we discuss 434
the result of both approaches to address the mechanisms and significance of Ni isotope 435
fractionation during Ni sorption to Fe-oxyhydroxides. 436
437
4.1. Surface coordination of Ni at the mineral surface 438
439
Coordination chemistry (i.e., coordination number, bond length) correlates with the 440
extent of isotope fractionation because shorter bond lengths (i.e., stiffer bonds) or lower 441
coordination numbers favor enrichment of heavier isotopes (e.g., Schauble, 2004; Pokrovsky 442
et al., 2005). The first coordination shell of a metal is comprised of oxygen atoms. Variations 443
of the coordination number of the metal (e.g., between the aqueous phase and the solid phase) 444
during adsorption of a transition metal to the surface of any given Fe-oxyhydroxide mineral is 445
a common cause for isotope fractionation. For instance, heavy isotope enrichment during Zn 446
sorption on ferrihydrite was accounted for by a decrease in the coordination number of the 447
aqueous species relative to the adsorbed species. According to EXAFS data, the adsorption of 448
Zn onto ferrihydrite produces a significant shift in Zn coordination number, from 6 in the 449
solution to 4 in the solid, while Zn sorbed on goethite occurs in octahedral coordination, i.e., 450
similar to aqueous Zn. The larger isotope fractionation factor measured for ferrihydrite 451
relative to goethite can thus be explained by a different coordination environment of the 452
sorbed Zn (i.e., 4 for ferrihydrite and 6 for goethite) and differences in Zn-O bond stiffness 453
(i.e., 1.96 Å for ferrihydrite and 2.11 Å for goethite; Juillot et al., 2008). For Ni, isotopic 454
fractionation cannot be related to changes in the coordination number between aqueous Ni 455
and sorbed Ni because Ni exclusively occurs in coordination 6 in the natural environment. 456
The length of Ni – O bonds in water is 2.1 Å compared to the 2.05 Å observed when Ni is 457
sorbed to the mineral surface (Soper et al., 1977), therefore, heavier Ni isotopes enrichment 458
should be expected during sorption to the mineral surface. The systematic enrichment in 459
lighter Ni isotopes on the mineral phase found in this study and in Wasylenki et al. (2015) 460
precludes this option. 461
Wasylenki et al. (2015) suggest that distortion of the coordination environment after 462
Ni sorption to ferrihydrite could explain light Ni isotopes enrichment of the mineral surface. 463
Given our Ni K-edge EXAFS data quality it was not possible to support or refute this 464
hypothesis because we could not achieve fitting multiple Ni-O paths to the Ni-O shell (first 465
coordination shell). However, the number of bonds between Ni and surface oxygens, which is 466
reflected in the second shell parameters (i.e., surface complex geometry), may cause slight 467
distortion or distribution of the electron density in the first coordination shell, even if they 468
cannot be captured by the Ni K-edge EXAFS data. Thus, we argue that the number of bonds 469
between Ni and surface oxygens could distort the first coordination shell. 470
Consistent with previous studies (Manceau et al., 2000; Carvalho-E-Silva et al., 2003; 471
Arai, 2008; Dublet et al., 2012) adsorbed Ni displayed octahedral coordination (Electronic 472
Annex, Table A2). For an inner-sphere surface complex of Ni on Fe oxyhydroxides, the 473
second major coordination shell is composed of Fe atoms. The interatomic distances between 474
Ni and Fe, as measured by Ni K-edge EXAFS spectroscopy, define the local coordination 475
environment of the Ni surface species and Ni sorbed on ferrihydrite and goethite have been 476
studied in detail (Waychunas et al., 2002; Arai, 2008; Juillot et al., 2008; Dublet et al., 2012; 477
Cismasu et al., 2013). It was demonstrated that Ni sorbed on ferrihydrite occurs in octahedral 478
coordination between Ni-O6 and Fe-O6 polyhedra with interatomic distances in the range of
479
3.05-3.08 Å for edge-sharing type 1 surface complexes, 3.19-3.12 Å for edge-sharing type 2, 480
and 4.03-4.07 Å for corner-sharing (Arai, 2008). Type 1 edge sharing is between Ni and Fe 481
octahedra in the chains and type 2 surface complexes is between Ni and Fe octahedra in the 482
rows (Arai, 2008). The interatomic distances modeled here for goethite samples reflect the 483
three Fe-Fe second-shell interatomic distances for edge-sharing coordination between Ni and 484
a chain of Fe-O6 octahedra (i.e., type 1), edge-sharing between chains of Fe-O6 octahedra (i.e.,
485
type 2), and corner-sharing Fe-O6 octahedra between double chains (Manceau and Drits,
486
1993). 487
Incorporation of Ni into Fe-oxyhydroxides lattices is possible, but our Ni K-edge 488
EXAFS data shows the absence of Ni incorporation in the minerals. Cornell et al. (1992) 489
reported Ni incorporation into synthetic goethite at ~5% of the total molar fraction and several 490
studies showed that incorporation of Ni in goethite occurs via diffusion into the mineral lattice 491
where Ni can occupy vacant Fe positions in synthetic goethite (Barrow et al., 2012; Brümmer 492
et al., 2013). Fischer et al. (2007) showed that Ni reaction with the goethite surface is 493
continuous with time and that Ni is incorporated via diffusion in the lattice structure of the 494
mineral. Wasylenki et al. (2015) reported nearly identical isotopic signatures for surface 495
sorbed Ni and incorporated Ni, suggesting that the influence of incorporated Ni is negligible 496
in the isotopic budget and that potential Ni isotope fractionation during diffusion can be 497
precluded. 498
The best Ni K-edge EXAFS model for Ni sorbed to 2-line ferrihydrite data, with two 499
Ni-Fe distances in the second shell, is consistent with a short Ni-Fe distance produced by 500
edge-sharing polyhedra (3.10 ± 0.02 Å) in addition to a longer Ni-Fe distance produced by a 501
combination of edge-sharing and corner-sharing polyhedra not resolved by our Ni K-edge 502
EXAFS data (3.57 ± 0.06 Å). The data quality for the Ni-sorbed goethite prevented a robust 503
second-shell fit to the Ni K-edge EXAFS. However, the fit results were consistent with a Ni-504
Fe atom pair at 3.07 ± 0.03 Å and revealed a difference relative between goethite and 2-line 505
ferrihydrite in the Ni-Fe coordination number. The Ni K-edge EXAFS measurements on 506
goethite and 2-line ferrihydrite from this study also indicate that the Ni coordination 507
environment was similar among all samples. Therefore, the difference in Ni isotope 508
fractionation between the two minerals may be due to minor differences in surface site density 509
and distribution. Since no detectable difference in surface speciation was observed as a 510
function of Ni loading to the 2-line ferrihydrite surface at pH 7.7 or as a function of pH (7.7 511
versus 8.0), alternative variable parameters such as protonation state of the mineral, surface 512
complex geometry (e.g., number of bonds between Ni and mineral surface), surface coverage 513
or bond lengths between the two minerals might have influenced Ni isotope fractionation. 514
515
4.2. Nickel isotope fractionation factors during Ni adsorption to Fe-oxyhydroxides 516
517
In the case of equilibrium isotopic fractionation, the fractionation factor between 518
mineral and solution, the αmin-aq value (related to Δ60/58Nimin-aq values as ≈ 103.ln αmin-aq),
519
ultimately depends on the difference in bond stiffness between two species involved in the 520
reaction. In a closed system, the Ni isotope composition of the solution and mineral-bound Ni 521
are related to the proportion of Ni sorption to the mineral (Figure 5). If equilibrium isotope 522
fractionation is maintained during the experiment, the fractionation factor, Δ60/58Ni min-aq,
should remain constant regardless of the percentage of Ni adsorption and duration of the 524
experiments. We recognize that equilibrium isotope fractionation is best demonstrated using 525
the 3-isotopes method (Wu et al., 2011), which allows the determination of the rate of isotopic 526
exchange and extrapolate the isotope fractionation factors during incomplete isotope 527
exchange. Here, we mainly relied on the constant Ni isotope fractionation factor between 528
solution and mineral during the reaction progress in order to derive equilibrium Δ60/58Ni min-aq
529
values. Results obtained for 2-line ferrihydrite and goethite (i.e., pH dependent, concentration 530
dependent, and time dependent) are for the most part consistent with isotopic equilibrium in a 531
closed system (i.e., constant Δ60/58Ni
min-aq values), although significant departure from this
532
relationship is observed at low percentage of Ni sorption (Figure 7) and in one goethite 533
sample (i.e., the variable initial Ni concentrations experiments with 19.3% Ni-sorbed (Figure 534
5)). 535
In order to derive meaningful Ni isotope fractionation factors from the experimental 536
data, the % of Ni adsorption should be generally comprised between 5% to 95%, i.e., too low 537
or too high values may pose problem in the determination of 60/58Ni of the mineral and
538
solution, respectively. Using this more restricted dataset, we determine an average ∆60/58Ni
min-539
aq = -0.32 ±0.20 ‰ for the 2-line ferrihydrite and ∆60/58Nimin-aq = -0.77 ±0.23 ‰ for goethite.
540
For time-dependent experiments, we determine a range of ∆60/58Nimin-aq values for the
541
2-line ferrihydrite between -0.32 ±0.04 and -0.38 ±0.06‰, and for goethite between -0.65 542
±0.07 and -0.77 ±0.07‰. Therefore, ∆60/58Ni
min-aq values do not vary within uncertainties over
543
the course of the experiments. This is in agreement with previous results of Wasylenki et al. 544
(2015) showing no variations in ∆60/58Ni
min-aq values for 2-line ferrihydrite for experiment
545
duration between a few hours to 30 days. There is also no appreciable difference in the 546
magnitude of Ni isotope fractionation factor depending on the initial Ni concentration and 547
sorption %, i.e., ∆60/58Nimin-aq = -0.35 ±0.01 ‰ (2sd, n=4) for an initial Ni concentration of
170 µmol/L and ∆60/58Ni
min-aq = -0.36 ±0.05 ‰ (2sd, n=4) for an initial Ni concentration of
549
426 µmol/L (Table 2). Average ∆60/58Ni
min-aq values for 2-line ferrihydrite and goethite
time-550
dependent experiments are also similar to the average value calculated for the pH-dependent 551
and varying initial Ni concentrations experiments suggesting that our experiments are at 552
isotopic equilibrium.The duration of experiments is the same for low Ni-sorbed samples than 553
for high Ni-sorbed samples. Therefore, if there were any kinetic effects we would expect them 554
to be similar whatever the amount of sorbed Ni or that larger isotope fractionation would 555
occur for low Ni-sorbed samples compared to high Ni-sorbed samples which is not the case in 556
our experiments. Although these experiments did not allow the determination of isotopic 557
exchange rates between the solution and the mineral, which would have required shorter 558
experiment duration, we suggest that isotopic equilibrium was likely achieved in our 559
experiments. This assumption is also consistent with previous goethite adsorption experiments 560
for Cu and Zn isotopes systematics (Pokrovsky et al., 2005; Pokrovsky et al., 2008) for which 561
isotope fractionation factors were similar for short duration experiments (~20 hours) than for 562
long duration experiments (~ 100 days). 563
The smaller Ni isotope fractionation factors for goethite and 2-line ferrihydrite at low 564
% (Figure 7) can be explained in several ways: (1) non-equilibrium fractionation (i.e., kinetic 565
fractionation processes) due to partially irreversible reaction between sorbed Ni on the 566
mineral and Ni in solution; (2) a change in coordination chemistry in the mineral with pH 567
and/or Ni loading; and (3) retention of aqueous Ni on the mineral during filtration, leading to 568
incomplete separation of Ni in mineral and Ni in solution. As explained above, time-569
dependent experiments suggest that isotopic equilibrium is achieved which, thus, discounts 570
hypothesis (1). Hypothesis (2) can also be ruled out since no change in coordination 571
chemistry as a function of pH was observed in the Ni K-edge EXAFS measurements. We 572
propose that the low ∆60/58Ni
min-aq values measured in samples prepared at low pH may be due
to the presence of a small fraction of the supernatant solution that remained trapped in the 574
mineral even after filtering, which would mute Ni isotope fractionation during adsorption. 575
Using the final Ni concentration measured in supernatant solutions and the estimated volume 576
of water present in the mineral, we calculated that the supernatant solution should contribute 577
between 0.0002 and 0.0070 µmol Ni/m2 for 2-line ferrihydrite. Hence, for low Ni-loading in
578
the 2-line ferrihydrite experiments, Ni in solution may account for between 13 % and 44 % of 579
the total Ni in the sorbed fraction. This mixing effect is the most plausible explanation 580
(hypothesis 3) for the variation in Δ60/58Ni
min-aq values (i.e., decrease) at low Ni-loading.
581 582
4.3. Differences in Ni isotope fractionation between goethite and 2-line ferrihydrite 583
584
Our experiments showed that Ni sorbed to goethite is twice more fractionated towards 585
lighter Δ60/58Ni
min-aq values (~ -0.77 ‰) than Ni sorbed to 2-line ferrihydrite (~ -0.35 ‰).
586
Nickel species in solution that are likely to be adsorbed onto minerals are the Ni2+
587
(hexaquo) species (Peacock and Sherman, 2007a). The surface complexation model reported 588
in Figure 2 predicts that under the experimental conditions used in our study Ni should sorb to 589
goethite to a greater extent than we observed in our experiments. At pH values less than ~ 8.0, 590
the expected point of zero net charge for goethite is such that it should be positively charged. 591
In contrast, the zeta potential measurements for 2-line ferrihydrite indicate a net negatively 592
charged surface. The net negative surface charge of 2-line ferrihydrite tends to attract 593
dissolved cations to its surface while the net positive surface charge of goethite tends to repel 594
dissolved cations and ferrihydrite has a higher surface area than goethite. This is in agreement 595
with the strong uptake of Ni from solution by 2-line ferrihydrite observed in our experiments 596
and predicted by our surface complexation model (Figure 2). 597
Two different modes of isotope fractionation are then possible during Ni adsorption to 598
Fe-oxyhydroxides. One involves isotopic exchange among aqueous species in solution 599
followed by preferential adsorption of one of these species onto the mineral phase. This 600
mechanism may lead to contrasting isotope composition between the fluid and mineral, as 601
previously observed for the Mo isotope system (Siebert et al., 2003; Barling and Anbar, 602
2004). An alternative mechanism of fractionation may take place directly during metal 603
adsorption and involves the preferential adsorption of one isotope from the aqueous phase 604
onto the solid phase because of, for instance, differences in coordination chemistry or kinetic 605
effects. These two mechanisms are not mutually exclusive and combination of the two is 606
likely to occur in natural systems. Pokrovsky et al. (2014) identified five mechanisms that 607
could be responsible for equilibrium isotope fractionation during sorption reactions: (1) 608
protonation of metal species in solution or on the mineral surface; (2) mineral surface 609
coverage and distribution of weak sites versus strong sites; (3) bond distances between the 610
metal and oxygen atoms and the presence of other atoms in the mineral structure; (4) change 611
in coordination between the fluid and the solid phase; and (5) binding mode of the metal. 612
Below we evaluate each of these mechanisms in light of the results from our study. 613
Mechanism (1) : Protonation of aqueous or sorbed Ni. As a divalent cation, Ni has a 614
relatively low ionic potential, e.g., in contrast to Fe3+ and Al3+. Hence, Ni(H
2O)62+ does not
615
readily undergo hydrolysis and Ni tends to form relatively weak aqueous complexes with 616
ligands when compared to trivalent cations. In addition, because we expect the presence of a 617
single aqueous Ni species, Ni(H2O)62+, in our experiments there should be no isotopic
618
fractionation occurring in solution. 619
Mechanism (2) : Mineral surface coverage and distribution of weak and strong sites. 620
Villalobos et al. (2003)demonstrated that goethite synthesized with variable NaOH addition 621
rates yield variable site densities that are in turn reflected in adsorption behavior. The goethite 622
minerals synthesized in our study appear to fall on the low end of surface site concentrations 623
reported in literature for goethite. Our Ni K-edge EXAFS data and fits revealed no detectable 624
differences between low and high Ni loadings onto 2-line ferrihydrite. Therefore, we have no 625
evidence to support a fractionation mechanism based on discrimination between weak and 626
strong sorption sites. The Ni loading data when normalized to mineral surface area show no 627
distinct differences between 2-line ferrihydrite and goethite in terms of range or magnitude of 628
Ni surface coverage (Figure 1 and Table 1). This suggests that mineral surface loading does 629
not explain the Ni isotope fractionation observed in our experiments. 630
Mechanism (3) : Bond distances between the metal and oxygen atoms and the 631
presence of other atoms in the mineral structure. The minerals studied here were synthesized 632
in the laboratory and are free of impurities. In addition, as discussed above, the Ni-O first-633
shell interatomic distances are indistinguishable among our 2-line ferrihydrite and goethite 634
sorbents. 635
Mechanism (4): Change in coordination between the fluid and the solid phase. Based 636
on thermodynamic modeling, we expect the aqueous Ni speciation is > 80% Ni2+ (hexaquo),
637
Ni(H2O)62+, and in octahedral coordination with O. Based on our Ni K-edge EXAFS data, the
638
Ni sorbed to 2-line ferrihydrite and goethite is also in octahedral coordination with O. 639
Mechanism (5): Metal bonding environment. The Ni K-edge EXAFS data and fit 640
results indicate that the local coordination environment for Ni at the mineral surface is similar 641
for all Ni loadings and pH values for 2-line ferrihydrite. To determine whether we can extend 642
this finding to goethite, we compared two samples for which Ni K-edge EXAFS data were 643
collected : (1) Goe-C-06 (1.33 µmol Ni/m2) and Fh-C-10 (1.71 µmol Ni/m2). These two
644
samples have similar Ni loadings when the amount of adsorbed Ni is normalized by specific 645
surface area (Table 1) and the Ni K-edge EXAFS-derived fit parameters for the Ni-O shell are 646
identical within errors. In other words, the Ni species have the same coordination number and 647
the same bond lengths for Ni-O (recall some of the coordinating oxygens are contributed by 648
the mineral and waters of hydration). The only difference in Ni speciation between the two 649
samples is a lower Ni-Fe coordination number in the second shell for Ni-sorbed goethite. On 650
average, the Ni sorbed to goethite has only 1.0 Fe (range 0.6-1.5) in its second shell, while Ni-651
sorbed to 2-line ferrihydrite has 2.2 Fe (range 1.8-2.7) (Table 3). This difference in surface 652
complex geometry, which may originate from the structure of goethite as discussed below, 653
suggest that the number of bonds formed between Ni and surface oxygen atoms, as indicated 654
by the number of Ni-Fe near neighbors, may influence the distribution of electron density in 655
the first coordination shell of Ni and thus influence its isotopic fractionation. 656
Of these possible mechanisms, only mechanism (5) ‘binding mode of the metal’ 657
provides a good explanation for our data. Specifically, we observe a subtle difference between 658
the Ni-Fe second-shell coordination environment when comparing two Ni-sorbed mineral 659
samples having similar Ni loading when expressed in terms of surface area rather than total 660
mass. Nickel sorbed to goethite has fewer Fe atoms in the second-shell than Ni sorbed to 2-661
line ferrihydrite. The goethite structure is known to generate three different surface functional 662
groups based on the number of Fe atoms bonded to a surface oxygen (Essington, 2003) : type 663
(1) ≡Fe3-O1/2-, type (2) ≡Fe2-O1-, and type (3) ≡Fe-O3/2-. In our experiments, sorption of
664
Ni(H2O)62+ by site type (3) is most consistent with the results. In addition, fewer Fe atoms in
665
the second coordination shell is consistent with weaker surface complexes and the observed 666
enrichment of light Ni isotopes in the Ni-sorbed to goethite sample leading to larger isotopic 667
fractionation (i.e., larger fractionation factor ∆60/58Ni
min-aq) than for 2-line ferrihydrite.
668 669
4.4. Implications for Ni isotope biogeochemical cycling in modern and ancient surface 670
environments 671
4.4.1. Nickel isotope systematics during continental weathering 673
674
In modern Earth surface environments, Fe-oxyhydroxides are likely an important 675
carrier of Ni in riverine suspended sediments (Turekian, 1977; Snodgrass, 1980; Callender, 676
2014) and in soils (Dublet et al., 2012; Ratié et al., 2015). Snodgrass (1980) showed that Ni 677
occurs in solution (0.5% only), as adsorbed species (3.1%), as precipitated inorganic phases or 678
particle coatings (47%), as organic matter-bound complexes (14.9%) and as crystalline 679
material (34.4%). Martin and Meybeck (1979) showed that Ni occurs mainly in the truly 680
dissolved phase. However, a proportion of the total dissolved pool consists of Ni sorbed to Fe 681
and Mn-oxides colloids and particles (Mouvet and Bourg, 1983; Gaillardet et al., 2014) while 682
a significant proportion of Ni is associated with colloidal organic matter and organic 683
compounds (Vasyukova et al., 2010). Considering that the proportion of each of these Ni 684
pools in rivers may vary depending on environmental and geological settings, Ni speciation 685
may exert a strong influence on the Ni isotope composition of rivers. Bedrock lithology, rock 686
alteration processes and soil formation may be also important. For example, the Ni isotope 687
composition of Ni-rich laterites forming through weathering of ultramafic complexes 688
indicates an enrichment in light Ni isotopes by -0.47 ‰ compared to the bedrock composition 689
(Ratié et al., 2015). Nickel isotope fractionation during adsorption to Fe-oxyhydroxides might 690
explain the observed light isotopes enrichment in weathering environment, and by isotopic 691
mass balance, the overall enrichment in heavy isotopes in rivers (Cameron and Vance, 2014). 692
This would indicate a significant role for Fe in Ni isotopic cycling on continental surfaces and 693
more specifically in the delivery of Ni to the oceans both in terms of elemental flux and 694
isotopic composition. 695
In natural environments, the reaction rate for the transformation of ferrihydrite to 696
goethite can be relatively rapid (< 500 days) and does not depend on pH (Schwertmann et al., 697
2004), but ferrihydrite can be metastable in some environments (Navrotsky et al., 2008; Toner 698
et al., 2012). The presence of large amounts of Ni incorporated in Fe-oxyhydroxides has been 699
shown to slow the transformation of poorly crystalline Fe-oxyhydroxides to more crystalline 700
phases (Cornell et al., 1992; Cornell and Schwertmann, 2003). During dissolution of Fe(III)-701
oxyhydroxides, Ni is released more slowly than Fe, which leads to enrichment in Ni in the 702
residual solid phase (Cornell et al., 1992). The presence of organic ligands in seawater may 703
also affect the crystallization of ferrihydrite and its transformation to goethite (Cornell and 704
Schwertmann, 1979). Therefore, in the case of differential Ni isotope fractionation between 705
the two mineral phases as observed in this study, the overall Ni isotope composition of Fe-706
oxyhydroxides may be controlled by the nature of the initial mineral phase precipitated. 707
Based on our results, we propose that Ni adsorption on Fe-oxyhydroxides is likely to 708
be a major mechanism for explaining the enrichment in heavy Ni isotopes in river water 709
compared to the Bulk Silicate Earth by ~ 0.6-0.7 ‰ (Cameron and Vance, 2014). However, 710
one should also consider the possibility that the present-day main river discharges (e.g., 711
Amazon river) may contain some anthropogenic Ni as a by-product of fossil fuel burning, 712
which may alter both the natural concentration of Ni in rivers and its isotopic composition. 713
For instance, Gueguen et al. (2013) report a 60/58Ni value of 0.5 ‰ in coal, which is heavier
714
than the Bulk Silicate Earth isotopic composition. Such anthropogenic input could also 715
explain the apparent Ni isotopic imbalance in the ocean (Cameron and Vance, 2014), thereby 716
implying that Ni delivery to the ocean occurs under non steady-state conditions. 717
718
4.4.2. Application to Precambrian seawater chemistry and ancient Ni biogeochemical cycling 719
720
The marine biogeochemical cycle of Ni experienced major perturbations during the 721
Precambrian (Konhauser et al., 2009; Konhauser et al., 2015), including an apparent sharp 722
decrease in the Ni delivery to the ocean at the onset of the Great Oxidation Event, at ca. 2.5 723
Ga. Under the overall anoxic conditions and high Ni bioavailability of the Archean oceans, 724
microorganisms such as methanogens may have been important primary producers. Given 725
that methanogens fractionate light Ni isotopes by up to ~ -1.5 ‰ (Cameron et al., 2009), such 726
a shift in Ni utilization in the oceans should have left characteristic imprints in the Ni isotopic 727
composition of Precambrian seawater. Because Fe-oxyhydroxides were probably an important 728
host phase for Ni in ancient marine environments (Konhauser et al., 2009), an understanding 729
of Ni isotope fractionation during sorption to ferrihydrite or goethite is critical for inferring 730
the Ni isotopic composition of Precambrian seawater from the Precambrian sediment record 731
(Wasylenki et al., 2015). Tracing the evolution of Ni isotopic composition in Precambrian 732
seawater by investigating BIFs could provide meaningful insights into the coevolution of the 733
chemical composition of seawater with biological evolution and diversification (Bekker et al., 734
2010). However, Fe-oxides such as hematite and magnetite are the predominant carrier of Ni 735
in these deposits, although accessory minerals such as silicates (e.g., stilpnomelane) and 736
carbonates may be also important. Because the nature and origin of the Fe-oxyhydroxide 737
precursor in BIF remain poorly known, interpretations based on the Ni isotope composition in 738
BIF should be made with significant caution given the range of possible fractionation factors 739
for different mineral types (e.g., ferrihydrite vs. goethite) and adsorption mechanisms. 740
Our results show that Ni isotope fractionation during abiotic reactions involving 741
adsorption on Fe-oxides are of the same order of magnitude as for biotic reactions (i.e., 742
Cameron et al., 2009) and vary between different mineral surfaces i.e., from ~ -0.35 ‰ (2-line 743
ferrihydrite) to ~ -0.77 ‰ (goethite). Hence, the use of Ni isotopes as biosignatures should be 744
approached with caution, as Ni isotope fractionation produced by abiotic processes may mask 745
any isotope signals related to biotic processes. This issue is critical for BIF studies because 746
the large extent of Fe precipitation in seawater, leading to the accumulation of freshly formed 747