HAL Id: hal-01632907
https://hal.archives-ouvertes.fr/hal-01632907
Submitted on 14 Nov 2017
HAL is a multi-disciplinary open access
archive for the deposit and dissemination of
sci-entific research documents, whether they are
pub-lished or not. The documents may come from
teaching and research institutions in France or
abroad, or from public or private research centers.
L’archive ouverte pluridisciplinaire HAL, est
destinée au dépôt et à la diffusion de documents
scientifiques de niveau recherche, publiés ou non,
émanant des établissements d’enseignement et de
recherche français ou étrangers, des laboratoires
publics ou privés.
Remote Sensing Images through Hierarchical Markov
Random Fields
Ihsen Hedhli, Gabriele Moser, Sebastiano Serpico, Josiane Zerubia
To cite this version:
Ihsen Hedhli, Gabriele Moser, Sebastiano Serpico, Josiane Zerubia. Classification of Multisensor
and Multiresolution Remote Sensing Images through Hierarchical Markov Random Fields. IEEE
Geoscience and Remote Sensing Letters, IEEE - Institute of Electrical and Electronics Engineers,
2017, 14 (2), pp.2448-2452. �10.1109/LGRS.2017.2768398�. �hal-01632907�
Classification of Multisensor and Multiresolution
Remote Sensing Images through Hierarchical
Markov Random Fields
Ihsen Hedhli, Member, IEEE, Gabriele Moser, Senior Member, IEEE,
Sebastiano B. Serpico, Fellow, IEEE, and Josiane Zerubia, Fellow, IEEE
Abstract—This letter proposes two methods for the supervised classification of multisensor optical and SAR images with possibly different spatial resolutions. Both methods are formulated within a unique framework based on hierarchical Markov random fields. Distinct quad-trees associated with the individual information sources are defined to jointly address multisensor, multiresolu-tion, and possibly multifrequency fusion, and are integrated with finite mixture models and the marginal posterior mode criterion. Experimental validation is conducted with Pl´eiades, COSMO-SkyMed, RADARSAT-2, and GeoEye-1 data.
Index Terms—Multisensor, multiresolution, multifrequency fu-sion, quad-tree, hierarchical Markov random field (MRF), mar-ginal posterior mode (MPM), finite mixture models.
I. INTRODUCTION
G
IVEN the current amount and variety of data from high or very-high resolution (HR/VHR) satellite missions, a major challenge is to develop classifiers that can benefit from multiresolution, multisensor, and multifrequency input imagery [1]–[3]. The use of multiband and multiresolution data has been shown to favor accuracy and spatial precision of the classification maps [2]. Furthermore, the use of multisensor data generally allows complementary properties, such as those of SAR and optical imagery, to be exploited [1]. Hence, there is a definite need for classification methods that can fuse images taken on the same area both by different sensors and at different resolutions. One way to address multisensor data classification is to compute joint class-conditional distributions given the marginal probability density function (PDF) of the data collected by each sensor. Meta-Gaussian [4], copula [5], or non-parametric models [6] can be used for this purpose. However, finding such joint statistical models is generally complex, time-demanding, and possibly prone to over-fitting. In this paper, we build on the theory of hierarchical Markov random fields (MRFs) [7] to address the challenging problem of the supervised classification of data that are both mul-tiresolution and multisensor (and possibly multifrequency). The rationale is to benefit from the fusion capabilities of I. Hedhli and J. Zerubia are with UCA (Universit´e Cˆote d’Azur), Inria, France (e-mail: [email protected], [email protected]). I. Hedhli, G. Moser, and S. B. Serpico are with the University of Genoa, Italy (e-mail: [email protected]). The authors would like to thank the French Space Agency (CNES), the Italian Space Agency (ASI). and the Canadian Space Agency (CSA) for providing Pl´eiades, COSMO-SkyMed, and RADARSAT-2 images, respectively. Part of the data was procured within the SOAR-ASI 5245 project framed within the joint ASI-CSA announcement of opportunity. The support is gratefully acknowledged.hierarchical MRFs and avoid the computation of joint statistics of multisensor data. Inference is accomplished by extending the approach that was previously developed in [8] for multi-temporal fusion and is based on the marginal posterior mode (MPM) criterion. PDF estimation is addressed using mixtures of Gaussian and generalized Gamma distributions.
Two methods are proposed in this framework. In the case of the first one, the image acquired by each sensor is associated with a separate quad-tree according to its resolution. In regard to the second method, the focus is on the specific case of the fusion of multifrequency X-band COSMO-SkyMed (CSK) and C-band RADARSAT-2 (RS2) SAR data together with optical visible and near-infrared (VNIR) Pl´eiades data. Distinct quad-trees are used again, but here, optical and SAR data are both included in each quad-tree to benefit from the finest resolution available from each sensor. While the first technique addresses the fusion of data from generally arbitrary SAR and optical sensors, the second method focuses on the synergy among three specific and topical satellite data sources. The main novel contribution of the proposed framework is the formalization of the joint problem of multisensor, multiresolution, and possibly multifrequency fusion in terms of a multiple quad-tree topology and of hierarchical MRFs.
The letter is organized as follows. Section II-A describes the proposed framework and the quad-tree structures of the two methods. Sections II-B and II-C discuss the MPM inference and PDF estimation issues. Experimental results are presented in Section III and conclusions are drawn in Section IV.
II. PROPOSEDMULTISENSORHIERARCHICALAPPROACH A. Overview of the proposed methodology
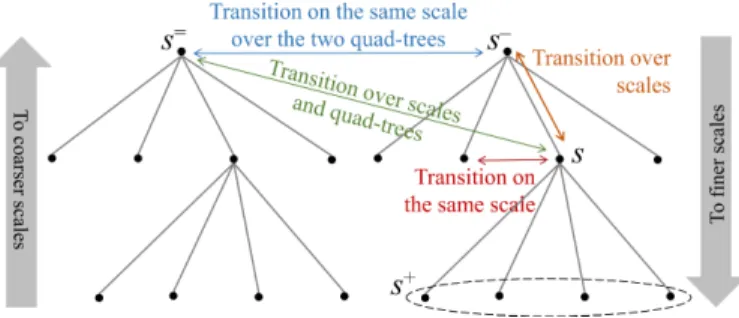
To address multisensor and possibly multifrequency fusion, the proposed framework extends and adapts the approach de-veloped in [8] for multitemporal fusion and based on multiple quad-trees in cascade and on hierarchical MRFs (Fig. 1). This hierarchical formulation also allows multiresolution data to be naturally incorporated. In particular, a pair of quad-trees in cascade is constructed using the input multisource imagery. Given a training set for M thematic classes, infe-rence can be efficiently formulated on this topology using MPM (see Section II-B), while the statistics of the data from each sensor are modeled using finite mixtures and the stochastic expectation-maximization (SEM) algorithm [9] (see Section II-C). In this framework, two methods, which differ in how data are incorporated in the quad-trees, are defined.
Fig. 1. Multisensor hierarchical structure.
1) Quad-trees of the first proposed method: Let an optical and a SAR image, acquired at the same time over the same area, be given. In the first method, these images are included in the finest-scale levels (the leaves) of two quad-trees. Coarser-scale levels of each quad-tree are filled in using wavelet transforms of the finest-scale level [10]. The roots of the quad-trees are assumed to have the same spatial resolution. Hence, there generally are different numbers of levels in the quad-trees, from the roots at a common resolution to the input resolutions of the optical and SAR data. The quad-tree topology also implies that the resolutions of the two input images are in a power-of-2 relation. With current HR satellite sensors, this condition is easily met up to minor resampling.
2) Quad-trees of the second proposed method: The second method is aimed at classifying multisensor, multifrequency (X-band radar, C-(X-band radar, VNIR optical), and multiresolution data from CSK, RS2, and Pl´eiades. These prominent sensors support multiple resolutions, up to 0.5 m for Pl´eiades and approximately 1 m for CSK and 1-2 m for RS2. Given input CSK, RS2, and Pl´eiades images acquired on the same area at the same time, case-specific quad-trees are constructed to classify at the finest of the input resolutions. Each SAR image is inserted in a separate quad-tree according to its own resolution. These resolutions are expected to be coarser than the finest resolution achieved using Pl´eiades. Therefore, the input Pl´eiades image is embedded in the finest-resolution levels of both quad-trees. Empty levels are filled in using wavelet transforms of the Pl´eiades data. The comment on the power-of-2 relation among the input resolutions holds again.
B. Multisensor hierarchical formulation of MPM
Owing to the quad-tree structure, a hierarchical MRF model, which consists of a series of random fields linked, at various scales, by suitable transition relations, can be defined (Fig. 1). The formulation of MPM proposed in [8] for multitemporal classification is extended here to multisensor fusion. MPM is used instead of the maximum a-posteriori (MAP) rule because MAP formulations on quad-trees, although they are feasible [11], [12], are affected by underflow and penalize errors regardless of the scale at which they occur – an undesired behavior for multiscale classification [8], [12], [13]. Collecting all the (optical, SAR, and wavelet) features of both quad-trees in the vector y, the posterior marginal p(xs|y) of the label xs of each site s in the second
quad-tree is expressed, under suitable conditional independence assumptions, as a function of the posterior marginals p(xs−|y)
and p(xs=|y) of the parent node s− in the same quad-tree and
the parent node s= in the first quad-tree, i.e. [8]:
p(xs|y) = X xs−,xs= p(xs, xs−, xs=|yd(s))p(xs−|y)p(xs=|y) P xsp(xs, xs−, xs=|yd(s)) , (1)
where it is proven in [8] that, under appropriate assumptions: p(xs, xs−, xs=|yd(s))p(xs) = (2)
= p(xs|xs−, xs=)p(xs−|xs=)p(xs=)p(xs|yd(s)),
and where yd(s) collects the features of all descendants of s,
p(xs) is the prior probability, p(xs|xs−, xs=) is the
parent-child transition probability, p(xs−|xs=) is the transition
pro-bability between sites at the same scale, and p(xs|yd(s)) is
the partial posterior marginal. While these quantities are made available, (1) and (2) recursively calculate p(xs|y) on each site
s of the second quad-tree. This is obtained using one bottom-up and two top-down recursive passes, which are described in the next subsections. Note that, by (1), the quad-trees are ordered. In the first proposed method, SAR and optical data are related to the first and second quad-trees, respectively. In the second method, two options are possible, i.e., CSK in the first quad-tree and RS2 in the second one or vice versa.
1) Initialization on the first quad-tree: First, classification is performed only on the first quad-tree using a traditional MPM on a single quad-tree [11]. As in [8] (to which we refer for details), the prior distribution at the root is modeled using a Potts MRF to favor spatial consistency. After the initialization stage, p(xf|y) is known for each site f of the first quad-tree
and p(xf|yd(f )) is derived as a by-product.
2) First top-down pass on the second quad-tree: The first top-down pass proceeds from the root to the leaves of the second quad-tree to recursively compute p(xs). As in [8], this
prior is initialized in each site s of the root of the second quad-tree as p(xs) = p(xf|yd(f )), where f is the site of the root
of the first quad-tree with the same location as s. Then, the recursion proceeds along the other levels down to the leaves:
p(xs) =
X
xs−
p(xs|xs−)p(xs−). (3)
This favors the same parent-child labeling and characterizes the statistical interactions between consecutive levels. We mo-del the parent-child transition probability p(xs|xs−) through
the parametric form in [14]. As a result of this top-down pass, p(xs) is derived on each site s of the second quad-tree.
3) Bottom-up pass on the second quad-tree: A bottom-up recursion is performed to compute p(xs, xs−, xs=|yd(s))
starting from the leaves of the second quad-tree and using (2) until the root is reached. In addition to p(xs), three sets
of probabilities are required: (i) the transition probabilities at the same scale p(xs−|xs=); (ii) the parent-child transition
probabilities p(xs|xs−, xs=); and (iii) the partial posterior
marginals p(xs|yd(s)). Details of the modeling of (i) and
(ii), which is performed parametrically, can be found in [8]. Concerning (iii), it has been proved that [11]:
p(xs|yd(s)) ∝ p(ys|xs)p(xs) Y u∈s+ X xu p(xu|yd(u))p(xu|xs) p(xu) (4)
where s+ and ys are the set of four children and the feature
vector of site s, respectively. First, p(xs|yd(s)) is initialized
on the leaves of the second quad-tree with p(xs|yd(s)) =
p(xs|ys) ∝ p(ys|xs)p(xs). Then, p(xs|yd(s)) is recursively
estimated with (4) up to the root. This recursion involves the pixelwise class-conditional PDF p(ys|xs) (see Section II-C).
After the bottom-up pass, p(xs, xs−, xs=|yd(s)) is computed
on each site s of the second quad-tree.
4) Second top-down pass on the second quad-tree and output labeling: First, the posterior marginal is initialized at the root of the second quad-tree as p(xs|y) = p(xs|yd(s)).
Then, given the quantities computed by the previous stages, p(xs|y) is derived on all sites s of all other levels of the
second quad-tree in a top-down pass using the recursion (1). Then, in principle, the class label xs that maximizes p(xs|y)
over the set of M classes could be assigned to s directly. This approach is often avoided in the literature of hierarchical MRFs because of its computational burden and of possible blocky artifacts [5], [11]. As an alternate approach, the case-specific formulation of the modified Metropolis dynamics algorithm [15] that was combined in [8] with MPM is extended here as well. The labeling result on the leaves of the second quad-tree represents the output classification map.
C. PDF estimation through finite mixtures
For each class m ∈ {1, 2, . . . , M } and each level n between the leaves and the root of each quad-tree q ∈ {1, 2}, we use a finite-mixture model for the pixelwise PDF p(ys|xs = m).
This choice is explained by the flexibility of finite mixtures in characterizing heterogeneous statistics such as those of HR imagery [8]. If the data at level n of quad-tree q are optical, then a multivariate Gaussian mixture is used [6]. The same model is used for wavelet transforms of optical data, because of the linearity of the wavelets. If the data at level n of quad-tree q are SAR, a mixture of generalized Gamma distributions is used. The generalized Gamma model has been found accurate for HR SAR [16], [17]; here, it is also extended as an empirical model for wavelet transforms of SAR data.
The mixture parameters are estimated using SEM, which is an iterative stochastic algorithm developed for problems cha-racterized by data incompleteness. SEM generates a random sequence of estimates, which does not converge almost surely but, under suitable assumptions, forms an ergodic homogene-ous Markov chain converging to a unique stationary distribu-tion, which is expected to concentrate around the global log-likelihood maxima [9]. Hence, initialization is not critical and is usually performed randomly with uniform distribution [9], [18]. The number of mixture components is also automatically estimated using the specific SEM formulation in [19]. For each scale n of each quad-tree q, SEM is separately applied to the training samples of each class m. For generalized Gamma mixtures, it is also combined with the method of log-cumulants (details can be found in [18], [19]).
III. EXPERIMENTAL RESULTS A. Results of the first proposed method
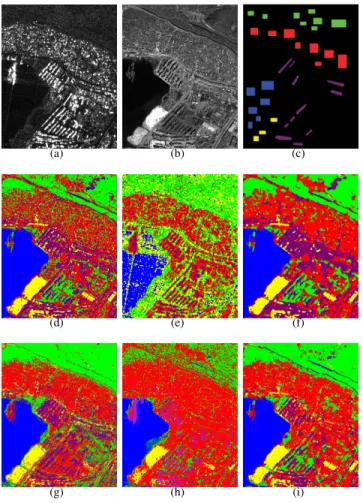
An HR dataset collected in 2010 over Port-au-Prince, Haiti, and composed of an HH-polarized single-look CSK stripmap
image with 2.5-m pixel spacing (325 × 400 pixels; Fig. 2(a)) and of a GeoEye-1 RGB image resampled at 2.5-m resolution (Fig. 2(b)), was used to experimentally validate the first proposed method. 2D Daubechies wavelets of order 10 were used. Five land cover classes were considered (see Table I and Fig. 2(c)). We compared the result of the proposed method (Fig. 2(i)) with those of: (i) the single-sensor multiscale classification of the image of each sensor, obtained by applying the original MPM to a single quad-tree [11] with Gaussian or generalized Gamma mixtures for the class-conditional PDFs of optical and SAR data, respectively (Figs. 2(d) and (e)); (ii) the multisensor multiresolution method in [5], in which a hierarchical MRF on a single quad-tree is used and multisensor fusion is addressed through copulas (Fig. 2(f)); (iii) the mul-tisensor single-resolution approach in [4], in which the joint class-conditional PDFs of multisensor data are modeled with meta-Gaussian distributions and combined with the maximum likelihood rule (Fig. 2(g)); and (iv) a support vector machine (SVM) applied to the stacked optical-SAR data as a nonpara-metric pixelwise benchmark (Fig. 2(h)). The Gaussian radial basis function kernel was used and the SVM parameters were optimized using the method in [20].
A visual analysis of the classification maps suggest that the first proposed method led to rather accurate results, especially as compared to the separate hierarchical classifications of the images of the two sensors. The results obtained using only SAR data accurately detected roads and poorly discrimina-ted most other classes, while the map generadiscrimina-ted using only optical data better discriminated classes that were spatially homogeneous. The proposed method took benefit from both sources and generated a result that visually discriminated quite well most classes. Compared to the multisensor single-scale method in [4], the proposed algorithm provided a spatially more regular map thanks to MRF modeling and wavelets.
Quantitative analysis on the test set confirmed that the proposed method provided quite high overall accuracy (OA) and Cohen’s κ, and improved as compared to the method in [4] (Table I). Poor discrimination was obtained by all techniques for “containers,” because of its large overlapping with “urban” in the multisensor or multispectral feature space. To improve the accuracy for this class, texture features could be integrated as an extension of the proposed method. The multisensor multiscale method in [5] also provided high accuracies, similar to those of the proposed algorithm, with slightly lower OA and higher κ. However, as compared to this technique, the proposed method improved in terms of spatial detail (Figs. 2(f) and (i)) and computation time (Table I). The approach to multi-sensor fusion based on distinct quad-trees related to individual sensors avoids the difficult and possibly time-expensive task of estimating the joint optical-SAR PDFs, whereas copula and meta-Gaussian models are used for this task in [5] and [4], respectively. The SVM provided lower accuracy than the other considered methods, which was expected because of its noncontextual formulation. The values of McNemar’s Z statistics of the maps of the benchmark methods with respect to the map of the proposed method are all much larger than the 5% significance threshold (|Z| > 1.96), which confirms that the differences among these results are significant.
FIRST PROPOSED METHOD, CSK-GEOEYE-1DATASET:TRAINING AND TEST SAMPLE SIZES;CLASSIFICATION ACCURACIES ANDκ; MCNEMAR’SZ
WITH RESPECT TO THE PROPOSED METHOD;AND COMPUTATION TIMES(INTEL I7QUAD-CORE, 2.40 GHZ, 8 GB RAM, 64BITLINUX SYSTEM).
water urban vegetation bare soil containers OA κ Z computation time [s] Proposed method 100% 78.12% 89.46% 98.78% 47.12% 82.69% 0.76 – 254 Method in [4] 99.95% 97.32% 90.81% 96.22% 37.25% 79.44% 0.68 1843.7 298 Method in [5] 100% 75.24% 87.16% 98.89% 49.31% 82.12% 0.79 89.6 668 SVM 96.52% 70.31% 44.28% 78.15% 43.20% 66.49% 0.57 2298.3 372 Training samples 50043 79492 51312 11667 38936 Test Samples 49057 75508 50688 10333 31064 TABLE II
SECOND PROPOSED METHOD, CSK-RS2-PLEIADES DATASET´ :TRAINING AND TEST SAMPLE SIZES;CLASSIFICATION ACCURACIES ANDκ;AND
MCNEMAR’SZWITH RESPECT TO THE PROPOSED METHOD.
water urban vegetation bare soil containers OA κ Z Pl´eiades only 100% 61.66% 81.69% 82.82% 56.72% 76.57% 0.63 1361.7 Pl´eiades + CSK 100% 44.32% 83.54% 74.75% 49.12% 70.34% 0.58 2102.7 Pl´eiades + RS2 92.56% 44.85% 79.85% 78.62% 42.15% 67.60% 0.57 2163.7 Proposed method (Pl´eiades + RS2 + CSK) 90.79% 91.45% 82.59% 81.02% 54.85% 80.14% 0.78 –
SVM 92.86% 92.56% 61.86% 69.91% 56.64% 74.76% 0.61 2302.9 Training samples 12943 15492 10312 8667 6016
Test samples 12057 14508 9688 6333 5984
B. Results of the second proposed method
A challenging VHR dataset, collected again over Port-au-Prince and composed of a Pl´eiades pansharpened image at 0.5-m resolution (1000 × 1000 pixels; Fig. 3(a)), an HH-polarized CSK spotlight image at 1-m resolution (Fig. 3(b)), and an HH-polarized RS2 ultrafine image with 1.56-m pixel spacing (Fig. 3(c)), was used for experiments. The same five classes of the previous section were considered (Table II). Given the 0.5-m resolution of the Pl´eiades data, we slightly resampled the RS2 image to obtain 2-m pixel spacing and fit with the power-of-2 constraint implied by the quad-tree. Downsampling from 1.56 to 2 m is expected to have a minor impact on the classification map, because the resampling ratio is quite close to 1. Preliminary experiments (not shown for brevity) indicated that the order in which CSK and RS2 data were inserted in the quad-trees did not significantly affect the results.
The second proposed method obtained rather high OA and κ on the test set (Table II) and remarkable spatial regula-rity (Fig. 3(h)). Again, poor discrimination was obtained for “containers.” To investigate the capability of the method to exploit the synergy among X-band, C-band, and VNIR data, comparisons with the results obtained by using the Pl´eiades image only by itself or together with either SAR image (Table II and Figs. 3(d), (e), and (f)) were conducted. In all these comparisons, the same quad-tree, MPM, and finite-mixture formulations as in the proposed method were used. The results obtained using only SAR data poorly discriminated the classes and are not reported for brevity. A comparison with a nonparametric pixelwise benchmark was performed by res-ampling the CSK and RS2 images on the 0.5-m grid, stacking them together, and applying an SVM with the same model selection strategy as in Section III-A (Fig. 3(g)). Quantitative analysis on the test set confirmed that the joint use of all three sensors led to substantially higher accuracies as compared to the use of a subset of the input data sources. The use of only the Pl´eiades image allowed “water,” “vegetation,” and “bare soil” to be effectively discriminated but led to poor detection of “urban.” The joint use of this VNIR image and of
X-band and C-X-band SAR through the second proposed method allowed improving the discrimination of “urban” of nearly 30% and outperformed the results obtained using the Pl´eiades data together with only one of the two SAR images. These results suggest the potential of the second proposed method in exploiting the complementarity of multisensor, multifrequency, and multiresolution data from current VHR satellite sensors. In this case as well, the noncontextual SVM obtained lower test-set accuracy and a more noisy map than the proposed method. McNemar’s test indicates that the differences between the results of the proposed method and of each benchmark are again significant. A shortcoming of the proposed technique was the lower accuracy for “water” than when only Pl´eiades or Pl´eiades and CSK data were used. Indeed, “water” appears highly textured in the RS2 image (Fig. 3(c)), whereas the proposed technique uses no texture features. On one hand, the accuracy of the proposed method for “water” is still around 91%. On the other hand, incorporating texture features could be a feasible extension of the second proposed method as well.
IV. CONCLUSION
A hierarchical MRF approach to multisensor and multire-solution optical-SAR image classification has been formula-ted, extending inference procedures originally introduced for multitemporal fusion and incorporating suitable finite mixture models. Two classification methods have been developed in this framework. Experimental results on challenging HR/VHR data sets have suggested the effectiveness of this approach to data fusion and the improvement of the two proposed me-thods as compared to single-sensor, single-resolution, and/or previous techniques in terms of accuracy, spatial precision, or computational burden. A further advantage of the proposed approach to fusion is its flexibility. While multitemporal fusion was already formalized in this framework in [8], the multiple quad-tree structure could be extended to also incorporate data from further sensors or feature extraction stages (e.g., textures or morphological profiles). This extension will be pursued in the near future. Moreover, alternate wavelet
de-(a) (b) (c)
(d) (e) (f)
(g) (h) (i)
Fig. 2. First proposed method: (a) CSK ( c ASI 2010) and (b) GeoEye-1 ( c GeoEye 2010; R-band display) images; (c) ground truth (training and test areas); results of the hierarchical MRF-based classifications of (d) the GeoEye-1 and (e) the CSK image; and (f) results of the techniques in [5] and (g) in [4], (h) SVM, and (i) the proposed method. Color legend: see Table I. compositions [10] will also be investigated, including wavelet packets, with which the number of transformed samples in the quad-tree is increased, and undecimated stationary wavelets, which preserve image size along different levels and could be incorporated into a multisource MRF energy as in [21].
REFERENCES
[1] C. Pohl and J. van Genderen, “Remote sensing image fusion: an update in the context of digital Earth,” International Journal of Digital Earth, vol. 7, no. 2, pp. 158–172, 2014.
[2] L. G´omez-Chova, D. Tuia, G. Moser, and G. Camps-Valls, “Multimodal classification of remote sensing images: a review and future directions,” Proceedings of the IEEE, vol. 103, no. 9, pp. 1560–1584, 2015. [3] M. Schmitt and X.-X. Zhu, “Data fusion and remote sensing: An
ever-growing relationship,” IEEE Geosci. Remote Sensing Magazine, vol. 4, no. 4, pp. 6–23, 2016.
[4] B. Storvik, G. Storvik, and R. Fjortoft, “On the combination of multi-sensor data using meta-Gaussian distributions,” IEEE Transactions on Geoscience and Remote Sensing, vol. 47, no. 7, pp. 2372–2379, 2009. [5] A. Voisin, V. Krylov, G. Moser, S. Serpico, and J. Zerubia, “Supervised
classification of multi-sensor and multi-resolution remote sensing images with a hierarchical copula-based approach,” IEEE Transactions on Geoscience and Remote Sensing, vol. 52, no. 6, pp. 3346–3358, 2014. [6] D. Landgrebe, Signal theory methods in multispectral remote sensing.
John Wiley & Sons, 2003.
[7] S. Li, Markov random field modeling in image analysis. Springer, 2009. [8] I. Hedhli, G. Moser, J. Zerubia, and S. B. Serpico, “A new cascade model for the hierarchical joint classification of multitemporal and multiresolution remote sensing data,” IEEE Transactions on Geoscience and Remote Sensing, vol. 54, no. 11, pp. 6333–6348, 2016.
(a) (b) (c)
(d) (e) (f)
(g) (h)
Fig. 3. Second proposed method: (a) Pl´eiades ( c CNES distribution Airbus DS; true-color display), (b) CSK ( c ASI 2011), and (c) RS2 ( c CSA 2011) images, and classification maps obtained using (d) only the Pl´eiades image, (e) the Pl´eiades and CSK images, (f) the Pl´eiades and RS2 images, (g) SVM, and (h) the proposed method with all images. Color legend: see Table II.
[9] G. Celeux, D. Chauveau, and J. Diebolt, “Stochastic versions of the EM algorithm: an experimental study in the mixture case,” J. Stat. Comput. Simul., vol. 55, no. 4, pp. 287–314, 1996.
[10] S. Mallat, A wavelet tour of signal processing. Academic Press, 2008. [11] J.-M. Lafert´e, P. P´erez, and F. Heitz, “Discrete Markov image modeling and inference on the quadtree,” IEEE Transactions on Image Processing, vol. 9, no. 3, pp. 390–404, 2000.
[12] A. Dawid, “Applications of a general propagation algorithm for proba-bilistic expert systems,” Statist. Comput., vol. 2, no. 1, p. 2536, 1992. [13] P. P´erez, A. Chardin, and J. M. Lafert´e, “Noniterative manipulation of
discrete energy-based models for image analysis,” Patt. Recog., vol. 33, no. 4, p. 573586, 2000.
[14] C. A. Bouman, A multiscale image model for Bayesian image segmen-tation. Technical report, Purdue University, 1991.
[15] M. Berthod, Z. Kato, S. Yu, and J. Zerubia, “Bayesian image classifica-tion using Markov random fields,” Image and Vision Computing, vol. 14, no. 4, pp. 285–295, 1996.
[16] H.-C. Li, W. Hong, Y.-R. Wu, and P.-Z. Fan, “On the empirical-statistical modeling of SAR images with generalized Gamma distribution,” IEEE J. Selected Topics Signal Process., vol. 5, no. 3, pp. 386–397, 2011. [17] V. Krylov, G. Moser, S. Serpico, and J. Zerubia, “On the method
of logarithmic cumulants for parametric probability density function estimation,” IEEE Trans. Image Process., vol. 22, pp. 3791–3806, 2013. [18] G. Moser, J. Zerubia, and S. B. Serpico, “Dictionary-based stochastic expectation-maximization for sar amplitude probability density function estimation,” IEEE Trans. Geosci. Remote Sens., vol. 44, no. 1, pp. 188– 200, 2006.
[19] V. A. Krylov, G. Moser, S. B. Serpico, and J. Zerubia, “Enhanced dictionary-based SAR amplitude distribution estimation and its valida-tion with very high-resoluvalida-tion data,” IEEE Geosci. Remote Sens. Lett., vol. 8, no. 1, pp. 148–152, 2011.
[20] G. Moser and S. B. Serpico, “Combining support vector machines and Markov random fields in an integrated framework for contextual image classification,” IEEE Trans. Geosci. Remote Sens., vol. 51, no. 5, pp. 2734–2752, 2013.
[21] A. H. S. Solberg, T. Taxt, and A. K. Jain, “A Markov random field model for classification of multisource satellite imagery,” IEEE Trans. Geosci. Remote Sens., vol. 34, pp. 100–113, 1996.