HAL Id: hal-02928937
https://hal.archives-ouvertes.fr/hal-02928937
Submitted on 21 Apr 2021
HAL is a multi-disciplinary open access
archive for the deposit and dissemination of sci-entific research documents, whether they are pub-lished or not. The documents may come from teaching and research institutions in France or abroad, or from public or private research centers.
L’archive ouverte pluridisciplinaire HAL, est destinée au dépôt et à la diffusion de documents scientifiques de niveau recherche, publiés ou non, émanant des établissements d’enseignement et de recherche français ou étrangers, des laboratoires publics ou privés.
research studies
P. Ciais, A. Bombelli, M. Williams, S. Piao, J. Chave, C. Ryan, M. Henry, P.
Brender, R. Valentini
To cite this version:
P. Ciais, A. Bombelli, M. Williams, S. Piao, J. Chave, et al.. The carbon balance of Africa: synthesis of recent research studies. Philosophical Transactions of the Royal Society A: Mathematical, Physical and Engineering Sciences, Royal Society, The, 2011, 369 (1943), pp.2038-2057. �10.1098/rsta.2010.0328�. �hal-02928937�
The carbon balance of Africa: synthesis
of recent research studies
BY P. CIAIS1,*, A. BOMBELLI2, M. WILLIAMS3, S. L. PIAO4, J. CHAVE5, C. M. RYAN3, M. HENRY2,6, P. BRENDER1,6 AND R. VALENTINI2,7
1Laboratoire des Sciences du Climat et de l’Environnement,
CEA-CNRS-UVSQ, CE Orme des Merisiers, 91191 Gif sur Yvette, France
2Department of Forest Environment and Resources (DISAFRI ),
University of Tuscia, via S. Camillo de Lellis, 01100 Viterbo, Italy
3School of GeoSciences, University of Edinburgh, Edinburgh EH9 3JN, UK 4Department of Ecology, College of Urban and Environmental Science,
Peking University, Beijing 100871, People’s Republic of China
5Laboratoire Evolution and Diversité Biologique, Bâtiment 4R3 Université
Paul Sabatier, 118 route de Narbonne, 31062 Toulouse cedex 4, France
6AgroParisTech-ENGREF, 19 avenue du Maine, 75732 Paris, France 7Euro-Mediterranean Center for Climate Change (CMCC), Via Augusto
Imperatore 16, 73100 Lecce, Italy
The African continent contributes one of the largest uncertainties to the global CO2
budget, because very few long-term measurements are carried out in this region. The contribution of Africa to the global carbon cycle is characterized by its low fossil fuel emissions, a rapidly increasing population causing cropland expansion, and degradation and deforestation risk to extensive dryland and savannah ecosystems and to tropical forests in Central Africa. A synthesis of the carbon balance of African ecosystems is provided at different scales, including observations of land–atmosphere CO2 flux and soil
carbon and biomass carbon stocks. A review of the most recent estimates of the net long-term carbon balance of African ecosystems is provided, including losses from fire disturbance, based upon observations, giving a sink of the order of 0.2 Pg C yr−1 with a large uncertainty around this number. By comparison, fossil fuel emissions are only of the order of 0.2 Pg C yr−1 and land-use emissions are of the order of 0.24 Pg C yr−1. The sources of year-to-year variations in the ecosystem carbon-balance are also discussed. Recommendations for the deployment of a coordinated carbon-monitoring system for African ecosystems are given.
Keywords: climate; carbon balance; carbon cycle; Africa
1. Introduction
The role of the African continent in the global carbon cycle is increasingly recognized [1,2]. Even if Africa contributes less than 4 per cent of the global fossil fuel emissions [3], it is a major source of interannual variability in global
*Author for correspondence (philippe.ciais@cea.fr).
One contribution of 17 to a Discussion Meeting Issue ‘Greenhouse gases in the Earth system: setting the agenda to 2030’.
atmospheric CO2 [2]. It is estimated that African ecosystems contribute 20 per
cent of global net primary production (NPP) and 20 per cent of global land-use CO2 emissions to the atmosphere from forest degradation and deforestation
(e.g. [4]). African ecosystems also contribute 40 per cent of fire emissions, mostly from savannah burning. These emissions affect atmospheric chemistry [5–8].
However, despite the increasingly acknowledged importance of African ecosystems in the global carbon cycle and their potential vulnerability in the future, owing to both ecological and socio-economic factors, there is still a lack of studies. In particular, very few inventory observations are available over tropical forests [9] and virtually none over savannahs and woodlands. Up to now many questions remain open, and it is not clear whether Africa is a net carbon source or a sink to the atmosphere.
The associated net release of carbon from land use change and forestry in sub-Saharan Africa is estimated to be 0.24 Pg C yr−1. This flux does not account for changes in fire regime and local wood collection for biofuel. A key motivation for studying the carbon balance of African forests is that deforestation in Central Africa has been historically less pronounced than in other tropical continents, but is now catching up. Although their exploitation is partly regulated, Central African forests are under the threat of accelerated logging, with 30 per cent of these forests currently being under logging concessions [10]. Wood removal from forests in Africa increased from 500× 106m3 (roughly 0.13 Pg C yr−1) to
660× 106m3 in 2005 [11]. The area of forest and woodlands decreased between 2000 and 2005 at a high rate of 6 Mha yr−1, explaining more than half of the global decline in forest area [11]. Although African forest carbon stocks appear to be particularly vulnerable, they have been spared from massive deforestation so far. In contrast, deforestation of savannah woodlands is rapid, with, for example, rates of 1.1 per cent per year in Tanzania and 1 per cent per year in Zambia [12]. Monitoring changes in savannah woodlands remains a major challenge for remote sensing, because of limited ground data, interannual variability and the presence of a dense grass layer. In the context of the Reduced Emissions from Deforestation and forest Degradation (REDD+) programmes, it is thus important to quantify both the carbon stocks and the carbon fluxes of African forests, because these stocks may be larger and less affected up to now by deforestation than other regions of the tropics.
African savannahs, which cover roughly 50 per cent of the continent [13], have a large contribution to global productivity also [14], and the role of fire is key in controlling their long-term carbon balance, as well as other ecosystem services [15]. While savannah carbon stocks are lower than those of closed forests, they cover three times larger areas in Africa [16].
The population of Africa is increasing faster than in other regions of the globe (http://maps.grida.no/). More than 40 per cent of the population lives in arid, semi-arid or dry sub-humid areas, all regions with extensive savannah coverage. Understanding the evolution of the human appropriation of the NPP [17] in Africa thus appears to be a crucial element in diagnosis at the regional level. There is an increasing regional pressure on ecosystem services, in particular for agricultural production [18]. Currently, the human appropriation of the NPP in densely populated regions of Africa is as high as in Europe [17]. Further, the NPP of cultivated ecosystems is most likely to be lower than natural NPP in this region [17]. Changes in global and local economic drivers, population
density, urban density and wealth are likely to modify regionally the human appropriation of the NPP and the regime of fires, which in turn will change the ecosystem productivity, ecosystem structure and the long-term carbon balance of the savannahs.
Unfortunately, because of heterogeneity and insufficient information, in situ data are scarce for characterizing the African carbon balance with sufficient accuracy. Apart from forest inventories in a few countries [11] and some local scale measurements or regional campaigns, such as the IGBP African transects initiated 10 years ago [19], there is no comprehensive information on African carbon stocks and fluxes. In that context, we review in this study the inventory of carbon stocks in African ecosystems, and establish a synthesis of various estimates of the carbon balance of forests and savannahs and their modelled variability during the last century. Finally, recommendations are made for securing a denser and more representative network of carbon observation stations over Africa, complemented by terrestrial biosphere models at various scales.
2. Carbon balance component definitions
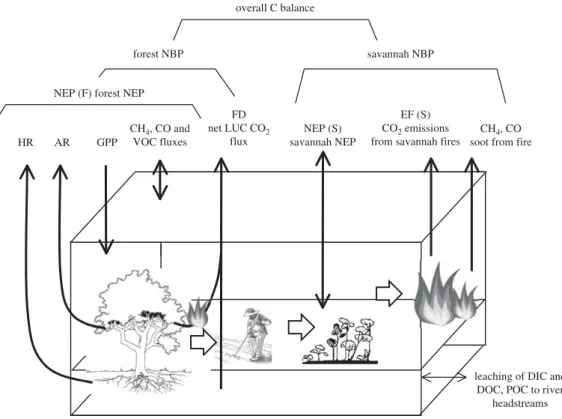
In general terms, the complete carbon budget of a given ecosystem can be summarized as shown in figure 1. In this figure, the relationships among the carbon (C) fluxes that determine the net ecosystem carbon balance (NECB) and the fluxes that determine the net ecosystem production (NEP) are represented. Fluxes contributing to the NECB are the CO2 net ecosystem exchange (NEE),
methane (CH4), carbon monoxide (CO) and volatile organic carbon (VOC)
emissions; lateral or leaching fluxes of dissolved organic (DOC) and inorganic carbon (DIC); and lateral or vertical movement of particulate carbon (PC) (non-gaseous, non-dissolved) by processes such as animal movement, soot emission during fires, water and wind deposition and erosion, and anthropogenic transport or harvest. Fluxes contributing to the NEP are gross primary production (GPP), autotrophic respiration (AR) and heterotrophic respiration (HR).
While GPP, NEP, NPP, AR and HR have definite time scales which usually span from minutes to a year, the NECB temporal scale is left undefined as it includes all the possible disturbances that usually occur during the entire life of an ecosystem. At site scale, the NECB should cover several decades, and could be estimated by measuring fluxes over chronosequences (Magnani et al. [20] for European forests). Averaging fluxes over a larger region accounts for the spatial distribution of disturbance and its effect on fluxes. If the disturbance regime is close to its steady state and regionally homogeneous, taking a spatial average could capture the NECP instead of a temporal average over a very long time period.
3. Carbon inventories
A carbon inventory involves the estimation of stocks and fluxes of carbon from different land-use systems in a given area. Further, ‘inventory’ is often referred to as the process of making such estimations. Carbon stores in a given land area consist of biomass and the soil carbon pools. The biomass pool includes above-ground and below-above-ground living biomass, litter and deadwood. A few manuals
overall C balance
forest NBP savannah NBP
NEP (F) forest NEP
NEP (S) savannah NEP
EF (S) CO2 emissions from savannah fires
CH4, CO soot from fire
leaching of DIC and DOC, POC to river
headstreams HR AR GPP CH4, CO and VOC fluxes FD net LUC CO2 flux
Figure 1. Illustration of the component fluxes of the NECB (NEE, net ecosystem exchange; VOC, volatile organic compounds; DIC, dissolved inorganic carbon; DOC, dissolved organic carbon, PC, particulate carbon).
or guidelines on carbon inventory methods are available for national inventory systems [21] and for agriculture, forest and other land uses [21], as well as the IPCC Good Practice Guidance for Land Use, Land-Use Change and Forestry (LULUCF) [22]. In these publications, the IPCC established methodologies and provided default values in order to help countries to establish their greenhouse gas inventory.
To measure changes in carbon stocks, the IPCC [21] recommends two options. The first one is the stock-difference method, consisting of measuring the difference between the actual stock of biomass at the beginning and that at the end of the accounting period. The second option is the gain–loss method, estimating biomass gains on the basis of typical growth rates in terms of the mean annual increment minus losses estimated from activities such as timber harvesting, logging damage, fuel wood collection and overgrazing as well as from fire. The IPCC concludes that the ‘gain–loss’ method can be used as a default when limited measured data are available, but that the ‘stock-difference’ method brings greater accuracy.
By measuring changes in carbon stocks over large areas, inventory studies provide spatially aggregated estimates of large-scale fluxes of CO2 over
multi-annual time scales [23]. Therefore, the inventory-based estimate of land–atmosphere fluxes can be used for comparison with other methodologies, such as eddy covariance and atmospheric inversions. Moreover, inventories give
a good indication of the capacity of ecosystems to photosynthesize and store carbon and an indication of the amount of C that could be released by land-use change. However, inventories in the tropics are generally inadequate, particularly in view of the high rates of land-use change, fire disturbance and heterogeneous carbon density in ecosystems. There are still large uncertainties in attempting to balance the terrestrial carbon budget on a global scale using inventory data [23].
The variability of the C stored in ecosystems varies among different vegetation and soil types, and disturbance histories. An effective stratification for sampling inventories should take into account the structure of the ecosystems, floristic composition and soil types. Adequate sampling could be achieved by remote sensing, ground truth measurements and soil maps. However, classifying and mapping the different forms and structure of the vegetation is problematic in Africa because of the lack of clear definitions of forest and forest changes, very few ground data for calibrating remote-sensing products and soil C stock estimates not amenable to remote-sensing analysis. Literature on soil C stocks and biomass in Africa indeed shows that authors used very different definitions for the same ecosystem types. Below, we present biomass, then soil organic carbon and litter measurements.
(a) Biomass inventories
Biomass density is one of the most important parameters for estimating ecosystem C losses resulting from changes in land cover and use of tropical forests. It is generally accepted that half of the biomass corresponds to carbon. Forest inventories are valuable sources of data for estimating biomass density, but inventories for the tropics are few in number and their quality is poor [24]. National inventories differ greatly in definitions, methodologies, standards and quality, and detailed information available at the national level is normally unavailable internationally [25]. In tropical zones, trees often have a larger proportion of their volume in branch wood than temperate trees. But forest inventories developed for commercial purposes usually ignore branches. Some authors developed expansion factors in order to infer biomass from commercial log volume [25], but availability of these expansion factors for African ecological zones is limited. Therefore, the greatest actual need for biomass inventories with dense spatial sampling is in the tropical and subtropical regions such as Africa, where the rates of deforestation are fast and biomass information is uncertain.
There is also a need to adapt forest inventory methodologies to allow for the assessment of both total forest biomass and potential fuelwood. The key issue is that the biomass structure is quite heterogeneous and so sample sizes need to take that into account, because small-sized plots do not provide sufficiently reliable information. Savannahs and shrublands contain very few large stems with most of the biomass requiring relatively large sampling plots. Tropical forests likewise pose specific challenges to biomass sampling [25]. The sampling plots need to be large enough to represent the spatial variability of the biomass, and include large enough trees to be representative of the local environment. For instance, Chave
et al. [26] recommended sampling plots of size 0.5–1 ha for tropical humid forests in Central America. In plantations, with even-aged stands, smaller plots may be
acceptable, with 0.1 ha plots suggested for teak plantations in Indonesia [27]. In addition, permanent tree plots should be replicated to avoid bias in local sampling. It is recommended that several tree plots of 0.5–1 ha should be set up, rather than one large plot [28]. The most important criterion is to find a good compromise between the cost and the feasibility of the measurements. Within one plot, a second level of stratification could be integrated by doing a niche-sampling strategy, allowing a significant reduction in the number and cost of measurements. (i) The trees
The development and use of allometric equations is the standard methodology to estimate the biomass of tree components in forested ecosystems. Biomass allometric equations can be developed by destructive or non-destructive methods that measure the volume and estimate the biomass using the wood’s density value and a biomass expansion factor [24]. Allometric equations may be developed locally from direct felling of a representative sample of trees, although this is a labour-intensive exercise. One method is to harvest all the trees in a plot of 0.25 ha and, for each stem, measure its diameter, total height, wood density, leaf mass and wood mass. The debate on using specific versus general allometric equations is still open, but will only be settled if more direct biomass harvest experiments are conducted.
Tree allometric equations establish the relationship between parameters such as diameter, height, crown diameter and the biomass or the volume. The diameter of the trees should be measured in the field, and information concerning the floristic composition and wood density relies on field work. However, the height and volume may be measured using LIDAR technology and the size of tree crowns may also be estimated with remote sensing [29], but not the wood density. In sampling plots, trees are mapped, tagged and their diameter measured to ensure that they can be measured again in the future (permanent sampling plots). Trunk diameter measurement is an important issue, because many tropical trees have buttresses that creep up the trunk as the tree grows. Diameter is taken at 1.30 m above ground (diameter at breast height), or 50 cm above buttresses in the case of buttressed trees, and the point of measurement is painted.
Allometric equations are statistically valid only at the site where they were generated. However, in general, these equations are much more broadly applied, including across continents. There is a scarcity of allometric equations generated in Africa. Using default allometrics to estimate biomass at a single site can generate quite different results, particularly at sites with large stems [30]. For instance, Henry et al. [31] estimated a difference of approximately 40 per cent in the above-ground biomass using site-specific versus generalized allometric equations.
(ii) The roots and litter
Roots are a significant component of stand biomass, particularly in the dry tropics. Most of the inventories use an average root-to-shoot ratio to estimate below-ground biomass [32]. For instance, the root-to-shoot ratio of woodland savannahs is estimated to be 0.42–0.48 [33], while in closed tropical forests the value is estimated to be 0.24. Very few studies are available on fine root biomass because these measurements are costly, time-consuming and difficult [34],
implying a large uncertainty in that component of inventories. Between the above-ground and below-above-ground compartments, the litter is considered only in scientific forest inventories monitoring plots. Sub-samples are established and the litter is taken, dried and measured [26].
(b) Soil carbon inventories
The soil organic carbon is contained within microaggregates and a part is lost through respiration and/or erosion after their destruction. The soil organic carbon varies as a function of the texture, the bulk density, the microbiological activity and the organic matter contained in the vegetation. As for biomass, quantifying soil organic carbon requires a sampling stratification, with identification of the different soil types, in order to decrease the cost of measurements. Measurement of soil organic carbon is costly and a composite sampling method, which consists of mixing soil samples from different soil profiles to obtain one average sample, is a good compromise. In addition, soil organic carbon content decreases with depth, the top-soil layers being the most affected by anthropogenic activities. Field measurements have to focus on representing the top-soil layers. The IPCC [22] considers 0–30 and 0–100 cm soil layers, but sampling depth in Africa could be more specific and adapted to soil type, as the soil layer may be thinner than 30 cm. Different methods to analyse soil organic carbon exist and are generally based on partial and total oxidation of organic carbon. In African savannahs and woodlands, soil organic carbon stocks are highly variable (30–140 tC ha−1, [30]). Devising a sampling strategy to upscale from point measurements is thus a difficult task. There is also evidence for significant losses of soil carbon following land-use change [30,35] that may equal losses owing to complete removal of vegetation cover.
New insights are coming from measurements of14C in soil carbon [36] of African
tropical forest soils. Recent data show the age of carbon up to 370 years in BC soil horizons, indicating a rather remarkable stability and probably a moderate mean influx of carbon into the soil.14C estimates of soil organic carbon mean residence
time could be a powerful tool in the future for understanding the potential role of carbon sequestration in tropical rainforest soils, if extended to include the large spatial scales of this African biome.
4. Long-term mean continental-scale carbon balance
Table 1summarizes the most recent estimates of carbon balance of the African continent based on Bombelli et al. [37], Ciais et al. [38], Williams et al. [30], Lewis
et al. [9] and Canadell et al. [3]. The key result is that the range of published estimates for the African carbon balance is quite large. According to Bombelli
et al. [37], the NEP of Africa varies from a sink of around 1 Pg C yr−1 (given by in situ measurements of both forest and savannah) to a large sink of 3.2 Pg C yr−1 (using model estimates for savannah). The United Nations Framework Convention on Climate Change (UNFCCC) inventory-based estimate leads to a small carbon sink of 0.16 Pg C yr−1but it does not explicitly consider the carbon budget of savannahs. Other studies such as those by Williams et al. [2] and Ciais
et al. [38] give a sink of 0.4–0.34 Pg C yr−1from models. This range from models is rather similar to that derived from UNFCCC estimates. The inclusion of fossil fuel
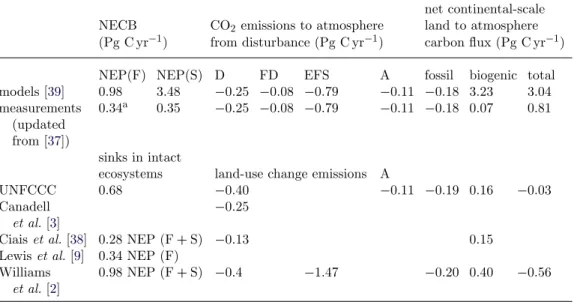
Table 1. Comparison between a preliminary carbon balance estimate derived from the most recent studies and the UNFCCC national communication data. NEP(F), NEP of forests; NEP(S), NEP of savannahs; D, emissions from deforestation and shifting agriculture; FD, emissions from forest degradation; EFS, emissions from savannah fires, assumed to be partly compensated by regrowth each year and yielding a neutral carbon balance; A, emissions from agriculture; fossil, emissions from fossil fuel. NEP(F) and NEP(S) estimates are from two sources. The first source is the average of estimates from four different models used by Weber et al. [39]. These model estimates are likely to overestimate sinks because land-use change was not accounted for in that study. The second source are literature data updated from Bombelli et al. [37], from Lewis et al. [9] for forest NEP(F), which accounts only for the biomass sink and ignores soil carbon from the median of data compiled in table 2 for savannah NEP(S), and from Canadell et al. [3] for fossil fuel emissions. Biogenic= NEP(F) + NEP(S) + D + FD + A when from measurements, and NEP(F) + NEP(S) + D+ FD + EFS + A when from models (fire emissions added because models calculate NEP(S) as a sink that must be offset by fire emissions). The sink of 0.2 Pg C yr−1 given in the abstract is the average of all estimates, excluding Weber et al. [39] in which not all the models included disturbance flux.
net continental-scale NECB CO2 emissions to atmosphere land to atmosphere (Pg C yr−1) from disturbance (Pg C yr−1) carbon flux (Pg C yr−1)
NEP(F) NEP(S) D FD EFS A fossil biogenic total
models [39] 0.98 3.48 −0.25 −0.08 −0.79 −0.11 −0.18 3.23 3.04 measurements (updated from [37]) 0.34a 0.35 −0.25 −0.08 −0.79 −0.11 −0.18 0.07 0.81 sinks in intact
ecosystems land-use change emissions A
UNFCCC 0.68 −0.40 −0.11 −0.19 0.16 −0.03
Canadell et al. [3]
−0.25
Ciais et al. [38] 0.28 NEP (F+ S) −0.13 0.15
Lewis et al. [9] 0.34 NEP (F) Williams
et al. [2]
0.98 NEP (F+ S) −0.4 −1.47 −0.20 0.40 −0.56
aFrom Lewis et al. [9].
emissions of 0.2 Pg C yr−1in the balance sheet reduces the natural sink potential, and can turn it into a small source of 0.03 Pg C yr−1if we consider the UNFCCC estimates.
(a) Savannahs
The African terrestrial carbon balance seems to be a carbon sink, but there is still a high uncertainty especially about the role of savannahs, which include tropical woodlands.
Savannahs are very productive when compared with other biomes [40,41], with an average NPP of 0.59± 0.22 Mg C ha−1yr−1 [42]. Scaling up this estimate to the entire African savannah biome gives an NPP of 8.9 Pg C yr−1, which is 13.6 per cent of the global NPP. The value from Grace et al. [42] is in the range of
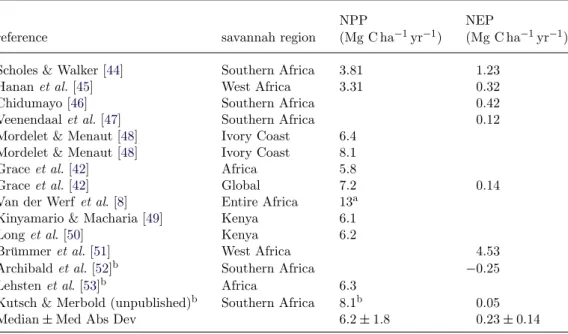
Table 2. NPP and NEP estimates for African savannahs in various regions of the continent.
NPP NEP
reference savannah region (Mg C ha−1yr−1) (Mg C ha−1yr−1)
Scholes & Walker [44] Southern Africa 3.81 1.23
Hanan et al. [45] West Africa 3.31 0.32
Chidumayo [46] Southern Africa 0.42
Veenendaal et al. [47] Southern Africa 0.12
Mordelet & Menaut [48] Ivory Coast 6.4 Mordelet & Menaut [48] Ivory Coast 8.1
Grace et al. [42] Africa 5.8
Grace et al. [42] Global 7.2 0.14
Van der Werf et al. [8] Entire Africa 13a Kinyamario & Macharia [49] Kenya 6.1
Long et al. [50] Kenya 6.2
Brümmer et al. [51] West Africa 4.53
Archibald et al. [52]b Southern Africa −0.25
Lehsten et al. [53]b Africa 6.3
Kutsch & Merbold (unpublished)b Southern Africa 8.1b 0.05
Median± Med Abs Dev 6.2± 1.8 0.23± 0.14
aThese values are likely to be too large and were excluded from the mean. bNPP is obtained by NPP= GPP × 0.5.
an average calculated using different field estimates of NPP and NEP in African savannahs (table 2). A recent GPP upscaling to savannahs and tropical grasslands by Beer et al. [43] gives a value of 30 Pg C yr−1.
The estimated carbon balance of savannahs is inferred from the terrestrial ecosystem models, in situ data and national communications, leading to high uncertainty about this estimate. The few available annual values from in situ estimates are very different from each other. The average model result also hides large differences among the different model outputs, with the sink strength ranging from 1.3 to 3.9 Pg C yr−1 (table 2). Moreover, terrestrial ecosystem models have not been calibrated/validated in depth for savannahs up to now. It is likely that a number of crucial processes are not yet well represented in these models. This highlights a crucial research need as the importance of savannahs for dynamics of the African carbon balance is also seen in their large interannual variability, which is at least partly related to water balance.
Savannah woodland carbon stocks are dominated by the soil (table 3). In a Mozambican miombo woodland, the total soil organic carbon stock was approximately 110 tC ha−1, 68 per cent of it in the top 50 cm. Tree biomass was approximately 30 tC ha−1. This distribution of soil C, which was not correlated with vegetation carbon stocks [33] and the very variable nature of soil organic matter, complicates the use of remote sensing for spatial mapping of African carbon stocks. The major long-term effect of fire is to alter the structure of savannah vegetation [54] and to reduce standing stocks of woody vegetation. One study suggests that global closed canopy forests would double in area in a world without fire, with most of the expansion being in African savannahs [54]. Long-term fire exclusion experiments around the world have shown that
(a) (b)
Figure 2. The effect of fire in miombo at Marondera, Zimbabwe. (a) A plot that was burned annually for 50 years. (b) A plot that has been protected from fire during the same period. See Furley [56] for further details. Pictures by C. Ryan. (Online version in colour.)
Table 3. Measured carbon stocks (g C m−2) in the Nhambita woodlands of Mozambique. Tree leaves, stems and roots include C stocks of all woody plants >0.3 cm diameter at 10 cm above the soil. Stocks are for annual maxima of grass and leaf biomass [55].
carbon pool stocks (gC m−2) s.e. (gC m−2)
leaves 72 7
stems 2220 171
coarse roots 1080 75
grass 120 20
soil (0–50 cm) 7630 716
mesic savannahs can indeed develop closed canopies and rapidly accrete woody biomass in the absence of fire (figure 2 and table 3). However, representing fire effects in regional and global ecosystem models is still in its infancy, and most fire modules within global vegetation models are parametrized and tested in boreal and temperate systems [57] where fire is a stand-replacing disturbance, unlike in savannahs where fires can recur every few years [15]. In addition, from preliminary CARBOAFRICA results (Castaldi et al. unpublished data), it seems that African savannahs represent a significant source of CH4by termite activity, thus reducing
their CO2 sink potential. Further studies are therefore needed to better quantify
this termite CH4 source value and the role of land characteristics on this source.
Hence, increasing field efforts and improving the terrestrial modelling capacity for savannah regions should be a key focus in future African carbon cycle research.
Summarizing these studies, African savannah can be considered a sink of 0.8± 1.6 tC ha−1yr−1. Savannah fire emissions, though large, represent a short-term source that is largely offset by ensuing regrowth.
(b) Forests
Africa holds 16 per cent of the global forest area [58]. African forests are among the most pristine on the Earth and contain large carbon stocks in biomass, up to 255 tC ha−1 in tropical areas [59]. The Congo Basin forest
is the world’s second largest tropical forest, covering 223 million hectares in six countries, and containing one-quarter of the world’s remaining tropical forest [58].
African forests are particularly vulnerable to a complex mixture of different factors: climate change, land-use change, population increase, poverty and political instability. The main result of this vulnerability is deforestation and/or forest degradation. At a global level, the forest sector contributes around 17 per cent of all greenhouse gas emissions from anthropogenic sources, making the forestry sector the second largest source after energy, and most of this is owing to deforestation and forest degradation [21]. Deforestation and forest degradation are two different processes with different ecological consequences. Deforestation is mainly associated with slash and burn agriculture [58], whereas degradation is mainly associated with selective logging activities, fuelwood gathering and grazing practice. From 2000 to 2005, Africa showed the highest negative rate of forest area change, with 0.6 per cent of annual loss, contributing 35 per cent of total tropical land clearing from deforestation (4 Mha annually). This value is comparable to forest loss in South America (4.3 Mha) and is likely to continue at current rates [60].
Houghton & Hackler [61] estimated an emission rate of 0.37 Pg C yr−1 from deforestation over the African continent. These carbon losses tend to be ‘permanent’ because afforestation and reforestation rates are modest, and represent less than 5 per cent of annual deforestation [6]. The associated net C loss from land use represents 20 per cent of the tropical total C loss, nearly all attributed to deforestation [6]. Annual net C emissions from conversion to crop cultivation land alone were estimated with coarse grid global models [62] to be about 0.8± 0.3 Pg C yr−1 over the period 1980–1989 for tropical lands, but only 0.1 Pg C yr−1 from Africa [1,62] where shifting cultivation is prevalent [61]. The reported error on the estimate of McGuire et al. [62] is from the spread of their four models. However, an increasing trend in land-use change is associated with the conversion of primary forests into agro-forestry systems, i.e. cocoa, rubber, palm oil, etc., plantations or even a mix of secondary forests and plantations. The carbon changes associated with the various land uses are still not adequately reported as, in most cases, such plantations may have repeated plantation cycles. Recent field studies [63] show that soil carbon changes can be less important than originally thought, owing to the fact that the new plantation is seeded on the forest soils without ploughing. Soil organic carbon changes become significant only in the following cycles of plantations when the decreased litter input starts to become limiting. Less is known about the impact of forest degradation on African C stocks. First estimates of emissions from degradation are 0.77 Pg C yr−1 [37], much more than deforestation, and this number awaits further confirmation.
Regarding intact forests, Lewis et al. [9] showed an increase in carbon storage of the African tropical forests, during the past 40 years, by 0.34 Pg C yr−1. A net sink in the forest of similar magnitude was also modelled by Ciais et al. [38], owing mainly to the effect of CO2fertilization and increasing precipitation in increasing
NPP. Therefore, African tropical forests are carbon sinks and are likely to remain sinks—if protected—in the longer term [9]. These data show the high potential of forests in Africa to mitigate climate change through carbon sequestration and reduction of emissions by avoiding forest degradation and deforestation.
5. Interannual variability
Figure 3 shows the interannual variability and trends of modelled Africa annual GPP, total ecosystem respiration (TER), fire emissions, land-use change-related carbon emission and the resulting net C balance (NBP) from the study of Ciais
et al. [38] using the ORCHIDEE process-based model. The variability of NBP is compared with that of temperature and precipitation from 1901 to 2002. At the continental scale, both GPP and TER are modelled to have significantly increased during the last century owing to the fertilization effects of increasing CO2 on photosynthesis. Annual GPP increased from 27 Pg C yr−1 in 1901 up
to 30 Pg C yr−1 in 2002, which is a total increase of 12 per cent (average trend of 0.03 Pg C yr−2). Annual NECB is modelled to have fluctuated around zero during the last century, but often shows positive values (sinks) in 1990s because of the rapidly increasing vegetation productivity (figure 3). Overall, the African net terrestrial carbon balance (NECB) simulated by ORCHIDEE changed from a net CO2 source to an atmosphere of 0.14 Pg C yr−1 in the 1980s to a net sink
of 0.15 Pg C yr−1 in the 1990s. Land-use change is modelled to be a source from 0.08 Pg C yr−1 in the 1980s to 0.13 Pg C yr−1 in the 1990s. This source is two times smaller than that obtained by Houghton [6], but the model ignored shifting agriculture and changes in agricultural practice, and more recent data used by Houghton et al. suggest a downward revision of emissions from Houghton [6] (see [64]). Summarizing the study of Ciais et al. [38], about 0.3 Pg C yr−1of net carbon accumulation in ecosystems driven by the rising atmospheric CO2 concentration
and recently increasing rainfall has nearly offset land-use change induced CO2
emissions to the atmosphere during the last two decades.
Interannual variations in African C balance are recognized by Williams et al. [2] to be significant in the context of global CO2growth rate variability. In Ciais et al.
[38], for instance, the NECB variability correlated better with GPP (r2= 0.47) than with TER (r2= 0.23), or than with emissions owing to fire (r2= 0.18) and land-use change (r2= 0.02). Savannahs show the highest correlation between GPP and NECB (r2= 0.55–0.63), while croplands show the lowest explanation of GPP on the interannual variation in NECB, particularly in Sahelian and Sudanian regions (r2= 0.41) [38]. Forests show a larger correlation (r2= 0.29– 0.33) between TER and NBP than savannahs and croplands, which is probably related to stem respiration and stem growth processes.
The ORCHIDEE model results shown in figure 3 suggest that the anomalous C loss by ecosystems in 1983–1984 (1.9 Pg C yr−1) was linked to an abnormally low GPP (2.9 Pg C yr−1less than the normal value), which was caused by below-average precipitation (106 mm yr−1). In contrast, wetter than usual conditions during 1909, 1923 and during 1962–1963 were modelled to cause an anomalous C uptake in these years. Among the different biomes, savannah shows the highest temporal correlation between NECB and precipitation, with 50 per cent of interannual variation in savannah NECB being explained by precipitation. By contrast, forest NBP is modelled to be only weakly related to rainfall (r2= 0.06– 0.24). A smaller effect of temperature on NBP variability may still be detectable (figure 3). For instance, large abnormal sinks are modelled in 1974 (1.0 Pg C yr−1) and in 1976 (1.2 Pg C yr−1) partly because of a TER drop due to cooler temperatures, with variation of TER across Africa being more closely correlated with temperature (r2= 0.16) than with precipitation (r2= 0.07).
4 (a) (b) (c) 2 0 –2 4 2 0 –2 2 0 –2 2 0 –2 100 50 0 –50 –100 0.8 0.4 0 –0.4 –0.8 1901 1911 1921 1931 1941 1951 year r2 (T versus NBP) = 0.09 r2 (P versus NBP) = 0.39 r2 (GPP versus NBP) = 0.47 r2 (TER versus NBP) = 0.23 r2 (fire versus NBP) = 0.18 r2 (land use versus NBP) = 0.02
temperature anomaly (°C) precipitation anomaly (mm yr –1 ) anomaly of GPP, TER and fire (Pg C yr –1 )
C emission owing to
land-use change or NBP (Pg C y r –1 ) NBP (Pg C yr –1 ) NBP (Pg C yr –1 ) source sink 1961 1971 1981 1991 2001
Figure 3. (a) Time series of GPP, TER, fire emissions, land-use change emissions and NBP over Africa during the past century from the ORCHIDEE model forced by climate reconstructions, rising CO2 and variable land-cover maps (see [38]). (b) Correlation between net carbon balance (NBP) and precipitation. (c) Correlation between net carbon balance and temperature. (a) Violet, GPP; green, TER; red, NBP; pink, fire; blue, land-use change. (b) Red, NBP; grey, precipitation. (c) Red, NBP; grey, temperature. (Online version in colour.)
In summary, interannual and decadal variability in African NBP are best explained over the past century by variations in precipitation (r2= 0.39) rather than by variations in temperature (r2= 0.09). The spatial distribution of interannual variability of GPP from four process models compared by Weber et al. [39] has been evaluated using SeaWifs observations of Fraction of canopy Absorbed Photosynthetically Active Radiation (FAPAR) [65]. The regions with most variability are clearly the savannahs. Most models agree with satellite observations on a very large variability of GPP in eastern regions of South Africa and in Mozambique. Models disagree with each other on the variability of GPP over Sahelian and Sudanian ecosystems in Weber et al. [39].
6. Uncertainties
The uncertainties associated with the current knowledge of the African ecosystems’ carbon balance are rather high, as shown by the different estimates. Currently, the carbon balance of African ecosystems varies from a sink of about 3.2 Pg C yr−1 to a small source. There are uncertainties associated with fundamental processes and methodologies, in particular:
— The savannahs, carbon balance. It is still uncertain whether the balance of savannahs is a net source or a net sink, owing to the large variability in savannah types across climates and soils. In addition, the role of fire disturbance on the C balance of savannahs is not accurately known. — The carbon sink of tropical African forests. There is some observational
and model evidence that the NPP has increased in recent years [9,38], but the net forest NBP is not yet fully understood. There is only one flux tower in a tropical forest in Africa (Ghana), but this tower is recently established and data are not yet fully exploited and analysed. A combination of in situ fluxes and inventories is needed to constrain the carbon budget of the tropical forests of Africa. Also, the soil carbon dynamics is poorly investigated and may bring new insights on possible carbon storage in the soil.
— The role of forest degradation and deforestation. Most of the tropical forest disturbances in Africa are due to logging rather than to fires or conversion to other land use. Data on logging are difficult to obtain and only very uncertain estimates of forest degradation become available.
— The role of interannual variability. This factor is of key importance in determining the direction of the African carbon budget (sink or source). The regions that are ‘hot spots’ of interannual variability are shown to correspond mostly to savannahs [39], in particular in the South African eastern regions.
— Uncertainties in the methods used for ecological classification, data harmonization, measurement and area assessment, particularly for what is happening in the forest remaining as forest.
7. Outlook: a future African integrated carbon-observing system
Because of highly variable CO2 fluxes and insufficiently studied ecosystems and ecosystem–human–climate interactions, there is a need for continued and enhanced observations of carbon stocks, fluxes and atmospheric concentrations to enable more precise assessments of Africa’s carbon cycle, and its sensitivity to natural and anthropogenic pressures and future climate. Of primary importance is the need for continent-wide carbon cycle observations that support both bottom-up and top-down methods of estimating carbon sources and sinks. Such an African integrated carbon-observing system would encompass the following components: — Regional inventories and monitoring of soil and vegetation carbon stocks by forest and agricultural research stations, long established in most African countries, such as the AFRITRON long-term forest
plot monitoring network (www.afritron.org). Include new tools such as
14C dating of soil carbon to be integrated in the ‘in situ’ inventory
networks.
— Satellite-based estimates of forest biomass C stock distribution, using microwave measurements or optical measurements combined with field observations. In the future, the DESDynl and BIOMASS [66] missions should provide very valuable data and extensive coverage of tropical forest biomass.
— A pan-African network of eddy covariance flux towers, allowing the characterization of spatial gradients and temporal variations of CO2, and heat and water vapour fluxes over representative forests, woodlands, savannahs and rangelands. Agro-ecosystems should be included as well in this African flux tower network, with measurements covering the full sequence of cultivation, abandonment and fallow. Similarly, varying intensities of grazing lands and livestock production systems should be measured. Given the diversity of climate and disturbance regimes affecting ecosystems, and the ongoing deforestation and forest degradation, not only pristine and weakly disturbed ecosystems but also degraded lands, cleared and degraded forests, and burned savannahs need to be measured for fluxes and stocks.
— An atmospheric CO2 and CH4 concentration measurement network over Africa enabling better constrained inversion estimates of regional carbon sources and sinks and their temporal variability both in Africa and globally. Network design studies with atmospheric inversion models suggest that 50 stations optimally placed in Africa would already provide a significant error reduction in the continental-scale CO2 balance and its variability.
— The development of cheap, robust and autonomous eddy flux measurement systems and atmospheric CO2–CH4 concentration measurement sensors that could be deployed at a modest cost over a wide range of research/monitoring stations, powered by solar panels and equipped by robust data transmission systems. In parallel, training of local personnel is crucial for the correct use and maintenance of the equipment and to help in data processing and interpretation.
— Satellite observations of CO, CO2 and CH4 columnar content over Africa from the existing sensors IASI, MOPITT, AIRS (Atmospheric Infrared Sounder), SCIAMACHY and TES (Tropospheric Emission Spectrometer) in the case of CO; IASI, AIRS, SCIAMACHY and GOSAT in the case of CH4; and GOSAT in the case of CO2and CH4, while keeping the continuity of dataflow for CO (MOPITT, IASI). The accuracy requirement for the mixing ratio retrievals to be useful for flux inversion are about a few per cent for CO, a per cent for CH4 and a few tenths of a per cent for CO2, with maximum sensitivity to planetary boundary layer and systematic errors required to be typically 10 times smaller than random errors for each species.
— Validated, systematic, unbiased, near-real-time and operational satellite observations of active fires, burn scars and estimates of fire radiative power. Satellite observations of fire counts, burned areas, fire radiative power, including multi-sensor data products for calibration/validation of
terrestrial biosphere models and C balance estimations. The European Space Agency Climate Change Initiative is a process that will address some of these issues.
— Satellite-based studies combined with field ground-truthing to assess local to regional land-cover mapping and changes, as well as land-use practices and land-cover monitoring over Africa with an annual frequency using space-borne sensors should be implemented.
— Satellite-based monitoring of vegetation biophysical properties using optical measurements, including the provision of greenness, vegetation health indexes, primary production, leaf area index and FAPAR quantities with typical spatial resolution of some hundreds of metres and temporal revisit of few days, enabling capture of phonological events and ecosystem state and condition.
The process of integrating these multiple streams of observations into carbon cycle models specifically adapted and calibrated to describe the functioning of African ecosystems will require assimilation techniques that modify model behaviour to match observations. This approach is given a wide variety of names such as model–data fusion, the multiple constraint approach or carbon cycle data assimilation. Examples of such applications in the context of quantification and understanding of the African carbon balance are the estimation of phenology parameters from satellite observations, estimates of photosynthetic parameters using CO2 and heat fluxes from eddy covariance networks, a larger suite of parameters in a terrestrial model and biomass inventory data [67].
Most importantly, every observation will need to be associated with an uncertainty to weigh the observation’s influence on the underlying models. The integration of process-driven or data-driven models of the African carbon balance requires strategies for both data requirement and modelling assimilation. Using inverse modelling and assimilation to place constraints on the fluxes of CO2
between African ecosystems and the atmosphere requires reliable, quality assured and well-calibrated measurements of key carbon stocks and fluxes. In addition, there are a number of control parameter observations that are crucial to the data assimilation and model–data fusion system. In that direction, one can recommend the following:
— Implement model–data fusion techniques to routinely assimilate data streams of carbon measurements to produce consistent and accurate estimates of daily CO2 flux fields over Africa with typical resolution of 10 km. Possibly finer resolutions over specific regions.
— Merge, synthesize and eventually fuse carbon observations within process-oriented carbon models.
— Provide visualization interface and user services to the resulting CO2 flux and biomass, and soil carbon fields that will be made available for assessment, policy and resource management.
— Provide regular assessments of the African carbon balance and its uncertainties, including identification of hotspot regions and vulnerabilities.
— Implement a data management system for African carbon cycle data, integrated in the global carbon cycle data management system. The specific functions required of the African carbon cycle data management
system to support innovative data assimilation methods need to be identified and plans made to provide that support. Several of the required data streams exist today and systems are in place for handling many of these individual data streams. The IGCO data and information management system should build on these existing systems within the global GEOSS data architecture.
This work benefited from the COCOS and CARBOAFRICA projects funded by the 7th Framework Programme of the European Union, and by ERC grant Africa GHG.
References
1 Houghton, R. A. & Hackler, J. L. 2006 Emissions of carbon from land use change in sub-Saharan Africa. J. Geophys. Res. 111, G02003. (doi:10.1029/2005JG000076)
2 Williams, C. A., Hanan, N. P., Neff, J. C., Scholes, R. J., Berry, J. A., Denning, A. S. & Baker, D. F. 2007 Africa and global carbon cycle. Carbon Balance Manage. 2, 3. (doi:10.1186/ 1750-0680-2-3)
3 Canadell, J. G., Raupach, M. R. & Houghton, R. A. 2009 Anthropogenic CO2 emissions in Africa. Biogeosciences 6, 463–468. (doi:10.5194/bg-6-463-2009)
4 Laporte, N., Merry, F., Baccini, A., Goetz, S., Stabach, J. & Bowman, M. 2007 Reducing CO2 emissions from deforestation and degradation in the Democratic Republic of Congo: a first look. Falmouth, MA: The Woods Hole Research Center.
5 Andreae, M. O. 1991 Biomass burning: its history, use and distribution and its impact on the environmental quality and global climate. In Global biomass burning: atmospheric, climatic and biospheric implications (ed. J. S. Levine). Cambridge, MA: MIT Press.
6 Houghton, R. A. 2003 Revised estimates of the annual net flux of carbon to the atmosphere from changes in land use and land management 1850–2000. Tellus Ser. B-Chem. Phys. Meteorol. 55, 378–390. (doi:10.1034/j.1600-0889.2003.01450.x)
7 Kituyi, E., Wandiga, S. O., Andreae, M. O. & Helas, G. B. 2005 Biomass burning in Africa: role in atmospheric change and opportunities for emission mitigation. In Climate change and Africa (ed. S. Low), pp. 79–89. Cambridge, UK: Cambridge University Press.
8 Van der Werf, G. R., Randerson, J. T., Giglio, L., Collatz, G. J., Kasibhatla, P. S. & Arellano Jr, A. F. 2006 Interannual variability in global biomass burning emissions from 1997 to 2004. Atmos. Chem. Phys. 6, 3423–3441. (doi:10.5194/acp-6-3423-2006)
9 Lewis, S. L. et al. 2009 Increasing carbon storage in intact African tropical forests. Nature 457, 1003–1006. (doi:10.1038/nature07771)
10 CARPE (Central African Regional Programme for the Environment). The forests of the Congo Basin 2008. State of the Forest. See http://carpe.umd.edu/the-forests-of-the-congo-basin-state-of-the-forest-2008-report.
11 FAO. 2007 State of the world’s forests. Rome, Italy: Food and Agriculture Organization of the United Nations.
12 FAO. 2005 State of the world’s forests. Rome, Italy: Food and Agriculture Organization of the United Nations.
13 Menaut, J. C., Barbault, R., Lavelle, P. & Lepage, M. 1985 African savannas: biological systems of humification and mineralization. In Ecology and management of the world’s savannas (eds J. C. Tothill & J. J. Mott), pp. 14–33. Canberra, Australia: Australian Academic Science. 14 Saugier, B., Roy, J. & Mooney, H. A. 2001 Terrestrial global productivity. London, UK: Academic
Press.
15 Ryan, C. M. & Williams, M. In press. How does fire intensity and frequency affect miombo woodland tree populations and biomass? Ecol. Appl. (doi:10.1890/09-1489.1)
16 Bartholome, E. & Belward, A. S. 2005 GLC2000: a new approach to global land cover mapping from Earth observation data. Int. J. Remote Sens. 26, 1959–1977. (doi:10.1080/ 01431160412331291297)
17 Haberl, H., Erb, K. H., Krausmann, F., Gaube, V., Bondeau, A., Plutzar, C., Gingrich, S., Lucht, W. & Fischer-Kowalski, M. 2007 Quantifying and mapping the human appropriation of net primary production in earth’s terrestrial ecosystems. Proc. Natl Acad. Sci. USA 104, 12 942–12 947. (doi:10.1073/pnas.0704243104)
18 Sultan, B., Baron, C., Dingkuhn, M., Sarr, B. & Janicot, S. 2005 Agricultural impacts of large-scale variability of the West African monsoon. Agric. Forest Meteorol. 128, 93–110. (doi:10.1016/ j.agrformet.2004.08.005)
19 Koch, G. W., Vitousek, P. M., Steffen, W. L. & Walker, B. H. 1995 Terrestrial transects for global change research. Plant Ecol. 121, 53–65. (doi:10.1007/BF00044672)
20 Magnani, F. et al. 2007 The human footprint in the carbon cycle of temperate and boreal forests. Nature 447, 849–851. (doi:10.1038/nature05847)
21 IPCC. 2006 2006 IPCC guidelines for national greenhouse gas inventories. Prepared by the National Greenhouse Gas Inventories Programme (eds H. S. Eggleston, L. Buendia, K. Miwa, T. Ngara & K. Tanabe). Japan: IGES.
22 IPCC. 2003 Good practice guidance for land use, land-use change and forestry. Kanagawa, Japan: IPCC National Greenhouse Gas Inventories Programme.
23 IPCC. 2001 Climate change: the scientific basis. In Contribution of Working Group I to the Third Assessment Report of the Intergovernmental Panel on Climate Change (IPCC) (eds J. T. Houghton, Y. Ding, D. J. Griggs, M. Noguer, P. J. van der Linden & D. Xiaosu). Cambridge, UK: Cambridge University Press.
24 Brown, S. & Lugo, A. E. 1992 Biomass of Brazilian Amazon forests—the need for good science. Interciencia 17, 201–203.
25 Brown, S. 1997 Estimating biomass and biomass change of tropical forests: a primer. Rome, Italy: Food and Agriculture Organization of the United Nations.
26 Chave, J. et al. 2005 Tree allometry and improved estimation of carbon stocks and balance in tropical forests. Oecologia 145, 87–99. (doi:10.1007/s00442-005-0100-x)
27 Lynch, T. B. & Rusydi, R. 1999 Distance sampling for forest inventory in Indonesian teak plantations. Forest Ecol. Manage. 113, 215–221. (doi:10.1016/S0378-1127(98)00427-7)
28 Chave, J., Condit, R., Aguilar, S., Hernandez, A., Lao, S. & Perez, R. 2004 Error propagation and scaling for tropical forest biomass estimates. Phil. Trans. R. Soc. Lond. B 359, 409–420. (doi:10.1098/rstb.2003.1425)
29 Clark, D. B., Read, J. M., Clark, M. L., Cruz, A. M., Dotti, M. F. & Clark, D. A. 2004 Application of 1-M and 4-M resolution satellite data to ecological studies of tropical rain forests. Ecol. Appl. 14, 61–74. (doi:10.1890/02-5120)
30 Williams, M., Ryan, C. M., Rees, R. M., Sambane, E., Fernando, J. & Grace, J. 2008 Carbon sequestration and biodiversity of re-growing miombo woodlands in Mozambique. Forest Ecol. Manage. 254, 145–155. (doi:10.1016/j.foreco.2007.07.033)
31 Henry, M., Besnard, A., Asante, W. A., Eshun, J., Adu-Bredu, S., Valentini, R., Bernoux, M. & Saint-André, L. 2010 Wood density, phytomass variations within and among trees, and allometric equations in a tropical rainforest of Africa. Forest Ecol. Manage. 260, 1375–1388. (doi:10.1016/j.foreco.2010.07.040)
32 Cairns, M. A., Brown, S., Helmer, E. H. & Baumgardner, G. A. 1997 Root biomass allocation in the world’s upland forests. Oecologia 111, 1–11. (doi:10.1007/s004420050201)
33 Ryan, C. M., Williams, M. & Grace, J. In press. Above and below ground carbon stocks in a miombo woodland landscape of Mozambique. Biotropica. ( doi:10.1111/j.1744-7429.2010.00713.x)
34 Jackson, R. B., Canadell, J., Ehleringer, J. R., Mooney, H. A., Sala, O. E. & Schulze, E. D. 1996 A global analysis of root distributions for terrestrial biomes. Oecologia 108, 389–411. (doi:10.1007/BF00333714)
35 Walker, S. & Desanker, P. 2004 The impact of land use on soil carbon in Miombo woodlands of Malawi. Forest Ecol. Manage. 203, 354–360. (doi:10.1016/j.foreco.2004.08.004)
36 Chiti, T., Certini, G., Grieco, E. & Valentini, R. 2010 The role of soil in storing carbon in tropical rainforests: the case of Ankasa Park. Ghana Plant Soil 331, 453–461. (doi:10.1007/ s11104-009-0265-x)
37 Bombelli, A. et al. 2009 An outlook on the sub-Saharan Africa carbon balance. Biogeosciences 6, 2193–2205. (doi:10.5194/bg-6-2193-2009)
38 Ciais, P., Piao, S.-L., Cadule, P., Friedlingstein, P. & Chedin, A. 2009 Variability and recent trends in the African carbon balance. Biogeosciences 5, 3497–3532.
39 Weber, U. et al. 2009 The interannual variability of Africa’s ecosystem productivity: a multi-model analysis. Biogeosciences 6, 285–295. (doi:10.5194/bg-6-285-2009)
40 Lieth, H. & Whittaker, R. H. (eds) 1975 Primary productivity of the biosphere. Ecological Studies, vol. 14. New York, NY: Springer-Verlag.
41 Scholes, R. J. & Hall, D. O. 1996 The carbon budget of tropical savannas, woodlands and grasslands. In Global change: effects on coniferous forests and grasslands (eds A. Breymeyer et al.), pp. 69–100. SCOPE 56. Chichester, UK: John Wiley.
42 Grace, J., San José, J., Meir, P., Miranda, H. S. & Montes, R. A. 2006 Productivity and carbon fluxes of tropical savannas. J. Biogeogr. 33, 387–400. (doi:10.1111/j.1365-2699.2005.01448.x) 43 Beer, C. et al. 2010 Terrestrial gross carbon dioxide uptake: global distribution and covariation
with climate. Science 329, 834–838. (doi:10.1126/science.1184984)
44 Scholes, R. J. & Walker, B. H. 1993 An African savanna: synthesis of the Nylsvley study. Cambridge, UK: Cambridge University Press.
45 Hanan, N. P., Kabat, P., Dolman, A. J. & Elbers J. A. 1998 Photosynthesis and carbon balance of a Sahelian fallow savanna. Global Change Biol. 4, 523–538. (doi:10.1046/j.1365-2486. 1998.t01-1-00126.x)
46 Chidumayo, E. N. 2002 Changes in miombo woodland structure under different land tenure and use systems in central Zambia. J. Biogeogr. 29, 1619–1626. ( doi:10.1046/j.1365-2699.2002.00794.x)
47 Veenendaal, E. M., Kolle, O. & Lloyd, J. 2004 Seasonal variation in energy fluxes and carbon dioxide exchange for a broadleaved semi-arid savanna (Mopane woodland) in southern Africa. Global Change Biol. 10, 318–328. (doi:10.1111/j.1365-2486.2003.00699.x)
48 Mordelet, P. & Menaut, J. C. 1995 Influence of trees on aboveground production dynamics of grasses in a humid savanna. J. Veget. Sci. 6, 223–228. (doi:10.2307/3236217)
49 Kinyamario, J. I. & Macharia, J. N. M. 1992 Above-ground standing-crop, protein content and dry matter digestibility of a tropical grassland range in the Nairobi National Park, Kenya. Afr. J. Ecol. 30, 33–41. (doi:10.1111/j.1365-2028.1992.tb00476.x)
50 Long, S. P., Garcia Moya, E., Imbamba, S. K., Kamnalrut, A., Piedade, M. T. F., Scurlock, J. M., Shen, Y. K. & Hall, D. O. 1989 Primary productivity of natural grass ecosystems of the tropics, a reappraisal. Plant Soil 115, 155–166. (doi:10.1007/BF02202584)
51 Brummer, C., Falk, U., Papen, H., Szarzynski, J., Wassmann, R. & Bruggemann, N. 2008 Diurnal, seasonal, and interannual variation in carbon dioxide and energy exchange in shrub savanna in Burkina Faso (West Africa). J. Geophys. Res. 113, G02030. (doi:10.1029/2007 JG000583)
52 Archibald, S. A., Kirton, A., van der Merwe, M. R., Scholes, R. J., Williams, C. A. & Hanan, N. 2009 Drivers of inter-annual variability in net ecosystem exchange in a semi-arid savanna ecosystem, South Africa. Biogeosciences 6, 251–266. (doi:10.5194/bg-6-251-2009)
53 Lehsten, V., Tansey, K., Balzter, H., Thonicke, K., Spessa, A., Weber, U., Smith, B. & Arneth, A. 2009 Estimating carbon emissions from African wildfires. Biogeosciences 6, 349–360. (doi:10.5194/bg-6-349-2009)
54 Bond, W. J. & Keeley, J. E. 2005 Fire as a global ‘herbivore’: the ecology and evolution of flammable ecosystems. Trends Ecol. Evol. 20, 387–394. (doi:10.1016/j.tree.2005.04.025) 55 Ryan, C. M. 2009 Carbon cycling, fire and phenology in a tropical savanna woodland in
Nhambita, Mozambique. Edinburgh, UK: School of Geosciences, University of Edinburgh. 56 Furley, P. A., Rees, R. M., Ryan, C. M. & Saiz, G. 2008 Savanna burning and the assessment
of long-term fire experiments with particular reference to Zimbabwe. Prog. Phys. Geogr. 32, 611–634. (doi:10.1177/0309133308101383)
57 Venevsky, S., Thonicke, K., Sitch, S. & Cramer, W. 2002 Simulating fire regimes in human-dominated ecosystems: Iberian Peninsula case study. Glob. Change Biol. 8, 984–998. (doi:10.1046/j.1365-2486.2002.00528.x)
58 FAO. 2006 Global forest resources assessment 2005: progress towards sustainable forest management. FAO Forestry paper no. 147. Rome, Italy: Food and Agriculture Organization of the United Nations.
59 Palm, C. A. et al. 1999 Carbon sequestration and trace gas emissions in slash-and-burn and alternative land-uses in the humid tropics. Alternative to Slash-and-Burn Climate Change Working Group Final Report Phase II. Nairobi, Kenya: ICRAF.
60 FAO. 2009 State of the world’s forests. Rome, Italy: Food and Agriculture Organization of the United Nations.
61 Houghton, R. A. & Hackler, J. L. 2006 Emissions of carbon from land use change in sub-Saharan Africa. J. Geophys. Res. 111, G02003. (doi:10.1029/2005JG000076)
62 McGuire, A. D. et al. 2001 Carbon balance of the terrestrial biosphere in the twentieth century: analyses of CO2, climate and land use effects with four process-based ecosystem models. Glob. Biogeochem. Cycles 15, 183–206. (doi:10.1029/2000GB001298)
63 Grieco, E. 2010 Land use change and carbon sequestration in sub-saharan Africa. PhD thesis, University of Tuscia, Italy.
64 Le Quere, C. et al. 2009 Trends in the sources and sinks of carbon dioxide. Nat. Geosci. 2, 831–836. (doi:10.1038/ngeo689)
65 Gobron, N. & Belward, A. 2009 Global vegetation condition. In State of the Climate in 2008 (eds T. C. Peterson & M. O. Baringer). Bull. Am. Meteorol. Soc. 90, 44–45.
66 Le Toan, T. et al. In press. The BIOMASS Mission: mapping global forest biomass to better understand the terrestrial carbon cycle. Remote Sens. Environ.
67 Williams, M. et al. 2009 Improving land surface models with FLUXNET data. Biogeosciences 6, 1341–1359. (doi:10.5194/bg-6-1341-2009)

![Figure 3. (a) Time series of GPP, TER, fire emissions, land-use change emissions and NBP over Africa during the past century from the ORCHIDEE model forced by climate reconstructions, rising CO 2 and variable land-cover maps (see [38])](https://thumb-eu.123doks.com/thumbv2/123doknet/13713380.434653/14.739.89.637.89.646/figure-emissions-emissions-africa-century-orchidee-reconstructions-variable.webp)
