HAL Id: insu-01964572
https://hal-insu.archives-ouvertes.fr/insu-01964572
Submitted on 12 Mar 2021HAL is a multi-disciplinary open access
archive for the deposit and dissemination of sci-entific research documents, whether they are pub-lished or not. The documents may come from teaching and research institutions in France or abroad, or from public or private research centers.
L’archive ouverte pluridisciplinaire HAL, est destinée au dépôt et à la diffusion de documents scientifiques de niveau recherche, publiés ou non, émanant des établissements d’enseignement et de recherche français ou étrangers, des laboratoires publics ou privés.
Benjamin Sultan, Ben Parkes, Marco Gaetani
To cite this version:
Benjamin Sultan, Ben Parkes, Marco Gaetani. Direct and indirect effects of CO2 increase on crop yield in West Africa. International Journal of Climatology, Wiley, 2019, 39 (4), pp.2400-2411. �10.1002/joc.5960�. �insu-01964572�
Direct and indirect effects of CO2 increase on crop yield in
West Africa
DOI:
10.1002/joc.5960 Document Version
Accepted author manuscript
Link to publication record in Manchester Research Explorer Citation for published version (APA):
Sultan, B., Parkes, B., & Gaetani, M. (2019). Direct and indirect effects of CO2 increase on crop yield in West Africa. International Journal of Climatology. https://doi.org/10.1002/joc.5960
Published in:
International Journal of Climatology Citing this paper
Please note that where the full-text provided on Manchester Research Explorer is the Author Accepted Manuscript or Proof version this may differ from the final Published version. If citing, it is advised that you check and use the publisher's definitive version.
General rights
Copyright and moral rights for the publications made accessible in the Research Explorer are retained by the authors and/or other copyright owners and it is a condition of accessing publications that users recognise and abide by the legal requirements associated with these rights.
Takedown policy
If you believe that this document breaches copyright please refer to the University of Manchester’s Takedown Procedures [http://man.ac.uk/04Y6Bo] or contact uml.scholarlycommunications@manchester.ac.uk providing relevant details, so we can investigate your claim.
Peer Review Only
Direct and indirect effects of CO2 increase on crop yield in West Africa
Journal: International Journal of Climatology Manuscript ID JOC-18-0528.R1
Wiley - Manuscript type: Research Article Date Submitted by the Author: n/a
Complete List of Authors: Sultan, Benjamin; Institut de recherche pour le developpement, ESPACE-DEV
Parkes, Ben; University of Manchester School of Mechanical Aerospace and Civil Engineering, MACE
Gaetani, Marco; Centre National de la Recherche Scientifique, LATMOS-IPSL
Keywords:
General circulation model experiments < 1. Tools and methods, Climate < 2. Scale, Rainfall < 3. Physical phenomenon, Monsson < 5.
Geographic/climatic zone, Agrometeorology < 6. Application/context Country Keywords: Burkina Faso, Cameroon, Senegal, Mali, Niger
Peer Review Only
Direct and indirect effects of CO2 increase on crop yield in West
1Africa
2Benjamin Sultan (1), Ben Parkes (2) and Marco Gaetani (3) 3
(1) ESPACE-DEV, Univ Montpellier, IRD, Univ Guyane, Univ Reunion, Univ Antilles, Univ Avignon, Maison de la Télédétection,
4
500 rue Jean-François Breton, F-34093 Montpellier Cedex, France
5
(2) MACE – Manchester, United Kingdom
6
(3) LATMOS/IPSL, CNRS, Sorbonne Université, Université Paris-Saclay, Paris, France
7 8 9
Abstract 10
Climate change directly threatens food security in West Africa through a negative impact on 11
productivity of the main staple food crops. However, providing consistent future crop yield 12
projections in the region remain challenging because of uncertainty in the response of the regional 13
climate to the CO2 increase and in the response of the cultivated crop to this altered climate with 14
more CO2 in the atmosphere. Here, we analyse a set of idealised climate simulations to investigate 15
the effect of CO2 concentration increase on the West African monsoon and potential impacts on 16
crop yields of maize. On the one hand, simulations with prescribed SST and quadrupled CO2 17
concentration are analysed to study the atmospheric response to direct radiative forcing induced by 18
increasing CO2 concentration, not mediated by ocean heat capacity. On the other hand, simulations 19
with prescribed SST augmented by 4 K are analysed to study the atmospheric response to the global 20
ocean warming expected as a consequence of the increasing CO2 radiative forcing. We show that if 21
CO2 concentration increase has a positive impact on crop yield due to the fertilisation effect, it also 22
has a direct effect on the monsoon which acts to increase (decrease) rainfall in the Eastern (Western) 23
part of the Sahel and increase (decrease) crop yields consequently. Finally, we show that SST 24
warming acts to reduce rainfall and increase local temperatures leading to strong reduction of crop 25
yield. The reduction of crop yield is more important in the Eastern part of the Sahel where the 26
warming is more intense than in the Western part of the Sahel. Overall, positive effects are weaker 27
and more uncertain than the negative effects in the analysed simulations. 28
Peer Review Only
30
1. Introduction 31
Sub-Saharan Africa is particularly vulnerable to climate change which directly threatens food security 32
of the rapidly growing population (IPCC 2014). Here, multiple environmental, political, and socio-33
economic stressors interact to increase the region’s susceptibility and limits its economic and 34
institutional capacity to cope with and adapt to climate variability and change (Connolly-Boutin and 35
Smit 2016; Müller et al. 2010; Challinor et al. 2007). Achieving food security in several African 36
countries will depend partly on the effective adaptation of agriculture to climate change, as crop 37
yields of major staple food crops in the Tropics are expected to decrease in a warmer climate 38
(Challinor et al. 2014). However, one of the limits of adaptation planning — such as breeding more 39
resilient crop varieties or promoting more resistant existing varieties and practices (Barnabás et al 40
2008)— is the high uncertainty in regional scenarios of crop production under climate change. 41
Indeed, although there are robust evidences of a decrease of crop production due to the global 42
warming (Challinor et al. 2014; Knox et al. 2012), the spread of crop yield responses remains very 43
large as found by Müller et al. (2010) which showed that projected impacts relative to current African 44
production levels range from −100% to +168%. Most of the uncertainty is led by the difficulty to 45
estimate the twofold effect of CO2 concentration increase, i.e. the response of the regional climate 46
to the CO2 increase and the response of the cultivated crop to this altered climate with more CO2 in 47
the atmosphere (Berg et al. 2013). Here we investigate those two effects of CO2 increase in West 48
Africa where crop yield is projected to decrease under global warming (Roudier et al. 2011) but also 49
where there are large discrepancies in future climate scenarios (Sultan and Gaetani 2016). The 50
variability of the West African climate during the 20th century has been deeply tied to the CO2 51
concentration increase, but the response of the regional atmospheric dynamics is particularly 52
complex and still debated (Gaetani et al. 2017). Indeed, the CO2 concentration increase has a 53
twofold and conflicting effect on the West African monsoon dynamics. Interestingly, whereas the 54
radiative forcing mediated by the Global Ocean warming weakens the monsoonal circulation, the 55
direct radiative forcing at the land surface acts locally to enhance precipitation (Gaetani et al. 2017). 56
Specifically, the Tropical Ocean warming heats the troposphere and imposes stability, reducing 57
moisture transport and deep convection over land, ultimately weakening the monsoonal circulations 58
(Held et al. 2005). Over land, CO2 radiative forcing leads to local increased evaporation and vertical 59
instability, resulting in enhanced precipitation (Giannini 2010). Climate variability in West Africa 60
during the 20th century was characterised by large variability, alternating wet periods with droughts 61
(Nicholson et al. 2017). After a devastating drought characterising the 70s and peaking in the mid-80s 62
(Held et al. 2005), West Africa experienced a recovery in summer monsoon precipitation during the 63
90s and at the turn of the 21st century (Fontaine et al. 2011). Dry anomalies were caused by the 64
weakening of the monsoonal circulation in West Africa, driven by the warming of the Tropical Ocean 65
(Giannini et al. 2003). The concomitant negative phase of the Atlantic Multidecadal Oscillation 66
(AMO), which reduced the boreal summer northward migration of the intertropical convergence 67
zone (ITCZ) and its associated rain belt, exacerbated the drying trend, resulting in a long lasting 68
drought (Mohino et al. 2011). Conversely, the recent precipitation recovery has been related to the 69
faster warming of the northern hemisphere, which favoured the northern displacement of the ITCZ 70
(Park et al. 2015), and to the local CO2 radiative forcing over land (Dong and Sutton 2016). In this 71
context, how the competing effects of ocean-mediated and local CO2 radiative forcing combine is 72
still unclear, and the likely further future increase in CO2 concentration casts uncertainties on the 73
rainfall projections for the 21st century (Biasutti 2013). 74
Rising CO2 concentration in the atmosphere has an impact of the cultivated crop through a direct 75
and an indirect effect. The direct effect is the potential of atmospheric CO2 to increase crop water 76
productivity by enhancing photosynthesis and reducing leaf-level transpiration of plants (Tubiello et 77
Peer Review Only
al. 2007; Leakey 2009; Deryng et al. 2016). Although the amplitude of this effect depends on the 78
region, the scale and the crop, most of the recent modelling studies found significant increases of 79
crop yield in West Africa due to elevated CO2 (Deryng et al., 2016; 2015; Sultan et al. 2014; Muller et 80
al. 2010). It is particularly true for C3 crops such as cotton (Gerardeaux et al. 2013). C4 crops such as 81
maize, sorghum or millet are less sensitive to atmospheric CO2 concentration however there are 82
impacts as a result of stomatal closure and soil moisture conservation (Leakey et al. 2009). The 83
indirect effect is the response of the crop to the altered climate due to atmospheric CO2 84
concentration increase. Most studies find yield losses under future climate scenarios (Sultan and 85
Gaetani 2016; Challinor et al. 2014; Roudier et al. 2011; Knox et al. 2012; Challinor et al. 2007; Kotir 86
2010; Müller et al. 2010), because of the adverse role of higher temperatures which reduce the crop 87
cycle duration and increase evapotranspiration (Schlenker and Lobell 2010; Roudier et al. 2011; Berg 88
et al. 2013; Sultan et al. 2013). Although uncertain, changes in rainfall modulate the spatial 89
distribution of climate change impacts on crop yields (Gaetani and Sultan 2016; Sultan et al. 2014). 90
Indeed, yields losses of millet and sorghum are particularly high in the western Sahel as a result of 91
the combination of warming and decreased precipitation at the beginning of the rainy season (Sultan 92
et al. 2014). In the central Sahel, temperature and precipitation operate in opposite directions— 93
warming causes yield loss whereas increased rainfall at the end of the rainy season is favourable for 94
growing millet and sorghum (Sultan et al. 2014). Thus, direct and indirect effects of rising 95
atmospheric CO2 act in a competing way with benefits of elevated levels of CO2 through increased 96
crop water productivity while resulting warmer mean temperatures are likely to lead to crop yield 97
losses. 98
Here, we use a set of idealised climate simulations of five climate models combined with a crop 99
model to investigate the effect of CO2 concentration increase on the West African monsoon and 100
potential impacts on maize yields. Maize is an important staple crop of West Africa and is grown 101
extensively in Burkina Faso, Mali, Niger and Nigeria. The climate model experimental set-up allows to 102
separate the direct local CO2 radiative forcing on the West African climate from the indirect forcing 103
mediated by global Sea Surface Temperature (SST). The aim of this study is to investigate how these 104
decoupled climate signals propagate through a crop model rather than producing realistic maize 105
simulations. In addition, the crop model experimental set-up allows to evaluate the potential of the 106
CO2 fertilisation effect on the crop water productivity in combination with the impacts of regional 107
climate change in West Africa. 108
In the next section we introduce the experimental set-up and the crop model (GLAM model) used in 109
this study. In section 3, we analyse the simulations by separating (i) the direct effect of CO2 increase 110
on crop and monsoon and (ii) the effect of SST warming on the regional climate and crop 111
productivity. Finally, in section 4, we discuss our conclusions. 112
2. Materials and Methods 113
2.1 AMIP Simulations
114
The competition between the SST-mediated and direct CO2 effect on the West African climate is 115
studied by analysing idealised numerical experiments from a set of five climate models selected in 116
the CMIP5 archive (Taylor et al. 2012) (see Table 1 for details on the models). Models are run in 117
atmospheric-only configuration, with observed SST and sea ice prescribed for the period 1979 to the 118
2008. The simulations take into account the observed evolution in the atmospheric composition 119
(including CO2), due to both anthropogenic and natural influences, and the changes in solar forcing, 120
emissions and concentrations of aerosols, and land use. This experimental set-up is used as the 121
control simulation (CTL) for two sensitivity experiments run either by prescribing uniform 4K increase 122
in global SST (4K experiment), or by quadrupling the CO2 atmospheric concentration while 123
Peer Review Only
maintaining the SST unchanged (4xCO2 experiment). The use of such an idealised design is intended 124
to isolate in a straightforward manner the climate responses to, respectively, the direct local CO2 125
radiative forcing and to the global SST increase, which would not be possible in ocean-atmosphere 126
coupled simulations. Indeed, in coupled simulations, direct and SST-mediated effects of CO2 forcing 127
on the climate system are mixed, and the competitive aspects of the CO2 influence on the West 128
African monsoon cannot be disentangled. Specifically, in the 4xCO2 experiment, the Global Ocean is 129
not allowed to warm and store heat, so that the climate system only responds to the local radiative 130
forcing on land surface induced by the quadrupling of the CO2 concentration (Fig.S1-S5 in 131
Supplementary Material). Conversely, by fixing CO2 concentration at present-day values and 132
increasing SST, the climate system only responds to the ocean surface warming, with no direct 133
forcing from increasing CO2 concentration (Fig.S6-S10 in Supplementary Material). The experimental 134
setup is described in detail in Taylor et al. (2012). Extreme idealised forcing is imposed in the 135
sensitivity experiments to magnify the response of the climate system to the global SST warming (in 136
4K), and to the local direct CO2 radiative forcing (in 4xCO2), respectively. These conditions are 137
comparable with the situation expected in 2100 in the RCP8.5 emission scenario (Riahi et al. 2011), 138
with the CO2 concentration augmented from 390 ppm in 2011 to more than 1000 ppm (more than 139
+260 %), and more than 3K global SST warming (IPCC 2014). Model selection is based on the 140
experiment availability, thus considering only models for which the three experiments (CTL, 4K and 141
4xCO2) are available. Moreover, the availability of daily data for the variables used to force the GLAM 142
model (see Section 2.2) represents a further constraint, leading to the final selection of the model 143
ensemble. Availability of multiple realisations is also limited (for the baseline experiment, 6 members 144
are respectively available for HadGEM2-A and IPSL-CM5A-LR, and 2 members for MIROC5; for 145
sensitivity experiments, 2 members are available for IPSL-CM5A-LR and IPSL-CM5B-LR, respectively). 146
Therefore, one realisation of each experiment is used for each model, not to bias the results toward 147
models for which more realisations are available. However, the analysis of precipitation and 148
temperature outputs from HadGEM2-A and IPSL-CM5A-LR shows that idealised perturbations in the 149
sensitivity experiments are large enough to overcome model internal variability (not shown), and 150
choosing different realisations for baseline and sensitivity experiments would not change the 151
conclusions of the paper. The selected models correctly simulate all the main features of the 152
monsoonal dynamics, although the comparison with observational and reanalysis products shows 153
some biases (see Supplementary Material in Gaetani et al. 2017). Particularly, HadGEM2-A and IPSL-154
CM5B-LR simulate a significant weaker monsoon, while MIROC5 is affected by significant wet biases. 155
Specific analysis of these biases is beyond the scope of the paper. However, biases in model 156
simulation of the West African monsoon are related to the coarse resolution, which limit the model 157
ability in producing intense and organised convective systems (Vellinga et al. 2015), to the poor 158
representation of the global SST teleconnections (Rowell 2013). The differences in grid resolution 159
among models are harmonised by using a first-order conservative remapping to regrid all the 160
datasets to a 1° regular grid. Although caution should be used when regridding the coarse resolution 161
of the IPSL models to 1°, we consider this choice an appropriate compromise to conserve climate 162
model information and respond to the crop model needs. Finally, we highlight that the purpose of 163
this study is to analyse the sensitivity of crop yield to idealised conditions representing the 164
competing effects of the CO2 concentration increase, rather than a realistic productivity assessment. 165
2.2 GLAM Simulations
166
GLAM is the Global Large Area Model for annual crops (Challinor, et al. 2004). GLAM is a process-167
based model that was developed for use with climate scale data. GLAM requires soil data, a crop 168
parameter set and meteorological inputs. The soil data is derived from the Digital Soil Map of the 169
World and gridded to the meteorological data grid. The planting dates for the crops were derived 170
from the Global Gridded Crop Model Intercomparison project dates for maize (Elliott et al 2015). 171
Peer Review Only
GLAM runs are performed at 1° regular grid resolution using climate simulations outputs as 172
meteorological inputs. These inputs are maximum daily temperature, minimum daily temperature, 173
downwelling shortwave radiation at the surface and precipitation. The maize parameter set is 174
identical to the one used in Parkes, et al. (2018) and based on the parameter set used in Vermulen et 175
al. (2013). In this study GLAM was run with an idealised crop where the yield gap parameter is set to 176
1 instead of being calibrated to observed crop yields (Challinor, et al. 2015 Parkes, et al. 2015). We 177
are using a maize parameterisation that is idealised in that we are not attempting to replicate 178
observed yields but instead are simulating the theoretical maximum yield value for a crop in those 179
circumstances. This removes the effects of pest/diseases and management techniques. This method 180
was selected to show the meteorological signals consistently across the domain. GLAM uses a 181
triangular profile to determine growth at a given temperature. For these simulations the base, 182
optimum and maximum temperature were set at 8, 34 and 44 C respectively. If the mean daily 183
temperature is above the optimum temperature then reduced growth is expected. A high 184
temperature stress routine is also used and can further reduce yields if temperatures are above 37 C 185
during flowering. The high temperature stress routine is described fully in Challinor et al (2005). 186
187
Carbon dioxide fertilisation in C4 crops is less significant than in C3 crops. However, C4 crops do 188
respond to carbon dioxide fertilisation due to stomatal closure and conservation of soil moisture. The 189
relationship between transpiration efficiency and carbon dioxide fraction for C4 grasses increases to 190
a maximum before levelling off. The increased transpiration efficiency values are based on response 191
ratio of the transpiration efficiency to carbon dioxide for water limited maize in GLAM generated by 192
Julian Ramirez-Villegas (personal communication, 2015). The curve of this relationship was modelled 193
using a negative square term to find the maximum transpiration efficiency. This maximum is at 850 194
ppm CO2 and results in a transpiration efficiency of 11.06 pa (from 6.5 pa). In addition, the maximum 195
transpiration efficiency was increased from 9.0 g/kg to 15.31 g/kg where the fractional increase in 196
transpiration efficiency (pa) is maintained for the increase in maximum transpiration efficiency (kg). 197
198 199
2.3 The six scenarios
200
Six scenarios are used in this study to investigate the role of CO2 concentration increase on crop yield 201
in West Africa (Table 2): 202
203
• The control scenario (t0c1f1): Here GLAM runs are performed using climate inputs from the most 204
realistic configuration of a set of climate models forced with observed SST and sea ice prescribed 205
for the period 1979 to the 2008 which takes into account anthropogenic and natural influences. 206
It allows to have a realistic climate forcing as a baseline to further sensitivity experiments. 207
208
• The scenario with fertilisation effect of CO2 on the crop (t0c1f4): Here GLAM runs are performed
209
using baseline climate but the crop is experiencing four times higher levels of CO2 concentration 210
which increase transpiration efficiency in the GLAM model and thus increase crop yield. When 211
compared to the control scenario, this simulation gives the fertilising effect of CO2 increase on 212
crop yield in the GLAM model for unchanged climate conditions. 213
214
• The warmer climate scenario with no effect of CO2 on the crop transpiration (t4c1f1): Here GLAM 215
runs are performed using the +4K climate conditions and atmospheric CO2 concentration is 216
similar to the control scenario. When compared to the control scenario, this simulation allows to 217
point out the impact on crop yield of the climate system response to the global SST warming. 218
219
• The warmer climate scenario with effect of C02 on the crop transpiration (t4c1f4): Here GLAM
220
runs are performed using the same +4K climate conditions as in t4c1f1 but the crop is 221
experiencing four times higher levels of CO2 concentration which increase transpiration 222
Peer Review Only
efficiency in the GLAM model. When compared to the control scenario, this simulation gives the 223
combined effects of warmer climate and increase of transpiration efficiency on crop yield in the 224
GLAM model. 225
226
• The direct CO2 effect on the monsoon with no effect of CO2 on the crop transpiration (t0c4f1): 227
Here GLAM runs are performed using climate conditions responding to the quadrupling of CO2 228
concentration while SST is unchanged, and CO2 concentration remains unchanged compared to 229
the control scenario. When compared to the control scenario, this experiment allows to isolate 230
the impact on crop yield of the response of the monsoon to the local direct CO2 radiative forcing. 231
232
• The direct CO2 effect on the monsoon added to the effect of CO2 on the crop transpiration
233
(t0c4f4): Here GLAM runs are performed using climate conditions responding to quadrupled CO2
234
concentration and crop is experiencing four times higher levels of CO2 concentration which 235
increase transpiration efficiency in the GLAM model. When compared to the control scenario, 236
this experiment simulates the combined effects of the CO2 increase on the monsoons dynamics 237
and on the transpiration efficiency. 238
239
3. Results 240
3.1. The control simulation
241
The control simulation reveals important differences in total rainfall and mean temperatures 242
between the five climate models (Table 3). In particular, HadGEM2 simulates the lowest annual 243
precipitation value (461 mm/year) while the MIROC5 model is the wettest (671 mm/year) and the 244
hottest model (29.1C). Even if climate models are forced with observed SST and are thus likely more 245
realistic than coupled model simulations, there are still important biases compared to observations 246
in the control run. Indeed all models are too dry and too hot compared to annual rainfall and mean 247
temperature computed using the reference WFDEI dataset (707 mm/year and 27.1C respectively). As 248
a result of these important differences between climate models, the simulated yield varies strongly 249
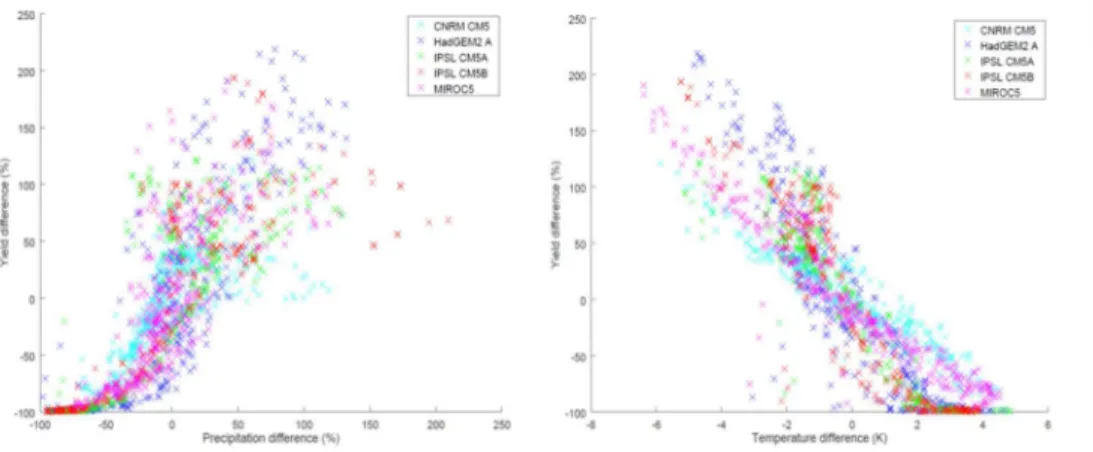
from one model to another since yield is highly sensitive to rainfall and temperature variations 250
(Figure 1). In the GLAM crop model, crop yield increases as total rainfall amount during the growing 251
season increases, following an exponential fit, until reaching values where the water constraint is not 252
limiting anymore. Simulated potential crop yield follows a more linear fit with temperature and 253
shows a decrease of crop yield as temperature decreases. As a result, the HadGEM2 model has the 254
lowest mean yield because of its low annual rainfall compared to the four other models. 255
3.2. The direct effect of CO2 increase on crop and monsoon
256
Elevated concentration of CO2 in the GLAM crop model under the control climate (t0c1f4 simulation) 257
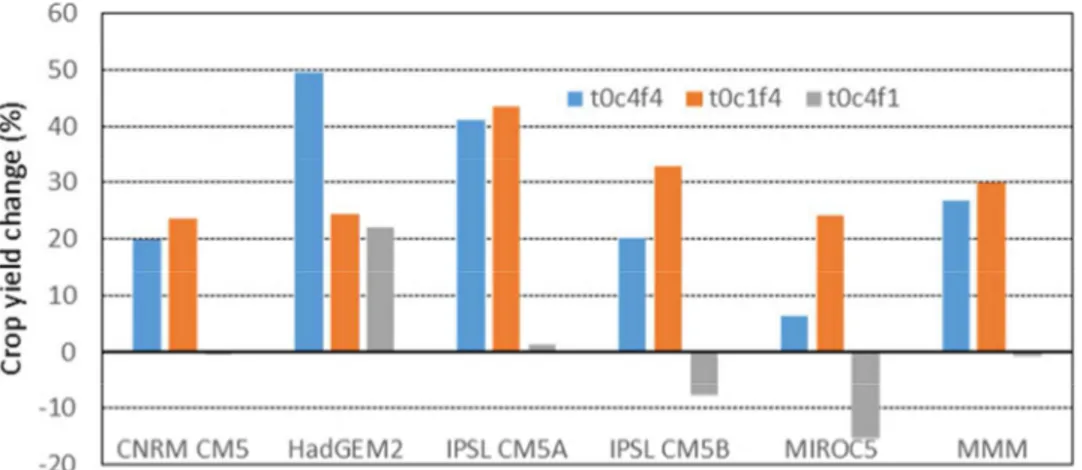
has a clear positive effect on crop yield (red bars in Figure 2). The multi-model mean shows an 258
increase of +26.79% of simulated potential crop yield compared to the control simulation (t0c1f1 259
simulation) when aggregating results over whole West Africa. This crop yield increase is found using 260
any of the five climate models although the amplitude of the yield gain varies across the models. The 261
yield increase exceeds 40% using the IPSL CM5A model while it less than 23% using the CNRM CM5 262
model. The CO2 fertilisation effect is linked to the water stress and therefore it can explain why the 263
responses are model dependent. 264
An increase of atmospheric CO2 concentration has also a direct effect on the monsoon which has in 265
turn an impact on simulated potential crop yields. The t0c4f1 simulation isolates this effect by 266
removing the fertilisation effect on the crop model. When aggregating results over whole West 267
Africa, the multi-model mean shows a very weak response of crop yields (-0.67%) which mainly result 268
from a high dispersion across the response of individual models (grey bars in Figure 2). Indeed, the 269
monsoon effect can lead to yield gain of about 22% using the HadGEM2 model while it results to a 270
Peer Review Only
yield loss of more than 15% in the MIROC5 model. This yield response is mainly driven by the rainfall 271
change in the model with elevated levels of CO2 (Figure 3; Table 4). The HadGEM2 model is highly 272
sensitive to atmospheric CO2 increase which produces more rainfall (+19.82%) while the same CO2 273
increase lead to a reduction of rainfall of about 2% in the MIROC model. In average over West Africa, 274
there is a positive linear relationship between rainfall changes and yield changes between the t0c4f1 275
simulation and the control t0c1f1 simulation (R²=0.98; Figure 3). 276
The combination of the direct effect of CO2 increase on the crop and on the monsoon (t0c4f4
277
simulation) leads to a large increase of simulated crop yields (+26.79%) over West Africa in the multi-278
model mean (Figure 2). It indicates that the fertilisation effect on the crop dominates the yield 279
response rather than the effect of the monsoon. However individual model runs show that the 280
monsoon effect can largely modulate the fertilisation effect (blue bars in Figure 2). The benefits of 281
the fertilisation effect are almost cancelled in the MIROC model (24,04% in t0c1f4 simulation and 282
6,39% in t0c4f4 simulation) which simulates a decrease of rainfall with the CO2 increase. On the 283
opposite, the benefits are doubled in the HadGEM2 model (24,45% in t0c1f4 simulation and 49,68% 284
in t0c4f4 simulation) which simulates more rains with the CO2 increase. 285
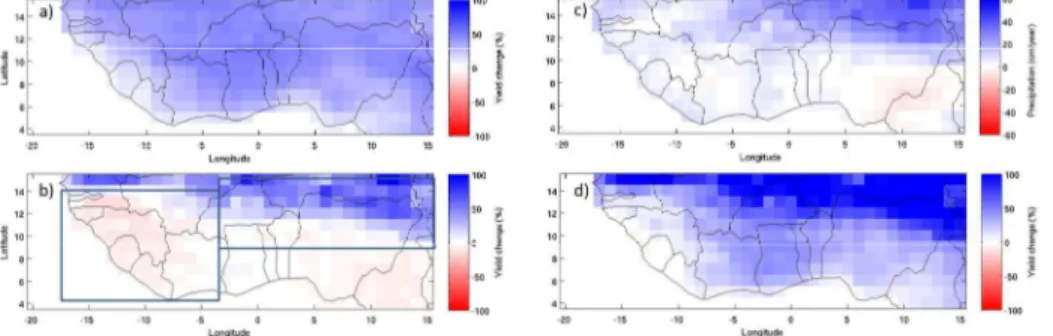
The spatial patterns of yield change due to CO2 increase show some important regional disparities 286
(Figure 4). Although the yield increase due to the CO2 fertilisation effect (Figure 4a) is widespread 287
over the Soudano-Sahelian zone, it is slightly less important in the North where water stress is too 288
high for being compensated by the CO2 increase. The CO2 fertilisation effect is also reduced in the 289
wettest areas along the Guinean coast and in southern Atlantic coast where on the opposite there is 290
no water stress and thus where the crop cannot benefit from the reduction of transpiration expected 291
by the CO2 atmospheric concentration increase. In Figure 4b, yield change is driven by the effect of 292
CO2 on the monsoon without taking into account the fertilisation effect (t0c4f0 simulation). The 293
spatial pattern opposes the western part of West Africa and to a less extent the Guinean Coast where 294
potential crop yield losses are expected with the Central Sahel where crop yield gains are expected. 295
When averaging across West Sahel and East Sahel boxes (see Figure 4b for the localisation of the 296
boxes), we can see that the direct effect of the monsoon leads to potential crop yield losses in the 297
West Sahel (-5.27%) and to yield increases in East Sahel (+12.07%). It is highly variable across model 298
and the response depends on rainfall change (Table 5). This spatial pattern is very close to the 299
precipitation change due to CO2 increase effect on the monsoon (Figure 4c). Gaetani et al. (2017) 300
shows that the response of the WAM precipitation to the quadrupling of the CO2 concentration is 301
the northward migration of the precipitation belt, driven by the intensification of the meridional 302
energy gradient across West Africa, and resulting in positive (negative) precipitation anomalies in the 303
Sahel (Guinean coast). The positive precipitation anomalies in the Sahel are also modulated along the 304
zonal direction, being stronger to the east than to the west (see Figure 2 in Gaetani et al. 2017). This 305
feature is associated with an anomalous zonal cell triggered by strengthened convection over West 306
Africa, which connects with subsidence over Tropical Atlantic. This results in a quasi-zonal anomaly in 307
the monsoonal flow, which favours moisture convergence in central-eastern Sahel (see Figures 4 and 308
8 in Gaetani et al. 2017). Precipitation patterns in model responses to quadrupled CO2 concentration 309
are then produced by the combination of the circulation response in the zonal and meridional 310
directions, which is in turn driven by the model regional response to the CO2 forcing. When we 311
combine the direct effect of CO2 increase on the crop and on the monsoon (t0c4f1 simulation), yield 312
is increasing almost everywhere in West Africa (Figure 4d) except in Western part of the Sahel where 313
the reduction of rainfall induced by the CO2 increase dominates the yield benefit of the fertilisation 314
effect. 315
3.3. The effect of SST warming
Peer Review Only
A warmer ocean (+4K increased SSTs in the t4c1f1 experiment) leads to particularly detrimental 317
climate conditions for the crop (Figure 5; Table 6). An important warming is simulated in West Africa 318
with annual temperatures changes ranging between 4K and 5K in the coastal areas of the Atlantic 319
Ocean and reaching +6K, up to +7K in the more continental areas (Figure 5a). The multi-model mean 320
shows that the +4K warming of SSTs leads to a +5.54K local growing season warming in average over 321
West Africa (Table 6). A warmer ocean induces a reduction of rainfall all over West Africa (-18.97% in 322
average) except in the North Eastern part of the Sahel (Niger) where rainfall increases. The rainfall 323
deficit is particularly important in South West Sahel in Senegal, Gambia and Guinea-Bissau where a 324
reduction of rainfall greater than 40% is simulated in the t4c1f1 experiment (see also Gaetani et al. 325
2017). 326
These warm and dry conditions lead to large potential crop yield losses (Figure 6; Table 6) 327
everywhere in West Africa. The multi-model mean shows that a +4K warming of SSTs leads to a 328
reduction of 56% of crop yield in average over West Africa and a shortening of the crop season 329
duration of 9 days. This reduction is only partly (-40.89%) compensated by the fertilisation effect of 330
CO2. 331
It is interesting that even if the rainfall deficit is the greatest in the Western part of the Sahel, yield 332
loss is more pronounced in the Eastern part of the Sahel when averaged simulations over the same 333
West and East boxes shown in Figure 4 (Table 7). The reduction of the potential yield is the most 334
important in the East Sahel (-69.8%) and slightly hampered by CO2 fertilisation effect (-54.7% of crop 335
yield loss). The yield loss is less important in the West Sahel reaching -52.6% without taking into 336
account CO2 effect on crop and -38.6% with the CO2 fertilisation effect. Simulations show that if the 337
monsoon rains are more affected in the Western Sahel (a reduction of 12 days and more than 25% of 338
the rainfall) than in the Eastern Sahel (a reduction of 3 days and about 16% of rainfall), the warming 339
is more important in the East Sahel (+5.9K against 5.4K in the West Sahel). With such levels of 340
warming, temperatures changes drive the yield variability in the crop model as illustrated by Figure 7 341
which depicts a linear relationship between temperatures and yield changes in the simulations. It 342
might explain why even if the monsoon rainfall is less affected in the East Sahel, the impact on crop 343
yield is more important since the warming is more intense. 344
4. Conclusion 345
Rising CO2 concentration in the atmosphere leads to two opposite effects on potential crop yield in 346
West Africa. On one hand, benefits could be expected through an increase of rainfall driven by the 347
direct effect of CO2 radiative forcing on the monsoonal dynamics. Our simulations showed that, 348
without increase of temperature, positive impacts will be more likely in Central and East Sahel where 349
annual rainfall are strongly enhanced by elevated levels of CO2. Indeed, monsoonal precipitation in 350
West Africa responds to increasing CO2 concentration migrating northwards to the Sahel, driven by 351
the strengthened energy meridional gradient associated with the CO2 radiative forcing over land. 352
Enhanced deep convection triggers an anomalous zonal cell which intensifies the westerly moisture 353
flow from the tropical Atlantic, resulting in a wetter response in central-eastern Sahel (Gaetani et al. 354
2017). Yield gains are also expected through the CO2 fertilisation effect which act to reduce crop 355
transpiration in the crop model and thus increase drought resistance. Although the amplitude of the 356
expected benefits of the CO2 fertilisation is certainly crop model dependent and still debated in the 357
literature (Deryng et al. 2016), we found that they are far greater than those expected from the 358
direct effect on the monsoon. In the Central East Sahel for instance, our simulations showed an 359
increase of +43.5% of crop yield with the fertilisation effect against a yield gain of +12.1% due to the 360
rainfall increase. On the other hand, negative impacts are expected from the elevation of 361
temperatures. Detrimental conditions for the crop were obtained by warming up the ocean of +4K 362
leading to drought conditions in the Western part of the Sahel and to an increase mean surface 363
Peer Review Only
temperature of more than +5.5K in West Africa with particularly warm conditions in continental 364
regions. This warming could lead to yield loss of more than 56% which can only be partly hampered 365
by the fertilisation effect (-40.9% of yield loss by taking into account the fertilisation effect). 366
With such competing effects, which are not always additive, providing reliable climate change 367
impacts scenarios on crop yields is challenging. The differences between climate models in the 368
estimation of the effects of direct and SST-mediated effects of CO2 were found to be very large with 369
for instance the HadGEM2 model simulating an increase of +49.7% of the yield through the increase 370
of rainfall (t0c4f4 simulations) and a decrease of -56.1% with the increase of temperatures (t4c1f4). 371
Overall we found that positive effects in the analysed simulations are weaker and more uncertain 372
than the negative effects. Indeed, simulated positive effects on crop yield range from +6.4% using the 373
MIROC5 model to +49.7% in the HadGEM2 model while the negative effects range from 51.7% to -374
62.9% using the same two climate models respectively. We also found that temperatures increase 375
will likely have a more important impacts on crop yield than rainfall changes as shown in previous 376
studies (Schlenker and Lobell 2010; Roudier et al. 2011; Berg et al. 2013; Sultan et al. 2013). We 377
highlight that, by construction, the idealised simulations analysed in this paper do not account for 378
climate feedbacks to the increasing CO2 concentration. In particular, the global SST response to CO2 379
forcing in past and future climate simulations is far from the homogeneous warming prescribed in 380
the 4K experiment, and this may lead to different results for the monsoonal dynamics and crop 381
productivity. For instance, it has been shown that, in the presence of overall global ocean warming, 382
while the warming of the Tropical belt inhibits precipitation in West Africa, the differential warming 383
of the Northern Hemisphere, and in particular of the North Atlantic and Mediterranean, is favourable 384
to rainfall (Giannini et al. 2013; Park et al. 2014; Park et al. 2016). Ocean-atmosphere coupled 385
simulations of future climate in West Africa include all the climate feedbacks, so that the 386
uncertainties in AMIP idealised simulations discussed in this paper are exacerbated, undermining 387
mitigation and adaptation strategies in the region. Whereby in AMIP simulations the responses to an 388
idealised forcing are concordant, though different in amplitude, coupled model simulations for the 389
end of the 21st century range from dry to very wet projections, characterised by spatial 390
inhomogeneity (Monerie et al. 2017). Coupled climate models are generally skilful in simulating the 391
relationship between the regional atmospheric dynamics and the Sahelian rainfall (Biasutti et al. 392
2009), while SST teleconnections are poorly simulated (Rowell 2013), mainly because of the model 393
biases in simulating ocean dynamics (Roehrig et al. 2013). Moreover, coupled climate simulations are 394
generally performed not considering dynamic vegetation and land use, which are instead key 395
ingredients of the monsoonal dynamics (Koster et al. 2004). Fixing model shortcomings and 396
improving model design should be then prioritised in the next CMIP6 exercise (Eyring et al. 2016). 397
Every modelling study has its limitations and we recognize some caveats in our experiments. First of 398
all, we use a limited number of GCMs (only five) within the full list of models participating to the 399
CMIP5 exercise (more than 30). If different results with different or with more models are still 400
possible, Gaetani et al. (2017) showed a general agreement among models in their response to the 401
idealized conditions, which demonstrates the robustness of the mechanisms linking the WAM 402
dynamics to the SST and CO2 idealized forcings, whatever the model physics or performance. 403
Another limitation is the use of only one ensemble member from each GCM which does not ensure 404
that most of the plausible scenarios are captured. However, we are here critically limited by the 405
availability of ensemble members in the CMIP5 archive, which does not allow to perform a full 406
exhaustive analysis of the internal variability within each GCM. Finally, a caution is necessary when 407
interpreting the crop simulation results presented in this study. Crop yields results have to be 408
interpreted as potential crop yield response to two aspects of climate change on the crops grown in 409
West Africa, i.e. the increase in temperatures and the increase in atmospheric carbon dioxide levels, 410
and not as a realistic crop yield prediction for the future. The crop model is simulating potential 411
Peer Review Only
yields, without calibration. The parameter set is the same as the one used in Parkes et al. (2018), this 412
includes the high temperature stress routine. This routine reduces crop yields as a result of high 413
temperature stress during flowering. The potential yields are much higher than real yields and 414
therefore the magnitude of reductions in yield as a result of high temperature stress is expected to 415
be higher than for calibrated crops. This is expected to reduce the yields in the t4c1f1 and t4c1f4 416
experiments and may lead to an overestimate of the impact of increased temperatures. 417
Acknowledgements 418
M.G. has been supported by the LABEX project, funded by Agence Nationale de la Recherche (French 419
National Research Agency, Grant ANR-10-LABX-18-01). The research leading to these results has 420
received funding from the European Union Seventh Framework Programme FP7/2007-2013 under 421
grant agreement no 603864. (HELIX: High-End cLimate Impacts and eXtremes; 422 http://www.helixclimate.eu). 423 424 References 425
Barnabás B, Jäger K and Fehér A 2008 The effect of drought and heat stress on reproductive 426
processes in cereals Plant Cell Environ. 31 11–38 427
Berg, A., de Noblet-Ducoudre, N., Sultan, B., Lengaigne, M., and Guimberteau, M. (2013). Projections 428
of climate change impacts on potential C4 crop productivity over tropical regions. Agric. For. 429
Meteorol. 170, 89–102. doi: 10.1016/j.agrformet.2011.12.003
430
Biasutti M (2013) Forced Sahel rainfall trends in the CMIP5 archive. J Geophys Res Atmos 118:1613– 431
1623. doi:10.1002/jgrd.50206 432
Biasutti M, Sobel AH, Camargo SJ (2009) The role of the Sahara low in summertime Sahel rainfall 433
variability and change in the CMIP3 models. J Clim 22:5755–5771. doi:10.1175/2009JCLI2969.1 434
Challinor, A. J., Parkes, B., and Ramirez-Villegas, J.: Crop yield response to climate change varies with 435
cropping intensity, Global Change Biology, 21, 1679–1688, DOI:10.1111/gcb.12808, 2015. 436
Challinor, A. J., Wheeler, T., Craufurd, P., and Slingo, J.: Simulation of the impact of high temperature 437
stress on annual crop yields, Agr. Forest Meteorol., 135, 180–189, 438
DOI:10.1016/j.agrformet.2005.11.015, 2005 439
Challinor, A. J., Watson, J., Lobell, D. B., Howden, S. M., Smith, D. R., and Chhetri, N. (2014). A meta- 440
analysis of crop yield under climate change and adaptation. Nat. Clim. Change 4, 287–291. doi: 441
10.1038/nclimate2153 442
Challinor, A., Wheeler, T., Craufurd, P., Slingo, J., and Grimes, D.: Design and optimisation of a large-443
area process-based model for annual crops, Agricultural and Forest Meteorology, 124, 99 – 120, 444
DOI:10.1016/j.agrformet.2004.01.002, 2004. 445
Challinor, A., Wheeler, T., Garforth, C., Craufurd, P., and Kassam, A. (2007). Assessing the 446
vulnerability of food crop systems in Africa to climate change. Clim. Change 83, 381–399. doi: 447
10.1007/s10584-007-9249-0 448
Connolly-Boutin, L. and Smit, B. (2016). Climate change, food security, and livelihoods in sub-Saharan 449
Africa. Regional Environmental Change, 16: 385-399. 450
Deryng, D. (2015). Climate Change Impacts on Crop Productivity in Global Semi-Arid Areas and 451
Selected Semi-Arid Economies. Small Grant Programme Working Paper, Overseas Development 452
Peer Review Only
Institute (ODI), London. Available online at: http://prise.odi.org/research/small-grants-programme-453
climate-change-impacts-on-crop-productivity-in-global-semi-arid-areas-and-selected-semi-arid-454
economies/ 455
Deryng, D., Elliott, J., Folberth, C., Müller, C., Pugh, T. A. M., Boote, K. J., et al. (2016). Regional 456
disparities in the beneficial effects of rising CO2 concentrations on crop water productivity. Nat. Clim.
457
Change 6, 786–790. doi: 10.1038/nclimate2995 458
Dong, B., and Sutton, R. (2015). Dominant role of greenhouse-gas forcing in the recovery of Sahel 459
rainfall. Nat. Clim. Change 5, 757–760. doi: 10.1038/nclimate2664 460
Elliott, J., Müller, C., Deryng, D., Chryssanthacopoulos, J., Boote, K. J., Büchner, M., Foster, I., Glotter, 461
M., Heinke, J., Iizumi, T., Izaurralde, R. C., Mueller, N. D., Ray, D. K., Rosenzweig, C., Ruane, A. C., and 462
Sheffield, J.: The Global Gridded Crop Model Intercomparison: data and modeling protocols for Phase 463
1 (v1.0), Geosci. Model Dev., 8, 261–277, https://doi.org/10.5194/gmd-8-261-2015, 2015 464
Eyring, V., Bony, S., Meehl, G. A., Senior, C. A., Stevens, B., Stouffer, R. J., and Taylor, K. E.: Overview 465
of the Coupled Model Intercomparison Project Phase 6 (CMIP6) experimental design and 466
organization, Geosci. Model Dev., 9, 1937-1958, https://doi.org/10.5194/gmd-9-1937-2016, 2016. 467
Fontaine B., P. Roucou, M. Gaetani, R. Marteau, 2011: Recent changes in precipitation, ITCZ 468
convection and northern tropical circulation over North Africa (1979-2007). International Journal of 469
Climatology, 31, 633-648, doi: 10.1002/joc.2108. 470
Gaetani M., C. Flamant, S. Bastin, S. Janicot, C. Lavaysse, F. Hourdin, P. Braconnot, S. Bony, 2017: 471
West African Monsoon dynamics and precipitation: the competition between global SST warming 472
and CO2 increase in CMIP5 idealized simulations. Climate Dynamics, 48, 1353-1373, doi: 473
10.1007/s00382-016-3146-z. 474
Gerardeaux, E., Sultan, B., Palai, O., Guiziou, C., Oettli, P., and Naudin, K. (2013). Positive effect of 475
climate change on cotton in 2050 by CO2 enrichment and conservation agriculture in
476
Cameroon. Agron. Sustain. Dev. 33, 485–495. doi: 10.1007/s13593-012-0119-4 477
Giannini A (2010) Mechanisms of climate change in the Semiarid African Sahel: the local view. J Clim 478
23:743–756. doi:10.1175/2009JCLI3123.1 479
Giannini A, Saravanan R, Chang P (2003) Oceanic forcing of Sahel rainfall on interannual to 480
interdecadal time scales. Science 302:1027–1030. doi:10.1126/science.1089357 481
Giannini, A., S. Salack, T. Lodoun, A. Ali, A. T. Gaye, and O. Ndiaye (2013), A unifying view of climate 482
change in the Sahel linking intra-seasonal, interannual and longer time scales, Environ. Res. Lett., 8 483
024010. 484
Held, I. M., T. L. Delworth, J. Lu, K. L. Findell, and T. R. Knutson (2005), Simulation of Sahel drought in 485
the 20th and 21st centuries., Proc. Natl. Acad. Sci. U. S. A., 102, 17891–17896, doi: 486
10.1073/pnas.0509057102. 487
IPCC (2014). “Climate change 2014: synthesis report,” in Contribution of Working Groups I, II and III to 488
the Fifth Assessment Report of the Intergovernmental Panel on Climate Change, eds Core Writing
489
Team, R. K. Pachauri, and L. A. Meyer (Geneva: IPCC), 151. 490
Knox, J., Hess, T., Daccache, A., and Wheeler, T. (2012). Climate change impacts on crop productivity 491
in Africa and South Asia. Environ. Res. Lett. 7:034032. doi: 10.1088/1748-9326/7/3/034032 492
Peer Review Only
Koster RD et al (2004) Regions of strong coupling between soil moisture and precipitation. Science 493
305:1138–1140 494
Kotir, J. H. (2010). Climate change and variability in Sub-Saharan Africa: a review of current and 495
future trends and impacts on agriculture and food security. Environ. Dev. Sustain. 13, 587–605. doi: 496
10.1007/s10668-010-9278-0 497
Leakey, A. D. B. (2009). Rising atmospheric carbon dioxide concentration and the future of C4 crops 498
for food and fuel. Proc. R. Soc. B. 276, 2333–2343. doi: 10.1098/rspb.2008.1517 499
Mohino E, Janicot S, Bader J (2011) Sahel rainfall and decadal to multi-decadal sea surface 500
Temperature variability. Clim Dyn 37:419–440. doi: 10.1007/s00382-010-0867-2. 501
Monerie, PA., Sanchez-Gomez, E. & Boé, J. Clim Dyn (2017) 48: 2751. 502
https://doi.org/10.1007/s00382-016-3236-y 503
Müller, C., Bondeau, A., Popp, A., Waha, K., and Fader, M. (2010). Climate Change Impacts on 504
Agricultural Yields. Background note to the World Development Report 2010, Potsdam Institute for
505
Climate Impact Research. 506
Park, J. et al. (2016) Anthropogenic Mediterranean warming essential driver for present and future 507
Sahel rainfall, Nature Climate Change, doi: 10.1038/nclimate3065. 508
Park, J.Y., Bader, J., and Matei, D. (2014). Northern-hemispheric differential warming is the key to 509
understanding the discrepancies in the projected Sahel rainfall. Nat. Commun. 6, 5985. 510
doi:10.1038/ncomms6985 511
Parkes, B., Challinor, A., and Nicklin, K.: Crop failure rates in a geoengineered climate: impact of 512
climate change and marine cloud brightening, Environmental Research Letters, 10, 084 003, 2015. 513
Parkes, B., Defrance, D., Sultan, B., Ciais, P., and Wang, X. (2018) Projected changes in crop yield 514
mean and variability over West Africa in a world 1.5 K warmer than the pre-industrial era. Earth Syst. 515
Dynam., 9, 119-134, https://doi.org/10.5194/esd-9-119-2018 516
Riahi, K., Rao, S., Krey, V., et al. (2011) RCP 8.5—A Scenario of Comparatively High Greenhouse Gas 517
Emissions. Climatic Change, 109, 33-57. https://doi.org/10.1007/s10584-011-0149-y 518
Roehrig R, Bouniol D, Guichard F, Hourdin FD, Redelsperger JL (2013) The present and future of the 519
West African monsoon: a process-oriented assessment of CMIP5 simulations along the AMMA 520
transect. J Clim 26:6471–6505. doi:10.1175/JCLI-D-12-00505.1 521
Roudier, P., Sultan, S., Quirion, P., and Berg, A. (2011). The impact of future climate change on West 522
African crop yields: what does the recent literature say? Glob. Environ. Change 21, 1073–1083. doi: 523
10.1016/j.gloenvcha.2011.04.007 524
Rowell DP (2013) Simulating SST teleconnections to Africa: what is the state of the art? J Clim 525
26:5397–5418. doi:10.1175/JCLI-D-12-00761.1 526
Schlenker, W., and Lobell, D. B. (2010). Robust negative impacts of climate change on African 527
agriculture. Environ. Res. Lett. 5, 1–8. doi: 10.1088/1748-9326/5/1/014010 528
Sharon E. Nicholson, Chris Funk, Andreas H. Fink, Rainfall over the African continent from the 19th 529
through the 21st century, Global and Planetary Change, 2017, ISSN 0921-8181, 530
https://doi.org/10.1016/j.gloplacha.2017.12.014. 531
Peer Review Only
Sultan B and Gaetani M (2016). Agriculture in West Africa in the Twenty-first Century: climate change 532
and impacts scenarios, and potential for adaptation. Front. Plant Sci. 7:1262. doi: 533
10.3389/fpls.2016.01262 534
Sultan, B., Guan, K., Kouressy, M., Biasutti, M., Piani, C., Hammer, G. L., et al. (2014). Robust features 535
of future climate change impacts on sorghum yields in West Africa. Environ. Res. Lett. 9. doi: 536
10.1088/1748-9326/9/10/104006 537
Sultan, B., Roudier, P., Quirion, P., Alhassane, A., Muller, B., Dingkuhn, M., et al. (2013). Assessing 538
climate change impacts on sorghum and millet yields in the Sudanian and Sahelian savannas of West 539
Africa. Environ. Res. Lett. 8:014040. doi: 10.1088/1748-9326/8/1/014040 540
Taylor, K. E., Stouffer, R. J., and Meehl, G. A. (2012). An overview of CMIP5 and the experiment 541
design. Bull. Am. Meteorol. Soc. 93, 485–498. doi: 10.1175/BAMS-D-11-00094.1 542
Tubiello, F. N., Soussana, J. F., and Howden, M. (2007). Crop and pasture response to climate 543
change, Proc. Natl Acad. Sci. U.S.A. 104, 19686–19690. doi: 10.1073/pnas.0701728104 544
Vellinga, M., M. Roberts, P. L. Vidale, M. S. Mizielinski, M.-E. Demory, R. Schiemann, J. Strachan, and 545
C. Bain (2015), Sahel decadal rainfall variability and the role of model horizontal resolution, Geophys. 546
Res. Lett., 42, doi:10.1002/2015GL066690 547
Vermeulen, Sonja J., Andrew J. Challinor, Philip K. Thornton, Bruce M. Campbell, Nishadi Eriyagama, 548
Joost M. Vervoort, James Kinyangi, Andy Jarvis, Peter Läderach, Julian Ramirez-Villegas, Kathryn J. 549
Nicklin, Ed Hawkins, Daniel R. Smith (2013) Addressing uncertainty in adaptation planning for 550
agriculture, Proc. Natl Acad. Sci, May 2013, 110 (21) 8357-8362; DOI: 10.1073/pnas.1219441110 551
Peer Review Only
553 554 555 556
Peer Review Only
Table 1: Models analysed. CMIP5 model information and outputs are available through the Earth System Grid Federation archive (http://cmip-pcmdi.llnl.gov/cmip5)
Country Modelling centre Model Resolution
France Centre National de Recherches
Météorologiques/Centre Européen de Recherche et Formation Avancée en Calcul
Scientifique
CNRM-CM5 T127 (~1.4°)
United Kingdom Met Office Hadley Centre HadGEM2-A 1.25 × 1.875°
France Institut Pierre Simon Laplace IPSL-CM5A-LR 1.875° × 3.75°
France Institut Pierre Simon Laplace IPSL-CM5B-LR 1.875° × 3.75°
Japan Atmosphere and Ocean Research Institute
(The University of Tokyo), National Institute for Environmental Studies, and Japan Agency for Marine Earth Science and
Technology
Peer Review Only
Table 2: The experiments with GLAM and AMIP runs. In control climate (ctl), SST and CO2 are prescribed at the 1979-2008 observed values (Taylor et al. 2012).
Sea Surface Temperature in AGCM CO2 atmospheric concentration in AGCM CO2 concentration in GLAM crop model
Short description of the scenario
Control climate
t0c1f1
ctl
ctl
ctl
The control scenariot0c1f4
ctl
ctl
ctl x4
effect on CO2 on the crop The scenario of directAltered climate with +4K warmer
SST but control CO2 concentration
t4c1f1
ctl +4K
ctl
ctl
The warmer climate scenario with no effect of
CO2 on the crop transpiration
t4c1f4
ctl +4K
ctl
ctl x4
The warmer climate scenario with direct effect
of C02 on the crop transpiration Altered climate with 4 times higher levels of CO2 concentration but control SST t0c4f1
ctl
ctl x4
ctl
The direct CO2 effect of the monsoon with no effect of CO2 on the crop
transpiration
t0c4f4
ctl
ctl x4
ctl x4
The direct CO2 effect of the monsoon with no effect of CO2 on the crop
Peer Review Only
Table 3: Simulated yield (kg/ha), annual rainfall (mm/year) and mean surface temperature (degC) in West Africa in the t0c1f1 control simulations. The values are averaged over the domain: Longitude 15W to 20E and latitude 4N to 15N
Climate model Mean yield (kg/ha) Total precipitation (mm/year) Mean temperature (degC) CNRM CM5 3994,0 650 27,2 HadGEM2 2921,5 461 28,7 IPSL CM5A 3706,6 645 27,6 IPSL CM5B 3342,6 569 27,4 MIROC5 3480,3 671 29,1
Peer Review Only
Table 4: Yield and annual precipitation change (%) in West Africa (20W-15E ; 4N-15N) in the t0c4f1 simulations comparing to CTL simulation. MMM is the multi-model mean.
Climate models Mean yield change (%) Total precipitation change (%) CNRM CM5 -0,57 6,59 HadGEM2 21,91 19,82 IPSL CM5A 1,42 5,43 IPSL CM5B -7,68 1,60 MIROC5 -15,26 -2,08 MMM -0,67 5,49
Peer Review Only
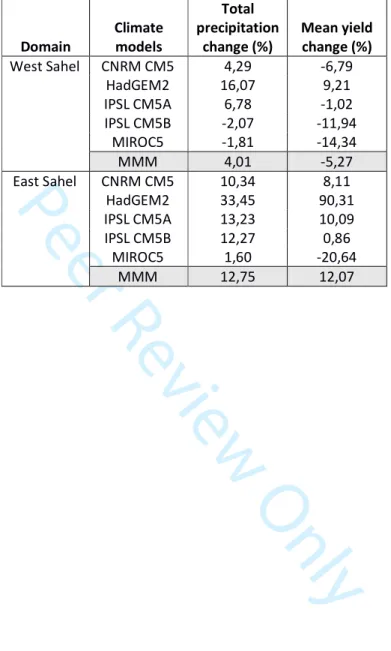
Table 5: Yield and annual precipitation change (%) in West Sahel and East Sahel (see boxes on Figure 4) in the t0c4f1 simulations comparing to the control CTL simulation. MMM is the multi-model mean.
Domain Climate models Total precipitation change (%) Mean yield change (%) West Sahel CNRM CM5 4,29 -6,79 HadGEM2 16,07 9,21 IPSL CM5A 6,78 -1,02 IPSL CM5B -2,07 -11,94 MIROC5 -1,81 -14,34 MMM 4,01 -5,27 East Sahel CNRM CM5 10,34 8,11 HadGEM2 33,45 90,31 IPSL CM5A 13,23 10,09 IPSL CM5B 12,27 0,86 MIROC5 1,60 -20,64 MMM 12,75 12,07
Peer Review Only
Table 6: Crop season duration (day), annual precipitation (%), mean temperature (K) and yield change (%) in the t4c1f1 and t4c1f4 simulations (only yield differs) in West Africa comparing to the control CTL simulation. MMM is the multi-model mean.
Climate models Growing season duration change (day) Total precipitation change (%) Mean temperature change (K) t4c1f1 Mean yield change (%) t4c1f4 Mean yield change (%) CNRM CM5 -14,3 -15,3 5,7 -54,7 -43,1 HadGEM2 -2,9 -16,6 6,0 -62,9 -52,6 IPSL CM5A -12,7 -18,6 5,3 -55,4 -32,3 IPSL CM5B -10,9 -27,2 5,5 -57,0 -39,9 MIROC5 -3,5 -17,5 5,2 -51,7 -38,6 MMM -8,9 -19,0 5,5 -56,1 -40,9
Peer Review Only
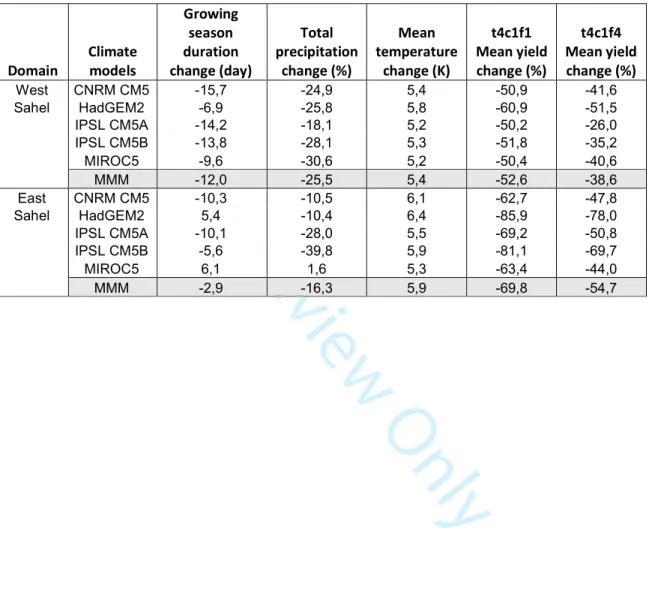
Table 7: Crop season duration (day), annual precipitation (%), mean temperature (K) and yield change (%) in the t4c1f1 and t4c1f4 simulations (only yield differs) in West and East Sahel comparing to control CTL simulation. MMM is the multi-model mean.
Domain Climate models Growing season duration change (day) Total precipitation change (%) Mean temperature change (K) t4c1f1 Mean yield change (%) t4c1f4 Mean yield change (%) West CNRM CM5 -15,7 -24,9 5,4 -50,9 -41,6 Sahel HadGEM2 -6,9 -25,8 5,8 -60,9 -51,5 IPSL CM5A -14,2 -18,1 5,2 -50,2 -26,0 IPSL CM5B -13,8 -28,1 5,3 -51,8 -35,2 MIROC5 -9,6 -30,6 5,2 -50,4 -40,6 MMM -12,0 -25,5 5,4 -52,6 -38,6 East CNRM CM5 -10,3 -10,5 6,1 -62,7 -47,8 Sahel HadGEM2 5,4 -10,4 6,4 -85,9 -78,0 IPSL CM5A -10,1 -28,0 5,5 -69,2 -50,8 IPSL CM5B -5,6 -39,8 5,9 -81,1 -69,7 MIROC5 6,1 1,6 5,3 -63,4 -44,0 MMM -2,9 -16,3 5,9 -69,8 -54,7
Peer Review Only
Figure 1: Crop yield response to rainfall and temperature variations in the GLAM model. Pixel by pixel difference against the domain average for mean yield and total growing season rainfall (left) and mean temperature (right). Values are then averaged over the 30 years of the control experiment to give more
Peer Review Only
Figure 2: Crop yield response to increased C02 concentration. Simulated yield change (%) are shown as differences with the control run in average over West Africa (20W-15E ; 4N-15N) for the t0c4f4, t0c1f4 and
Peer Review Only
Figure 3: Crop yield response to rainfall variations in the t0c4f1 simulation. Simulated yield and rainfall changes (%) are shown as differences with the control run in average over West Africa for the t0c4f1
Peer Review Only
Figure 4: Mean yield and rainfall changes in West Africa in the t0c1f4, t0c4f1 and t0c4f4 simulations. Multi-model mean changes (%) are shown as differences with the control run. Simulated yield change are shown
for simulations t0c1f4 (a), t0c4f1 (b) and t0c4f4 (d). Total rainfall change is shown in (c) for the t0c4f1 simulation. A similar map would be obtained for t0c4f4 simulation
Peer Review Only
Figure 5: Mean temperature and rainfall response to a SST warming of +4K. Multi-model mean changes of temperature (a) and rainfall (b) are shown as differences between the t4c1f1 simulation and the control run.
Peer Review Only
Figure 6: Crop yield response to a SST warming of +4K. Multi-model mean yield changes in West Africa (%) in the t4c1f1 (a) and t4c1f4 (b) simulations.
Peer Review Only
Figure 7: Crop yield response to temperature variations in the t4c1f1 simulation. Simulated yield (%) and temperature (K) changes are shown as differences with the control run in average over West Sahel (blue