HAL Id: hal-01490830
https://hal.univ-reunion.fr/hal-01490830
Submitted on 16 Mar 2017
HAL is a multi-disciplinary open access
archive for the deposit and dissemination of
sci-entific research documents, whether they are
pub-lished or not. The documents may come from
teaching and research institutions in France or
abroad, or from public or private research centers.
L’archive ouverte pluridisciplinaire HAL, est
destinée au dépôt et à la diffusion de documents
scientifiques de niveau recherche, publiés ou non,
émanant des établissements d’enseignement et de
recherche français ou étrangers, des laboratoires
publics ou privés.
Fusion of SAR and optical imagery for studuing the
eco-epidemiology of vector-borne diseases in tropical
countries
Thibault Catry, Zhichao Li, Emmanuel Roux, Vincent Herbreteau, Christophe
Révillion, Nadine Dessay
To cite this version:
Thibault Catry, Zhichao Li, Emmanuel Roux, Vincent Herbreteau, Christophe Révillion, et al.. Fusion
of SAR and optical imagery for studuing the eco-epidemiology of vector-borne diseases in tropical
countries. 2016 European Space Agency Living Planet Symposium, European Space Agency, May
2016, Prague, Czech Republic. �hal-01490830�
See discussions, stats, and author profiles for this publication at: https://www.researchgate.net/publication/306040578
FUSION OF SAR AND OPTICAL IMAGERY FOR
STUDYING THE ECOEPIDEMIOLOGY OF
VECTOR-BORNE...
Conference Paper · May 2016 CITATIONS0
READS77
6 authors, including: Some of the authors of this publication are also working on these related projects: LeptOI - Leptospirosis in the Indian OceanView project PALUSTOP : Malaria elimination in French Guiana : new study for new challenges
View project Thibault Catry Institute of Research for Development 9 PUBLICATIONS 0 CITATIONS SEE PROFILE Emmanuel Roux Institute of Research for Development 56 PUBLICATIONS 591 CITATIONS SEE PROFILE Vincent Herbreteau Institute of Research for Development 119 PUBLICATIONS 851 CITATIONS SEE PROFILE Nadine Dessay Institute of Research for Development 57 PUBLICATIONS 348 CITATIONS SEE PROFILE
All content following this page was uploaded by Zhichao Li on 11 August 2016.
The user has requested enhancement of the downloaded file. All in-text references underlined in blue are added to the original document and are linked to publications on ResearchGate, letting you access and read them immediately.
FUSION OF SAR AND OPTICAL IMAGERY FOR STUDYING THE
ECO-EPIDEMIOLOGY OF VECTOR-BORNE DISEASES IN TROPICAL COUNTRIES
Thibault Catry (1), Zhichao Li(1), Emmanuel Roux(1), Vincent Herbreteau(1), Christophe Révillion(1)
and Nadine Dessay (1)
(1) 1ESPACE-DEV, UMR 228 IRD/UM/UR/UG, Institut de Recherche pour le Développement (IRD), Montpellier, France
thibault.catry@ird.fr; zhichao.li@teledetection.fr; emmanuel.roux@ird.fr; vincent.herbreteau@ird.fr;
christophe.revillion@ird.fr; nadine.dessay@ird.fr
ABSTRACT
Vector-borne diseases like malaria represent a major public health issue worldwide. Other mosquito-borne diseases affect more and more countries and people, with effects on health which are not all identified yet. Recent developments in the field of remote-sensing allow to consider overriding the existing limits of studying such diseases in tropical regions, where cloud and vegetation cover often prevent to identify and characterize environmental features.
We highlight the potential of SAR-optical fusion for the mapping of land cover, the identification of wetlands, and the monitoring of environmental changes in different habitats related to vector-borne diseases in the French Guiana - Brazil cross-border area. This study is the foundation of a landscape-based model of malaria transmission risk. Environmental factors, together with epidemiological, socio-economic, behavioral, demographics, and entomological ones, contribute to assess risks related to such pathologies and support disease control and decision-making by local public health actors.
1. VECTOR-BORNE DISEASES
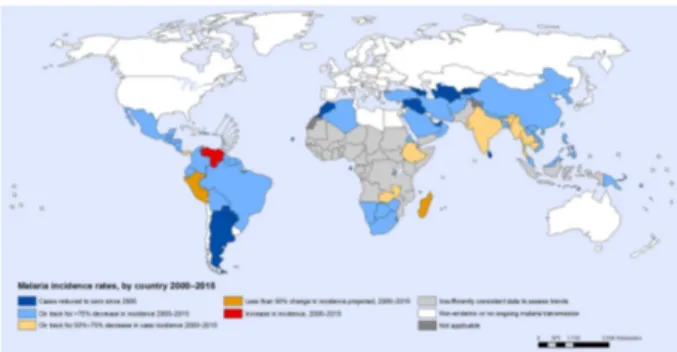
Malaria has declined by 37% between 2000 and 2015, nearly half of the world’s population remains at risk (about 3.2 billion people, [1], Fig. 1).
Figure 1: Malaria incidence rates by countries from 2000 to 206, WHO, 2015.
Other emerging mosquito-borne diseases (e.g. dengue, chikungunya, Zika) affect more and more countries and people, with lasting effects on health which are not all identified yet.
Various possible causes of rapid spreading of dengue and Zika epidemics have been identified: climate change, demographic growth, urban growth, urban fragmentation, ecological changes, increase in travels and international trade, disturbances in health systems and vector control efficiency, land cover/use changes... It is also known that natural and human-made ecosystem changes, such as climatic perturbation and land use and land cover (LULC) changes, can affect significantly the distribution of malaria by making disease vector (anopheles darlingi mosquito) habitats more or less suitable [2,3].
Hence, the prevention and control of vector borne diseases requires to identify, characterize and monitor these environmental factors, their changes and their impacts on the emergence of diseases. In this context, using remote sensing appears to be a pertinent tool that can characterize almost completely and continuously the environment related to vector-borne diseases transmission.
2. VECTOR-BORNE DISEASES AND REMOTE-SENSING
There has been a growing use of remote sensing data in epidemiology in the last 30 years [4,2], but some limitations usually occur, like (1) the price of very high-resolution data, (2) the general use of pre-processed data, (3) some technical limitations and (4) the fact that vector-borne diseases are strongly scale-dependent. In tropical regions persistent cloud cover and dense vegetation cover strongly affect the use of remotely-sensed data for environmental purposes. The adaptability of remote-sensing data is then limited when addressing epidemiology.
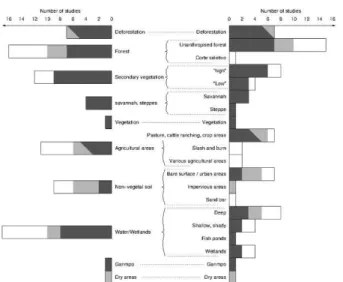
Stefani et al. [2] did a systematic review of literature studying the relationship between malaria and land cover/use types in the Amazon (Fig. 2).
Figure 2: Relationship between malaria and land cover/use types in the amazon [2].. Black = positive correlation, grey = no correlation, white = unknown.
Using remote-sensing for studying vector-borne diseases however implies some challenges
- How to quantify the role of environmental factors on the transmission of such diseases compared to other factors like socio-demographic and behavioral factors?
- How to describe social discrepancies and their influence?
- How to characterize the dynamics of multi-scale processes?
- How to provide real-time information, for monitoring and surveillance systems?
- How to facilitate the transfer of data and products towards the research community, actors of health services and the public?
3. CASE STUDY 3.1 Context
The Franco-Brazilian cross-border region considered here is composed by the French municipalities of Camopi, Saint-Georges-de-l’Oyapock and Ouanary, which are located on the western bank of the Oyapock River, and the Brazilian municipality of Oiapoque on the eastern bank of the river (Fig. 3). The human habitats in this study area mainly locate in Saint-Georges (FR), Oiapoque (BR) and the villages of Camopi (FR) (see the red rectangles in Fig.3).
Figure 3: Map of cross-border region between French Guiana and Brazil.
In the Americas, the Amazonian region is the most affected by malaria. Movement of malaria across international borders poses a major obstacle for malaria elimination due to various human activities, population movement, human vulnerability due to limited formal education and few financial resources, inadequate health systems, etc. [5].
3.2 Methodology
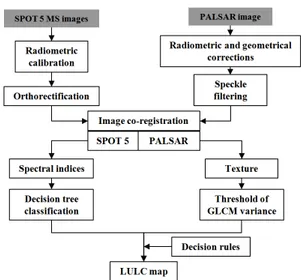
Overall methodology
Figure 4: 4 steps methodology developed in this study, in the frame of a landscape-related malaria hazard
model.
In this study, we follow a four step approach (fig. 4) which is part of a more general landscape-related malaria hazard model. This model is based on the exploitation of an optical image (like SPOT 5) in order to establish a simple forest/non forest land cover classification. This classification then integrates information regarding wetlands distribution extracted from a SAR image (L-band SAR like PALSAR) and a layer of urban classification derived from very high resolution sensors (optical alone or optical and SAR
combined together). These land cover classes are then confronted to epidemiology and entomology data in order to calculate spatialized landscape indicators used to create malaria hazard/risks maps to be delivered to local authorities and public health actors.
Images characteristics and treatments
One SPOT 5 image was acquired at 1A level in which radiometric calibration and orthorectification have been successively performed by using the ENVI 5.1. For the PALSAR image acquired at level 1.5 in which radiometric calibration, geometrical correction and speckle filtering (Lee filter 3*3) have already been performed by Japanese Space Agency (JAXA).
Several spectral indices were calculated from the pretreated SPOT 5 MS image. A decision tree-based classification was then carried out for mapping the various LULC types using ENVI 5.1 (Fig.5).
Figure 5: Classification decision tree applied to optical imagery. Decision tree nodes are in grey.
The resulting classification was post-processed using the majority analysis (kernel size 3*3) for removing the isolated pixels. Finally, we evaluated the classification by randomly choosing 20 sites in each class and establishing the actual land cover of these sites by photo-interpretations of one Pleiades image dated September 30, 2012 with a 50-centimeter spatial resolution.
A textural analysis (GLCM under Sentinel tool box) was performed and a simple thresholding method on the variance of PALSAR signal and a colored composition (Red = VH, Green = VV, Blue = VH/VV) was then used for extracting bare soil, flooded forest, forest, free water and swamps (fig.6).
Figure 6: Summarized method of optical-SAR classification fusion for mapping the malaria
environmental features.
Combining the information from SPOT 5 and PALSAR data using the knowledge-based decision rules: 1) If a pixel belongs to PALSAR free water or SPOT 5 free
water, then the pixel is labelled as free water; 2) If a
pixel belongs to PALSAR bare soil or SPOT 5 bare
soil/built-up/road, then the pixel is labelled as bare soil/built-up/road; 3) If a pixel belongs to one of
PALSAR wetlands classes and SPOT 5 vegetation class, then the pixel is labelled as wetland.
3.3 A multi-sensor approach
Optical data
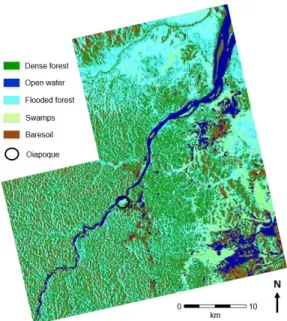
Figure 7 shows the resulting SPOT 5 classification. The overall accuracy was found to be 0.90 and the kappa coefficient was 0.84.
Figure 7: Pixel-based land cover map of SPOT 5 image in the region of Saint-Georges and Oiapoque.
SAR data
Figure 8: Wetlands land cover map extracted from PALSAR image in the region of Saint-Georges and
Oiapoque.
Comparing with the SPOT 5 classification, this method allowed us to characterize free water, flooded forest and swamps (Fig. 8) using an archive 2010 image. Moreover, it is important to remind that we used free archive PALSAR imagery in order to test the contribution of L-band SAR data to the identification of malaria environmental features, before considering the acquisition of expensive new L-band data.
The validation of PALSAR classification is complicated but some insights could be obtained from 2010 archive optical imagery if the cloud cover is not too dense. Recent field surveys during the similar period (similar season) can also be used for the validation since the identified wetlands are not strongly changed with time.
L-band SAR (here 12.5 m resolution PALSAR data) is an efficient tool for the detection of large wetlands, which can define main resting, and breeding sites of malaria vectors.
3.4 A multi-resolution approach
High spatial resolution data (SPOT 5, S2, S1, PALSAR) are used to characterize areas covered by various types of forest, where adult mosquitoes rest and feed. This part of the study focuses on the relationship between the environment and the vectors of the disease, i.e. the “hazard” component of the malaria transmission risk. Very high spatial resolution data (SPOT 7, Pleiades, TerraSAR-X) will be used to characterize urban and peri-urban structures and domestic wetlands, where breeding sites for mosquitoes are frequent. This part will focus on the relationship between the environment
and human populations, i.e. the “vulnerability” component of the malaria transmission risk.
3.5 A multi-temporal approach: S1 and S2
The repetitivity of Sentinel data (up to 5 days) will allow the production of land cover maps on a weekly basis, from free satellite imagery. Combining S1 and S2 products, the monitoring of urban and peri-urban changes, at the interface with forest areas and wetlands, main « mosquito reservoirs » and sources of epidemic risk, is to be made possible.
These data should be used to update a preexisting map of urban and peri-urban areas, established from a sensor like SPOT 5 (similar resolutions in space).
The combination of SAR S1 and optical S2 data should be efficient tool to overcome disturbances from persistent cloud cover over the studied area.
Finally, Sentinel images are to be combined to meteorological data (from satellite or ground station) to better constrained the role of rainfall in the evolution of wetlands in the area.
4. FUSION OF OPTICAL AND SAR data
On the basis of remotely-sensed and field data, the fusion of layers containing spatialized information extracted from optical and SAR images from various sensors and at various resolutions will favour the production of indicators and maps to support decision-making processes by public health actors (fig. 9)
Figure 9: Process of fusion of various remotely-sensed data at the decision-level (from [6]).
5. DEFINITION OF LANDSCAPE INDICATORS
In this study, we use a model previously established by Stefani et al. ([2], Fig. 10). This paper proposed a
generic model of the relationship between deforestation and malaria transmission risk emerges from the literature. It considers that: i) deforested areas can procure favourable conditions for An. darlingi breeding, ii) forest and secondary vegetation can define resting sites for adult An. darlingi mosquitoes that return to the forest after feeding, when houses are located close to the forest and iii) that malaria transmission risk depends on the spatial distribution of LC types and, in particular, the interaction level between human populations and LC/LU types associated with breeding and resting sites. This generic model is schematically represented in Figure 9. This shows the importance of distinguishing different situations by considering the LC/LU types over time in terms of both proportions and spatial distributions.
Figure 10: Landscape indicators that may increase or decrease malaria transmission risk as a function of time
and landscape fragmentation [2].
6. TOWARDS EPIDEMIC HAZARD MAPS
This study shows that fusion of land cover layers extracted from optical and SAR high-resolution imagery is an efficient tool for detecting large permanent (or long-lasting) wetlands (potential breeding sites) and various forest types (potential resting and feeding sites). Land cover classification of SPOT 5 image suffers two mains flaws: the impossibility to penetrate the forest canopy and disturbance from persistent cloud cover in tropical areas. In particular, L-band SAR has proven its ability to detect the water under forest, a key element for the identification of breeding sites of malaria vectors and malaria vector control.
Until now, only free archive SAR data were used in order to test the methodology but the acquisition of PALSAR 2 data is planned. Its main advantage is the possibility to access very high spatial resolution. Combining very high resolution optical (SPOT 6-7 / Pleiades) together with the very high resolution SAR permit characterize the urban structures and minor sizes, non-permanent water bodies such as domestic wetlands
within the urban areas, at the direct contact with vulnerable populations.
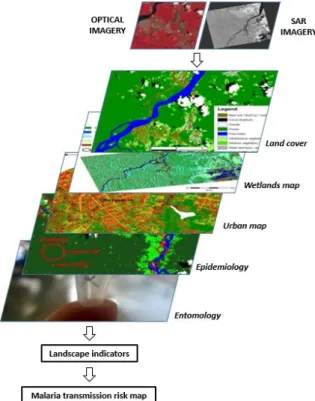
These results of land cover classification fusion from optical and SAR data are the basis of a landscape-based model of malaria transmission risk (Fig. 11) The layers of forest / vegetation and wetland types, are then combined to a layer of urban classification and 2 field-based layers: one regarding the entomology of mosquitoes and the malaria epidemiology in the area. These combined layers allow the calculation of landscape indicators and consequently the creation of malaria transmission risk map integration vector-related environmental information (hazard estimation) and human related environmental factors (vulnerability assessment).
Figure 11: Landscape-based model of malaria transmission risk involving the decision-level fusion of
spatialized information layers.
7. CONCLUSION
This study provides a method of identification of environmental features associated with malaria vector resting and breeding sites. Optical and SAR remote sensing have been proved to be complementary for this purpose. This method provides the complete LULC information about malaria transmission, which may be automatically and easily reproduced at temporal scale using a time series of images. The fusion of layers containing spatialized information extracted from optical and SAR data from various sensors and at
various resolutions aims at producing indicators and malaria transmission hazard/risk maps to support decision-‐making processes by local institutions /authorities and public health actors.
Data processing methodologies developed in this study will be automated and made available to the science community and the actors of public health. All products (land cover maps, hazard maps) will be made available on a preexisting platform. These results contribute to Theia CES “health and environment” and “land cover”.
8. ACKNOWLEDGEMENTS
This research was supported by the TéléPal project (CNES-TOSCA 2014 call), and the China Scholarship Council. We greatfully thank ESA for inviting us at the LPS 2016 in Prague.
9. REFERENCES
1- WHO, 2015. “World Malaria Report 2015”, World Health Organization, Geneva, Switzerland. 2- Stefani, A., I. Dusfour, A.P.S.A. Corrêa, M.C.B.
Cruz, N. Dessay, A.K.R. Galardo, C.D. Galardo, R, Girod, M.S.M. Gomes, H. Gurgel, A.C.F. Lima, E.S. Moreno, L. Musset, M. Nacher, A.C.S. Soares, B. Carme, E. Roux (2013). Land cover, land use and malaria in the Amazon: a systematic literature review of studies using remotely sensed data, Malaria Journal., vol. 12, pp.192-200. 3- Li, Z., E. Roux, N. Dessay, R. Girod, A. Stefani, M.
Nacher, A. Moiret, F. Seyler (2016). Mapping a Knowledge-Based Malaria Hazard Index Related to Landscape Using Remote Sensing: Application to the Cross-Border Area between French Guiana and Brazil, Remote Sens., vol. 8, pp. 319.
4- Herbreteau, V., Salem, G., Souris, M., Hugot, J. P., & Gonzalez, J. P. (2007). Thirty years of use and improvement of remote sensing, applied to epidemiology: from early promises to lasting frustration. Health & Place, 13(2), 400-403. 5- Wangdi, K., M.L. Gatton, G.C. Kelly, A.CA.
Clements (2015). Cross-border Malaria: A Major Obstacle for Malaria Elimination, Advances in
Parasitology., vol. 89, pp. 79-107.
6- Pohl, C., & Van Genderen, J. L. (1998). Review article multisensor image fusion in remote sensing: concepts, methods and applications. International
journal of remote sensing, 19(5), 823-854.
View publication stats View publication stats