HAL Id: hal-03105195
https://hal.archives-ouvertes.fr/hal-03105195
Submitted on 10 Jan 2021
HAL is a multi-disciplinary open access
archive for the deposit and dissemination of
sci-entific research documents, whether they are
pub-lished or not. The documents may come from
teaching and research institutions in France or
abroad, or from public or private research centers.
L’archive ouverte pluridisciplinaire HAL, est
destinée au dépôt et à la diffusion de documents
scientifiques de niveau recherche, publiés ou non,
émanant des établissements d’enseignement et de
recherche français ou étrangers, des laboratoires
publics ou privés.
Detection of Cardiac Arrhythmias From Varied Length
Multichannel Electrocardiogram Recordings Using Deep
Convolutional Neural Networks
Marwen Sallem, Amina Ghrissi, Adnen Saadaoui, Vicente Zarzoso
To cite this version:
Marwen Sallem, Amina Ghrissi, Adnen Saadaoui, Vicente Zarzoso.
Detection of Cardiac
Ar-rhythmias From Varied Length Multichannel Electrocardiogram Recordings Using Deep
Convolu-tional Neural Networks. Computing in Cardology, PhysioNet Challenge, Sep 2020, Rimini, Italy.
�10.22489/CinC.2020.339�. �hal-03105195�
Detection of Cardiac Arrhythmias From Varied Length Multichannel
Electrocardiogram Recordings Using Deep Convolutional Neural Networks
Marwen Sallem
1, Amina Ghrissi
2, Adnen Saadaoui
3and Vicente Zarzoso
21
National Institute of Applied Sciences and Technology, MMA Laboratory, Tunisia
2Universit´e Cˆote d’Azur, CNRS, I3S Laboratory, Sophia Antipolis, France
3
Vneuron,Tunisia
Abstract
Automatic identification of different arrhythmias helps cardiologists better diagnose patients with cardiovascu-lar diseases. Deep learning algorithms are used for the classification of multichannel ECG signals into different heart rhythms. The study dataset includes a cohort of 43101 12-lead ECG recordings with various lengths. Two options are tested to standardize the recordings length: zero padding and signal repetition. Downsampling the recordings to 100 Hz allow handling the problem of dif-ferent sampling frequencies of data coming from differ-ent sources. We design a deep one-dimensional convolu-tional neural network (CNN) called VGG-ECG, a 13-layer fully CNN for multilabel classification. Our team is called MIndS and our approach achieved a challenge validation score of 0.368, and full test score of -0.128, placing us 38 out of 41 in the official ranking.
1.
Introduction
Cardiovascular diseases represent a major cause of death worldwide as they are responsible for about one million deaths annually in the United States alone [1]. Hence, contributing to the automatic identification of different ar-rhythmias with deep learning (DL) tools [2] would help cardiologists better diagnose patients with cardiovascular diseases. For this reason, the current work aims to classify multichannel ECG signals into 27 heart rhythms using DL as part of Pyhsionet Challenge 2020 [3] [4]. The study dataset provided by the challenge includes a cohort of 43101 12-lead ECG recordings of different heart rhythms. The main issues encountered in the classification task con-sist in the varied lengths of multichannel ECG recordings added to the difference in characteristics of samples com-ing from different data sources.
We design a deep one dimensional (1D) convolutional neural network (CNN) inspired by VGG16 architecture (developed by Visual Geometry Group) [5] [6] and
reg-ularized with dropout [7]. Data preprocessing and prepa-ration is also performed. Long recordings are truncated and only the first 3000 time samples are kept to alleviate the training load. Two options are tested to standardize the recording lengths: zero padding and signal repetition. The designed solution is expected to help cardiologists distin-guish 27 scored cardiac rhythms out of 111.
2.
Methods
2.1.
Classification Metrics
A variety of metrics is used to evaluate the classifica-tion performance. In the unofficial phase of the challenge, metrics used include: F2-score, G2-score and geometric mean (GM). The metrics formulas combine precision and recall [4]. In the official phase, one single score (S) is computed. S generalizes the traditional accuracy metric by giving full credit to correct diagnoses and penalizing wrong diagnosis, with respect to similarities between ar-rhythmias: S = j X i wijaij,
where aij is an element of the confusion matrix equal to
the number of samples classified as belonging to category cibut that truly belong to cj. Moreover, different weights
W = [wij] are assigned to a couple of classes (ci, cj)
based on their similarity levels. The higher the values of the scores, the better our model [8].
2.2.
VGG-ECG
VGG-ECG is a 13-layer fully CNN composed of blocks of 2 and 3 successive convolutional (Conv) layers alter-nated by average pooling layers. 1D Conv layers have a receptive field of dimensions 1×3 to scan information along the temporal dimension of the leads. They are de-noted Conv3 as shown in the Fig. 1. This architecture
Accepted for publication in Computing in Cardiology (CinC) Conference, Rimini, Italy, 2020.
Physionet Challenge.
Figure 1. VGG-ECG architecture [5].
proved efficient in a similar multichannel ECG classifica-tion task [5]. Dropout with a drop probability equal to 0.3 is used to regularize the model and avoid overfitting [7]. ADAM optimizer with learning rate equal to 10−3 [9] is used for training. Binary cross-entropy loss is also used to allow multilabel classification of recordings in more than one class (ci), This cost function proved more efficient than
mean squared error that gives poor results. Random seeds are fixed in order to make experiments reproducible when training on GPUs.
Implementation: DL learning experiments are con-ducted with the use of Python 3.7 programming language and Tensorflow 2.3 library within Google Cloud Platform (GCP), running on n1-standard-4 (4 vCPUs, 15 GB mem-ory) machine and NVIDIA Tesla T4 Virtual Workstation GPU [11]. Wandb [12] ML experiment tracking tool is used to assess the training performance and visualize statistics about the model.
2.3.
Data Preparation
The public dataset afforded by the challenge committee for training and validation is composed of 43101 12-lead ECG recordings coming from four different data sources. Recordings have different lengths varying from 10 s to 30 min. The sampling frequencies (Fs) are also different
and depend on the data sources as described in [4]. In order to train the model, we consider the majority of the signals coming from the four data sources. We se-lect the signals belonging to at least one of the 27 scored classes. Hence, we passed from 43101 to 37794 entry sig-nals. The training is performed on 3/4 of the dataset, while the remaining samples are used for validation.
Regarding the difference of the recording lengths that vary from 10 s to 30 min, we propose to consider only the first 3000 temporal samples and ignore the rest. We expect the first part of each recording to contain sufficient infor-mation about the heart rhythm. Signals that are shorter than 3000 samples are zero padded. Truncating the first 3000 samples after downsampling allows us to alleviate considerably the computational load of training and vali-dation process.
In order to handle the problem of different sampling fre-quencies, we aim to standardize Fsby downsampling all
recordings to a standard frequency (Fd). We benchmark
the classification performance on the test set with respect to three values of Fdas shown in Tab. 1. Fd= 100 Hz
pro-vides better performance than 50 and 150 Hz.
Fd(Hz) 50 100 150
S 0.25 0.47 0.44
Table 1. Effect of Fdon test classification scores.
3.
Experiments and Results
Initial experiments are conducted on the preliminary dataset afforded for the unofficial submission phase of Physionet challenge. Then final results are conducted on the full dataset.
3.1.
Preliminary Results
In order to handle class imbalance, class weights of the neural networks nodes are configured to ensure bal-ance. Data preprocessing includes zero padding, consid-ering only the first 18000 samples of the padded record-ings. The training scores F2-score, G2-score and geomet-ric mean (GM) after 5-fold cross validation are respec-tively 0.77, 0.58 and 0.67 with zero padding and 0.74, 0.54 and 0.63 with signal repetition. The scores’ standard devi-ations are below 0.02. By analyzing the confusion matrix, we notice that the ST-segment elevation (STE) class has poor sensitivity (0.43). This can be explained by the low number of samples (220) compared to atrial fibrillation, for instance, that has 1221 samples and high sensitivity (0.93). Results on the test set are F2-score=0.77, G2-score=0.55 and GM=0.65.
0
5
10
15
20
Step
0.10
0.12
0.14
0.16
0.18
Loss
Training Loss Validation Loss
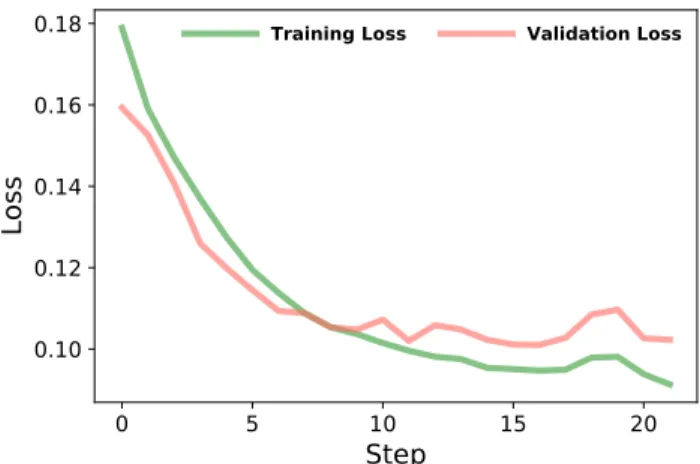
Figure 2. Training and Validation curve.
0.1 0.2 0.3 0.4 0.5 0.6 0.7 0.0 0.1 0.2 0.3 0.4 0.5
0.508 0.51
0.468
0.402
0.322
0.222
0.107
Figure 3. The threshold effect.
3.2.
Final Results
The training consists in several steps and each step is a full pass over the entire dataset. In order to avoid overfit-ting, training is stopped when the value of validation loss does not improve significantly for more than five steps. Then the trained model reaching the best performance is selected. The retained model achieved a validation accu-racy of 0.54 and validation loss of 0.10 after 2 h 30 min of training through 21 step as shown in Fig. 2.
The threshold has a direct impact on the computed score S. Several values of thresholds are evaluated on the test set. Fig. 3 shows that for a high threshold value, the score gets lower. Indeed, the score metric penalizes more the false negatives compared to the false positives. We select a threshold value equal to 0.2 giving the best score in the final model.
Then, the model is submitted to the challenge committee
Figure 4. Validation classification scores.
to be assessed on hidden validation and test sets. The re-sults are shown in Fig. 4. VGG-ECG reaches S=0.37 com-pared to baseline models (Baseline I and II), proposed by the challenge, which scores’ values do not exceed 0.1. This result can be explained by the ability of CNNs to capture complex hidden features from data compared to baseline models based on handcrafted features and logistic regres-sion [10].
We are the MIndS team and we achieved a full test score of -0.128 which places us 38 out of 41 in the official rank-ing.
4.
Conclusions and perspectives
The classification of multichannel ECG recordings us-ing DL can help cardiologists automatically detect differ-ent arrhythmia types added to sinus rhythm. In order to handle the varied length recordings and the imbalanced dataset issues, we benchmark several solutions. Two op-tions are tested to standardize the recordings length: zero padding and signal repetition. Moreover, all signals are downsampled to 100 Hz in order to standardize the dif-ferent sampling frequencies. Several settings are also as-sessed such as adding residual layers and customizing clas-sification thresholds for each class but these approaches did not enhance the performance. Moreover, preprocess-ing methods like low-pass filterpreprocess-ing and standard normali-sation does not help achieving better scores. The multil-abel classification performed considers only the 27 scored classes, as stated by the challenge guidelines, and ignores the remaining classes. By benchmarking the classification performance of several architectures, we opt for a deep 1D CNN model inspired by VGG16 for multilabel classifica-tion with binary cross entropy loss. However, the score on the hidden test set is equal to -0.128.
Further work will investigate data augmentation [13] [14] technique to handle the issue of imbalanced dataset ratio
between different arrhythmias. Also, we will add LSTM and attention layers to the CNN model as they are expected to learn automatically salient dependencies from ECG time series [5] [15].
Acknowledgments
The work of Amina Ghrissi is partly funded by the French government PIA program, IDEX UCAJEDI project
(ANR-15-IDEX-0001).
References
[1] C. T. January, et al. “2014 AHA/ACC/HRS guideline for the
management of patients with atrial fibrillation: a report of the American College of Cardiology. American Heart As-sociation Task Force on Practice Guidelines and the Heart Rhythm Society,” Journal of the American College of Car-diology, 64(21), 2014.
[2] Goodfellow I, Bengio Y, Courville A. Deep Learning, MIT
Press, 2016. www.deeplearningbook.org.
[3] Goldberger A, et al. PhysioBank, PhysioToolkit, and
Phy-sioNet: Components of a new research resource for com-plex physiologic signals. Circulation [Online]. 101(23), pp. 215–220.
[4] Perez A. EA, et al. “Classification of 12-lead ECGs:
the PhysioNet/Computing in Cardiology Challenge 2020”. Physiol. Meas, 2020.
[5] Qihang Y, et al. “Multi-class arrhythmia detection from
12-lead varied-length ECG using Attention-based Time-Incremental Convolutional Neural Network.” Information Fusion, 53(2020): pp. 174–182.
[6] Simonyan K, Zisserman A. “Very deep convolutional
net-works for large-scale image recognition,” In Proc. Interna-tional Conference on Learning Representations, San Diego, CA, 2015.
[7] Srivastava N, et al. “Dropout: a simple way to prevent
neural networks from overfitting,” The Journal of Machine Learning Research, 15(1), pp. 1929–1958, 2014.
[8] Sokolova M, Lapalme G. “A systematic analysis of
perfor-mance measures for classification tasks.” Information Pro-cessing and Management, 45(4), p. 427–437, 2009.
[9] Changyou C, et al. “Bridging the gap between stochastic
gradient MCMC and stochastic optimization.” Artificial In-telligence and Statistics, 2016.
[10] Dreiseitl S, Lucila OM. “Logistic regression and artificial neural network classification models,” Journal of Biomedi-cal Informatics, 35(5-6), pp. 352–359, 2002.
[11] E. Lindholm, et al. “NVIDIA Tesla: A Unified Graphics and Computing Architecture.” in IEEE Micro, 28( 2), pp. 39–55, 2008.
[12] L. Biewald, Experiment Tracking with Weights and Biases. Software available from wandb.com, 2020.
[13] Shorten C, Khoshgoftaar TM. “A survey on image data aug-mentation for deep learning.” Journal of Big Data, 6(1), p. 60, 2019.
[14] Agnieszka A, Grochowski M, “Data augmentation for im-proving deep learning in image classification problem.” In Proc. International Interdisciplinary PhD Workshop, IEEE, 2018.
[15] Hannun AY, et al. “Cardiologist-level arrhythmia detection and classification in ambulatory electrocardiograms using a deep neural network,” Nature Medicine, 25, pp. 65–69, 2019.
Address for correspondence: Amina Ghrissi
Universit´e Cˆote d’Azur, CNRS, I3S Laboratory
Les Algorithmes, Euclide B, 06103, Sophia Antipolis, France amina.ghrissi@univ-cotedazur.fr
![Figure 1. VGG-ECG architecture [5].](https://thumb-eu.123doks.com/thumbv2/123doknet/13430920.408851/3.918.160.382.101.538/figure-vgg-ecg-architecture.webp)