HAL Id: lirmm-01381834
https://hal-lirmm.ccsd.cnrs.fr/lirmm-01381834
Submitted on 15 May 2019
HAL is a multi-disciplinary open access
archive for the deposit and dissemination of
sci-entific research documents, whether they are
pub-lished or not. The documents may come from
teaching and research institutions in France or
abroad, or from public or private research centers.
L’archive ouverte pluridisciplinaire HAL, est
destinée au dépôt et à la diffusion de documents
scientifiques de niveau recherche, publiés ou non,
émanant des établissements d’enseignement et de
recherche français ou étrangers, des laboratoires
publics ou privés.
Simple-graph fusion in image mosaic. Application to
automated cell file identification in wood slices
Guilhem Brunel, Philippe Borianne, Gérard Subsol, Marc Jaeger
To cite this version:
Guilhem Brunel, Philippe Borianne, Gérard Subsol, Marc Jaeger. Simple-graph fusion in image
mo-saic. Application to automated cell file identification in wood slices. SCIA: Scandinavian Conference
on Image Analysis, Jun 2013, Espoo, Finland. pp.34-43, �10.1007/978-3-642-38886-6_4�.
�lirmm-01381834�
J.-K. Kämäräinen and M. Koskela (Eds.): SCIA 2013, LNCS 7944, pp. 34–43, 2013. © Springer-Verlag Berlin Heidelberg 2013
Simple-Graphs Fusion in Image Mosaic: Application
to Automated Cell Files Identification in Wood Slices
Guilhem Brunel1,2,*, Philippe Borianne1, Gérard Subsol3, and Marc Jaeger1
1
CIRAD - UMR AMAP, France
2 Université Montpellier 2, France 3
CNRS – LIRMM, France guilhem.brunel@cirad.fr
Abstract. Results aggregation by disjoint graph merging is potentially a good
alternative to image stitching. During the processing of image mosaics, it allows to be free of radiometric and geometric corrections inherent in image fusion. We have studied and developed a generic merging method of disjoint graphs for tracking cell alignments in image mosaics of wood.
Keywords: graphs theory, graphs fusion, image processing, pattern recognition,
cell segmentation, cell organization.
1
Introduction
Graph theory is widely used in image processing [1] especially for region encoding or image segmentation. The image is then considered as a graph whose vertex set is made of pixels, and edge set is given by an adjacency relation between them. Numer-ous segmentation methods based on region merging are proposed in literature, the most known being the Split and Merge algorithm. Several authors combine it with the watershed algorithm by using graph fusion to segment grey [2] or color [3-4] images. In all these approaches, the fusion operates on the vertices of a single graph.
Our specific segmentation method of cell alignments, so called cell files, in wood slices produces an adjacency graph. Nevertheless, identifying cell files on very large areas given by images mosaic implies either to process the image resulting from com-bining all the images of the mosaic or to merge the results produced by processing each image.
In the first case, stitching is the method which is the most often used. Image stitch-ing combines multiple images with overlappstitch-ing fields of view in order to produce a high-resolution image. Most of the algorithms require nearly exact overlaps between images and identical exposures to produce seamless results [5-6]. Moreover, they often request local deformation correction [7-9] due to optical acquisition properties, or local offset rectification [10] due to the automated views shooting. However, the resulting high resolution images may still be difficult to be processed, especially from the final resolution (up to several billion pixels) and the possible radiative variation due to the microscope acquisition properties.
*
So, we preferred to use the understanding of the ca cell patterns regularity, of t time [11-12]. We are inter standing the development, The automation of the cell f nents [14-15] allow today t study a large area of observ wood slice of several cent constrained to single imag Identifying radial files on l merging the results produce Our dataset is defined b versal slices of 20 µm thick in between glass strips befo scope. The mosaic images placement of the microscop mosaic is given by the stag tion area is limited to 10x10 encoded in RGB system, w show local or peripheral bl variations.
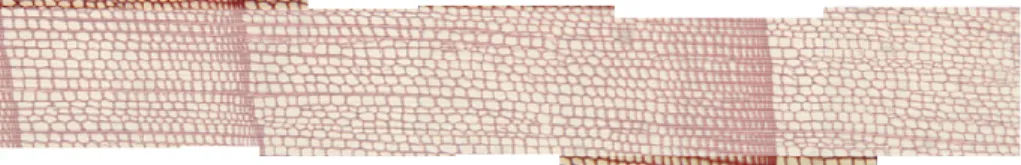
Fig. 1. Seven color ima
We wish to avoid image radiative corrections. We p images and the progressiv process takes benefits from adapted to cells organizati thus of their two respective
The paper extends a pre
sium on Plant Growth Mo
slice image. The following reminds the automated cell Section 4 presents the gra perspectives are presented a
the second class of methods. Our framework is based ambium growth mechanisms which requires the studies their disruption or of their modification through space resting by radial files (cell alignments); they help und
the differentiation and the temporal changes of cells [1 files identification and the characterization of their com to process a large quantity of images. However, we aim vation, following cells of some microns diameter on a gi
timeters diameter. But these recognition processes be e detections; studies of large area are thus impracticab large areas described by images mosaic involves theref ed by the processing of each image.
y color images mosaic of wood histological slices. Tra kness are prepared with a vibratome, colored, and then ore being digitalized by a camera coupled with the mic s (Fig. 1.) are successively generated by progressive d pe stage taking the strip. The position of the image in e displacement in abscissa X and ordinate Y. The obser 0 cm2, requiring nearly 1500 images mosaic. Each imag with a resolution of 1600 by 1200 pixels. The images m
lur due to the optical deformations or specimen thickn
ages mosaic of Black Pinus overlapping a 2x0.25 cm2 area
s stitching difficulties related to the high resolution and propose an approach mixing gradually the processing e merging of the produced results [16-17]. The merg m the result description using a graph. Such a model is w
on. The results merging of two adjacent images con graphs amalgamation.
eliminary work published in Fourth International Sym
odeling [14] presenting radial files identification in wo
g section describes the notion of simple-graph. Sectio l files identification principles in the microscopic imag aph merging and the fusion kernel notion. Results and discussed in the section 5 before conclusion.
d on s of and der-13]. mpo-m to ven eing ble. fore ans-n fit cro- dis-the rva-ge is may ness the g of ging well nsist mpo-ood on 3 ges. and
36 G. Brunel et al.
Our contribution lies in t • We introduce the Simple
kernel used to amalgama • We introduce a similarit tices of the graphs which • We introduce a local blu
tices fusion.
2
Graph Theory N
This section gives some g only considered specificity files. We present here the distinct graphs are gathered
2.1 Simple Graph or
S-A graph G=(V,E) is a mat The elements of V are calle ple graph or S-Graph is an edge between any two diff form a set and each edge is every vertex has a degree t non-simple graphs with n v
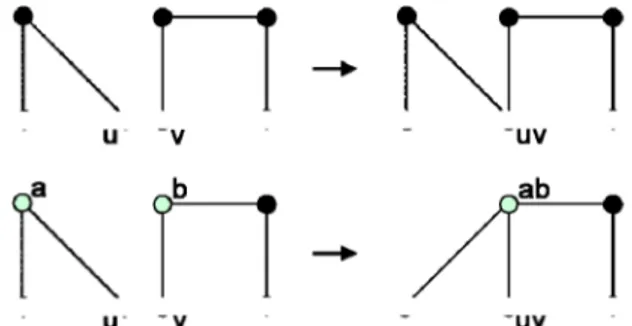
Fig. 2. Top, simple fusion of
nodes and two edges of disjoin
2.2 Multiple S-Graph A
Let , and S-graph of and tion without fixed point bet
the graphs fusion formalism and its application: e Graph notion to describe cell organization and the fus ate two graphs;
y function in order to define the fusion kernel, i.e. the v h should be amalgamated.
ur indicator to define the best representative vertex in v
Notion
eneral definitions about graphs merging mechanism. T is the nature of the graph, linked to the properties of formalization of the graphs amalgamation, i.e. when t d by merging of one of their vertices.
-Graph
thematical structure composed of two finite sets V and ed vertices, and the elements of E are called edges. A s undirected graph that has no loops and no more than ferent vertices. In a simple graph, the edges of the gr s a distinct pair of vertices. In a simple graph of n vertic
that is less than n (the converse, is not true — there e ertices in which every vertex has a degree smaller than n
two nodes of disjoint S-graphs. Bottom, complex fusion of f nt S-graphs.
Amalgamation
, be two disjoint S-graphs, with , a , a sub S-graph of . Let be an invo tween these subgraphs.
and sion ver-The cell two d E. sim-one raph ces, exist n). four sub
olu-The amalgamation of a from the union by
with their respective im vertex is noted , and
The vertex set of this ne the edge set is
or as endpoint n amalgamation result is a S-set as shown in Fig. 2.
2.3 Amalgamation Ker
The amalgamation kernel is
3
The Cell File Ide
The cell files identification are alignment of two by tw namic; (ii) the cells alignm have to be reversible.
From methodological po enhanced by a difference of converted in grey levels by
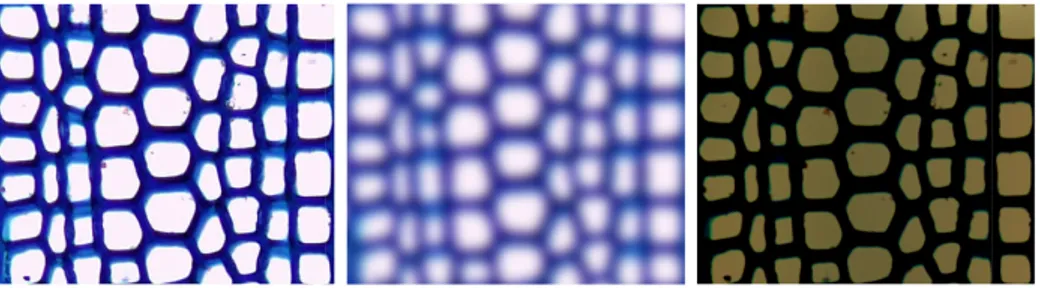
Fig. 3. Image contrast enhanc
nus. Left: the image obtained image resulting from a strong previous images which increas
The cells individualizatio fine regions whose limits c adjacency graph is built fro ble breadth-first search exp they are defined as the mos racteristics, the vertex takin
and modulo the isomorphism is the S-graph obtai merging each vertex and each edge in the subgr mages and in subgraph . The amalgama d the amalgamated edge is noted .
ew graph is | ,
| ; any edge which had now has the amalgamated vertex as endpoint. T -graph: each edge appears one and only time in the ed
rnel
s the set of the merged vertex couples defined as
| }
entification Principle
process [14] leads on the following principles: (i) the f wo similar cells, i.e. close in terms of size, shape and ment are independent of the image orientation: the meth
oint of view, the contrast between cell wall and lumen f Gaussians on the color image (Fig. 3.). Then, the imag
the simple mean of the color channels.
cing by a Difference of Gaussian filtering on color images of by applying a small Gaussian blurring (σ = 3 pixels). Center: Gaussian blurring (σ = (image width)/10). Right: subtraction ses the contrast between wall and lumen.
on is built from watershed process [18]; the crest lines correspond to the inter-cells separation (Fig. 4.). The c om these lines [19]. The cell files are identified by reve ploration of the graph under spatio-geometrical constrai st linear paths whose adjacent vertices present similar c ng attributes describing shape, size and aspect of the cell
ined raph ated and The dges files dy-hod n is ge is f Pi-: the n of de-cells ersi-nts: cha-l.
38 G. Brunel et al.
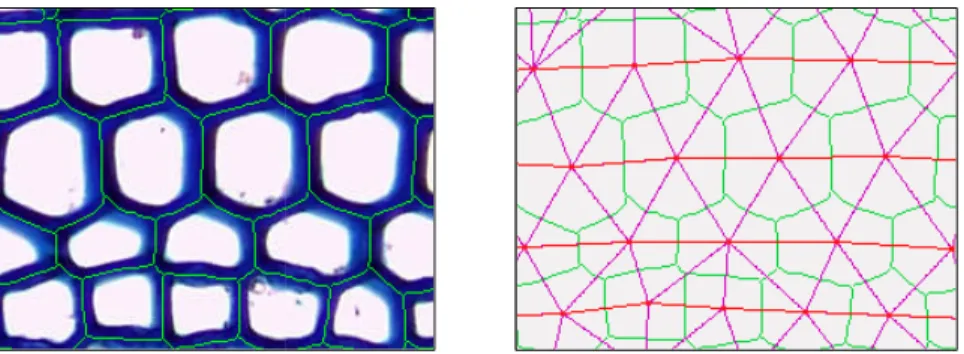
Fig. 4. Cells identification and
pink, the adjacency graph; in r algorithm define a good appro from the crest lines; the cell fil
4
The Graphs Fus
This section specifies how text, in particular the way w Let G=(V,E) be a given spatio-geometrical attribute
─ , the radius of the c ─ , the cell geometric ─ , the cell geometric ─ , the cell area.
4.1 Similarity Coefficie
The similarity coefficient e It is defined by a single pr weight in the similarity eva es, towards 0 for too differe Let , and
, ,
,
0 1 | | This definition distinguishe ly fusion-able vertices. Each spatial position or the size ria; shape, dynamic…
d its adjacency graph. Legend: in green, the crest lines; in red red, the cell files. Left: the crest lines produced by the waters oximation of the cell contours. Right: the adjacency graph is b
les are defined by the most linear paths of the graph.
sion Implementation
the general definitions are implemented in our study c we define the amalgamation kernel.
simple graph. At each vertex v of V is associated a se es describing the cell c represented by v:
circumscribed circle of c; cal centre abscissa; cal centre ordinate;
ent
stimates the likeness between vertices of distinct S-grap roduct of attribute differences: each attribute has the sa aluation. This coefficient tends toward 1 for similar ver ent or distant vertices.
d , be two given S-graphs. 0,1 , the coefficient is defined by:
| , | , 1 | | 1 | | | , | , es the case of too distant vertices from the case of potent
h term is a Bray-Curtis dissimilarity estimator based on of cells. If necessary, it can be completed with other cr
and shed built con-et of phs. ame rtic- tial-the
rite-4.2 Best Candidate Fun
This function gives the bes propose here the following
, 0,1 Our study case concerns su identical without geometric dent of the terms order and having a not empty image, lows defining the amalgama
, 0,1 The key point is the area ov It is defined as such that b point is developed in the res
5
Results and Pers
Several aspects are presente Points in the study are discu Amalgamation of differe radial lines over large areas
Fig. 5. C
Transition between two rupture. Note that this rupt the file tracking in image. T evolution.
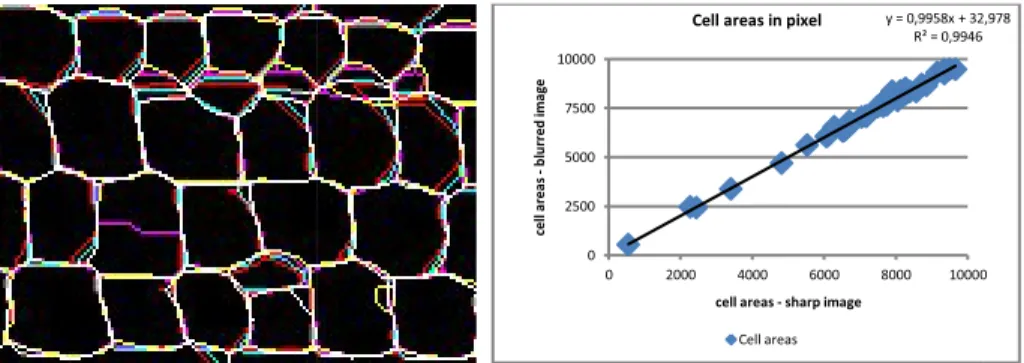
5.1 Influence of Blur on
Several studies have been which is the origin of adjac of crest and the cells area on
No significant gap is o (Fig. 6. Left). The colored
nction
st vertex fusion-able to a given vertex when it exists. expression:
, , 0
, ,
uccessive images analysis where the overlapped areas cal offsets. The function is commutative: it is indep d of the indexes i and j. Reduced to the subset of verti , becomes an involution without fixed points which ation kernel.
| and
verlapping (at least one vertex satisfies the upper proper bigger structure of the image is wholly overlapped. T sult section.
spective
ed to illustrate the robustness of the amalgamating meth ussed.
ent adjacency graphs of mosaic images allows tracking s of observation, as shown on two rings in (Fig. 5).
Cell files through the mosaic shown in Fig 1
successive rings is characterized by a cells morpholog ture does not affect the graphs amalgamation process, The approach is stable regarding semi global cell prope
n the Constitution of Cell Files
n initiated to check the blur independence of waters cency graphs. Experiment consisted in comparing the li
n an image progressively blurred.
observed, illustrating good correlation between cell ar lines illustrate the well-known over-segment linked to
We are pen-ices h al-rty). This hod. the gical but erty hed ines reas the
40 G. Brunel et al.
watershed algorithm. The W served differences. This m dients of the original image cent regions. Otherwise, th the coefficient of determina
Fig. 6. Left: superposition of c
blurred: crest lines are display tion; are thus displayed in whi due to the over-segmentation. variation is smaller when the c
5.2 Fusion Function
The fusion method is nearly mosaic images result proc amalgamating function usin
Fig. 7. Left, different overlap
graphs, the cell lines are disp essentially identical: difference
We merge two cells by vious §), and more specifica the relationship between lo nalize the choice. In addi
Waterfall method [20] could contribute to reduce the method uses the result of the watershed transform on g
e to produce a sequence of images by merging some ad he compared fiftieth areas are well adjusted (Fig. 6 rig ation and the slope of linear line tend towards 1.
crest lines produced by a watershed applied to a gradually im yed in different color, and colors are added in case of superp ite of the image points common to all crest lines; differences . Right: comparison of cell area a gradually image blurred. cell surface is higher.
y independent from a covering rate and a blur value in cess (Fig. 7). Invariance rises from the robustness of
ng only geometric criteria, insensitive to blur.
ping of two same distinct graphs. Right, the result of two fu played in black. Bottom, with a high overlapping the results
e comes from cell chosen (the least blurred).
choosing one of the vertices of the fusion kernel (see p ally the less blurred cell. The local blur estimator, based ocal dynamics and intensity differences [21], is used to tion, knowledge of stage displacement is an advanta
y = 0,9958x + 32 R² = 0,9946 0 2500 5000 7500 10000 0 2000 4000 6000 8000 10000 ce ll ar e a s - bl ur re d im ag e
cell areas - sharp image
Cell areas in pixel
Cell areas ob- gra- dja-ght): mage posi-s are The the the used s are pre-d on o fi-age, 2,978 0
especially to identify the p rently studying the possibili a term of the dynamics of c age to normalize the signatu nition of reliability coeffic results. Use this coefficient larly to homogenize the inte
5.3 Overlapping of Ima
The overlapping rate of im age. The gymnosperms (Fi variation. It is easy to fix t least one cell is wholly in o set to thirty micrometers, i. margin to process the distu giosperms (Fig. 8) present v difficult and is actually lef crometers so that the bigger These big cells, called v ages contain cells with size to 20 times larger than fiber
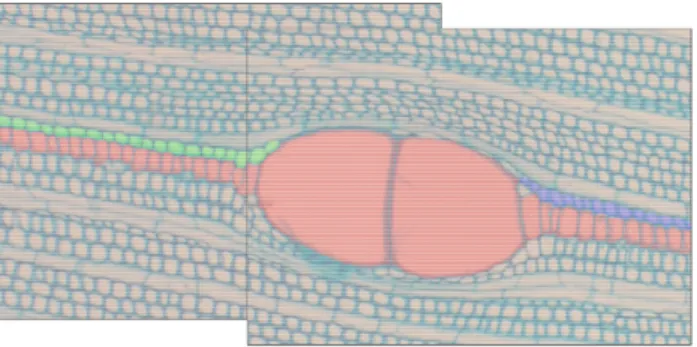
Fig. 8. Case of high structure
structure is totally recovered
In Fig. 8, the central fil structure coverage. Squash continuities in peripheral fi cannot correct. It is neces study of files relationship. C ly set the optimal covering solution for cases where the
otentially cells at merging, i.e. close enough. We are c ity of replacing in the function fusion the position terms cell: this point requires characterizing the local blur in ure of each cell. Such an indicator is presented in the d cients [22] and used to validate the produced quantitat t to correct measurements is seriously considered, parti ensities cells signing.
ages
ages depends on the size of the bigger structure of the ig. 5.) are composed of very regular cells, with weak s
the optimal overlap during the images shooting so tha overlapping area. The overlapping value is experimenta .e. close to the three biggest cell sizes. This gives a saf rbed biological configurations. On the other hand, the A very different sizes of structures: set the overlapping siz ft to the biologist. Here, the overlapping width is 400
r cell is wholly overlapped.
vessels, cause progressive or brutal cell deformations. e and shape strongly variable. It is usual to find vessels
rs.
e geometry changes: graphs fusion still works when the big
e (in red) is properly assembled, thanks to the full ve hing of fibers produced by vessel development causes d
iles (in green and blue), discontinuities that fusion meth sary to implement a method of files concatenation fr Complementary work will soon be engaged to automatic
by studying the distribution of cell sizes. Study will see e covering of vessels can only be partial.
cur-s by im- defi-tive icu- im-size at at ally fety An-ze is mi- Im-s 10 ggest ssel dis-hod rom cal-ek a
42 G. Brunel et al.
6
Conclusion
Image mosaic processing is a classical research thread in vision. We presented a ge-neric method for aggregating results by merging disjoint single-graphs, i.e. undirected graphs without loops; as an alternative to image stitching.
We defined a fusion function of vertices based on the evaluation of a similarity coefficient. This function is an involution without fixed point allowing the determin-ing of the amalgamatdetermin-ing kernel, i.e. the set of points that are two by two merged. The similarity coefficient does not depend on the graph structure, but only on attributes contained by vertices of the graphs. So it is adaptable to other attributes in regard to the study object.
We have developed and implemented this method in the context of tracking cell files in image mosaics describing large viewing zones. Cells individualization in each image was obtained by watershed algorithm; the obtained crests lines are used to de-fine the cells adjacency graph, which allows to identify cell files. It is dede-fined as the straightest paths whose adjacent nodes have similar attributes. Aggregation of files on consecutive images in the mosaic is realized by fusing graphs in order to avoid the inconvenience related to the stitching: radiometric equalization, image repositioning, blur correction and local deformation compensation…
Applying the method requires only to define explicitly the similarity coefficient and involution. The similarity function is defined by a product of normalized Bray-and-Curtis dissimilarity estimators describing the geometrical aspects -position and size- of cells which can potentially be merged. In case of merging, only the less blurred cell is retained and the local blur estimator is based on the relationship be-tween local dynamics and intensity differences. A study is engaged to introduce a component characterizing the dynamics of the cell, and so to be free of positioning criteria. Finally, the fusion method is insensitive to image blurring.
This generic method could be applied on other kinds of images of very high defini-tion when we wish to avoid stitching as for example satellite images.
Acknowledgment. The authors gratefully acknowledge Yves CARAGLIO and
Chris-tine HEINZ for their involvement in this work, their advices and availability. A big thank to Michael GUEROULT without whom the laboratory work would not have been possible.
This work is jointly funded by a doctoral fellowship of the Labex NUMEV, by the SIBAGHE Graduate School of the University Montpellier 2 and by the Scientific Council of the University Montpellier 2.
References
1. Lézoray, O., Grady, L.: Image processing and Analysis With Graphs. CRC Press (2012) 2. Cousty, J., Bertrand, G., Couprie, M., Najman, L.: Fusion graphs: merging properties and
3. Baldevbhai, P.J., Anand, R.S.: Review of graph, medical and color Image base Segmenta-tion Techniques. Journal of Electronical and Electronics Engineering 1, 1–19 (2012) 4. Peng, B., Zhang, L., Zhang, D., Yang, J.: Image segmentation by iterated region merging
with localized graph cuts. Pattern Recognition 44, 10–11 (2013)
5. Brown, M., Lowe, D.G.: Automatic Panoramic Image Stitching using Invariant Features. International Journal of Computer Vision 74, 59–73 (2007)
6. Lowe, D.G.: Distinctive image features from scale-invariant keypoints. International Jour-nal of Computer Vision 60, 91–110 (2004)
7. Clenti, C.: Architectures flot de données dédiées au traitement d’images par Morphologie Mathématique, Thèse de doctorat en morphologie mathématique. In: ENSMP,vol. (431) (2009)
8. Sun, C., Beare, R., Hilsenstein, V., Jackway, P.: mosaicing of microscope images with global geometric and radiometric corrections. Journal of microscopy 224, 158–165 (2006) 9. Vercauteren, T., Perchant, A., Malandain, G., Pennec, X., Ayache, N.: Robust mosaicing
with correction of motions distorsions and tissue deformations for In Vivo Fibered Micro-scopy. Medical Image Analysis 10, 673–692 (2006)
10. Thévenaz, P., Unser, M.: User-friendly Semiautomated Assembly of Accurate Image Mo-saics in Microscopy. Microscopy Research And Technique 70, 135–146 (2007)
11. Liang, C., Filion, L., Cournoyer, L.: Wood structure of biotically and climatically induced light rings in eastern larch (Larix laricina). Canadian Journal of Forest Research 27, 1538–1547 (1997)
12. Wilson, B.F.: The Growing Tree. The University of Massachusetts Press, Amherst (1970) 13. Gindl, W.: Cell-wall lignin content related to tracheid dimensions in drought-sensitive
aus-trian pine (pinus nigra). Iawa Journal 22, 113–120 (2001)
14. Brunel, G., Borianne, P., Subsol, G., Jaeger, M., Caraglio, Y.: Automatic characterization of the cell organization in light microscopic images of wood: application to the identifica-tion of the cell files. In: Plant Growth Modeling, Simulaidentifica-tion, Visualizaidentifica-tion and Applica-tions, vol. 4, pp. 58–65. IEEE Press (2012) ISBN 978-1-4673-0070-4
15. Kennel, P., Subsol, G., Guéroult, M., Borianne, P.: Automatic identification of cell files in light microscopic images of conifer wood. In: 2nd International Conference on Image Processing Theory Tools and Applications, pp. 98–103 (2010)
16. Sjodahl, M., Oreb, B.: Stitching interferometric measurement data for inspection of large optical components. Optical Engineering 41, 403–408 (2002)
17. Wyant, J.C., Schmit, J.: Large field of view, high spatial resolution, surface measurements. In: International Conference on Metrology and Properties of Engineering Surfaces, vol. 38, pp. 691–698 (1998)
18. Vincent, L., Soille, P.: Watersheds in Digital Spaces: An Efficient Algorithm Based on Immersion Simulations. IEE Transactions on Pattern Analysis and Machine Intelli-gence 13, 583–598 (1991)
19. Tremeau, A., Colantoni, P.: Regions adjacency graph applied to color image segmentation. IEEE Transactions on Image Processing 9, 735–744 (2000)
20. Beucher, S.: Watershed, Hierarchical Segmentation and Waterfall Algorithm. In: Proc. Mathematical Morphology and its Applications to Image Processing, pp. 69–76 (1994) 21. Ladjal, S.: Blur estimation in Natural Images. In: 15e congrès francophone AFRIF-AFIA
Reconnaissance des Formes et Intelligence Artificielle, pp. 112–124 (2006)
22. Brunel, G., Borianne, P., Subsol, G., Jaeger, M., Caraglio, Y.: Results reliability of the au-tomated identification of cell files in microscopic images of gymnosperms. In: 7th Interna-tional Conference on FucInterna-tional-Structural Plant Models (2013) (in submission)