HAL Id: tel-02477614
https://tel.archives-ouvertes.fr/tel-02477614
Submitted on 13 Feb 2020HAL is a multi-disciplinary open access
archive for the deposit and dissemination of sci-entific research documents, whether they are pub-lished or not. The documents may come from teaching and research institutions in France or abroad, or from public or private research centers.
L’archive ouverte pluridisciplinaire HAL, est destinée au dépôt et à la diffusion de documents scientifiques de niveau recherche, publiés ou non, émanant des établissements d’enseignement et de recherche français ou étrangers, des laboratoires publics ou privés.
Genetic diversity and structure of the superabundant
whitefly populations, vectors of viruses causing diseases
of cassava in three East African countries (Malawi,
Tanzania, and Uganda)
Hadija Mussa Ally
To cite this version:
Hadija Mussa Ally. Genetic diversity and structure of the superabundant whitefly populations, vec-tors of viruses causing diseases of cassava in three East African countries (Malawi, Tanzania, and Uganda). Agricultural sciences. Université de la Réunion, 2019. English. �NNT : 2019LARE0012�. �tel-02477614�
UNIVERSITÉ DE LA RÉUNION
Ecole Doctorale Sciences, Technologies et Santé (EDSTS-542)
UMR PVBMT Peuplement Végétaux et Bioagresseurs en Milieu Tropical CIRAD – Université de La Réunion
THESE
Présentée à l’Université de La Réunion pour obtenir le
DIPLOME DE DOCTORAT EN SCIENCES Discipline : Biologie des Populations
Diversité et structuration génétique des populations émergentes d’aleurodes vecteurs de maladies sur manioc en Afrique de l’Est (Malawi, Tanzanie, et Uganda)
Par
Hadija Mussa ALLY
Soutenue publiquement le 05 juillet sur le campus du Tampon, devant le jury suivant :
Bernard Reynaud, Professeur, Université de La Réunion, UMR PVBMT Président du Jury
Sharon Van Brunschot, Directeur de Recherche, University of Queensland Rapporteur
Jesus Navas-Castillo, Directeur de Recherche, IHSM-CSIC-UMA Rapporteur
Hélène Delatte, Chercheur, HDR, CIRAD UMR PVBMT Directeur de thèse
John Colvin, Professeur, NRI, University of Greenwich Co-Directeur de thèse
Encadrement de thèse
Pôle Recherche
Ecoles doctorales
LETTRE D’ENGAGEMENT DE NON-PLAGIAT
Je, soussigné(e) en ma qualité de doctorant(e) de l’Université de La Réunion, déclare être conscient(e) que le plagiat est un acte délictueux passible de sanctions disciplinaires. Aussi, dans le respect de la propriété intellectuelle et du droit d’auteur, je m’engage à systématiquement citer mes sources, quelle qu’en soit la forme (textes, images, audiovisuel, internet), dans le cadre de la rédaction de ma thèse et de toute autre production scientifique, sachant que l’établissement est susceptible de soumettre le texte de ma thèse à un logiciel anti-plagiat.
Fait à Saint-Denis le Signature :
Extrait du Règlement intérieur de l'Université de La Réunion (validé par le Conseil d’Administration en date du 11 décembre 2014) Article 9. Protection de la propriété intellectuelle – Faux et usage de faux, contrefaçon, plagiat
L’utilisation des ressources informatiques de l’Université implique le respect de ses droits de propriété intellectuelle ainsi que ceux de ses partenaires et plus généralement, de tous tiers titulaires de tes droits.
En conséquence, chaque utilisateur doit :
- utiliser les logiciels dans les conditions de licences souscrites ;
- ne pas reproduire, copier, diffuser, modifier ou utiliser des logiciels, bases de données, pages Web, textes, images, photographies ou autres créations protégées par le droit d’auteur ou un droit privatif, sans avoir obtenu préalablement l’autorisation des titulaires de ces droits.
La contrefaçon et le faux
Conformément aux dispositions du code de la propriété intellectuelle, toute représentation ou reproduction intégrale ou partielle d’une œuvre de l’esprit faite ans le consentement de son auteur est illicite et constitue un délit pénal.
L’article 444-1 du code pénal dispose : « Constitue un faux toute altération frauduleuse de la vérité, de nature à cause un préjudice et accomplie par quelque moyen que ce soit, dans un écrit ou tout autre support d’expression de la pensée qui a pour objet ou qui peut avoir pour effet d’établir la preuve d’un droit ou d’un fait ayant des conséquences juridiques ».
L’article L335_3 du code de la propriété intellectuelle précise que : « Est également un délit de contrefaçon toute reproduction, représentation ou diffusion, par quelque moyen que ce soit, d’une œuvre de l’esprit en violation des droits de l’auteur, tels qu’ils sont définis et réglementés par la loi. Est également un délit de contrefaçon la violation de l’un des droits de l’auteur d’un logiciel (…) ».
Le plagiat est constitué par la copie, totale ou partielle d’un travail réalisé par autrui, lorsque la source empruntée n’est pas citée, quel que soit le moyen utilisé. Le plagiat constitue une violation du droit d’auteur (au sens des articles L 2 et L 335-3 du code de la propriété intellectuelle). Il peut être assimilé à un délit de contrefaçon. C’est aussi une faute disciplinaire, susceptible d’entraîner une sanction.
Les sources et les références utilisées dans le cadre des travaux (préparations, devoirs, mémoires, thèses, rapports de stage…) doivent être clairement citées. Des citations intégrales peuvent figurer dans les documents rendus, si elles sont assorties de leur référence (nom d’auteur, publication, date, éditeur…) et identifiées comme telles par des guillemets ou des italiques.
Les délits de contrefaçon, de plagiat et d’usage de faux peuvent donner lieu à une sanction disciplinaire indépendante de la mise en œuvre de poursuites pénales.
:
Hadija Musa ALLY
1
DEDICATION
To my father, who have dedicated years of his life to make sure that I had access to education. Gone but never forgotten “to Allah we belong and truly to Him we shall return”.
2
ACKNOWLEDGEMENT
I would like to begin by thanking the Almighty God for enabling me to achieve my higher degree, I do believe my efforts alone without him could not have accomplished this.
My sincere gratitude goes to my supervisor Dr. Helene Delatte for being supportive throughout my studies. You played two major roles: as my supervisor you were very resourceful in giving me constructive ideas and comments. More than that you have been like a mother/sister especially during the time of my pregnancy until I delivered. Sincere thanks from me and my beloved husband, we thank you so much Helene.
Without forgetting Lulu, you saved my days, thanks for sharing experience and assisting me with laboratory work.
I would also like to further extend my gratitude to my cosupervisors Prof. J. Colvin and Prof. M. Gowda for positive inputs. Furthermore, to my theses committee team Dr. C. Omongo and Dr. S. Brunschot who gave me constructive comments during my study.
Additionally, I would also like to thank the CIRAD staffs, especially those who work at 3P. You have shown me a good cooperation throughout the time I was here, the language was not a barrier to our cooperation, thank you so much. These thanks also go to my PhD colleagues Cathleen, Alizee, Karim, Pauline and the list is too long thank you all.
I would also like to thank my parents for their undying support. My father for being close with me since I started school until death came upon him 13 years ago “to Allah we belong and truly to Him we shall return”. To my mum and my sister for taking care my daughters Fatma and Navil as well to my brothers, sister in-laws and uncles for being close to me.
Special thanks to my beloved husband Bakari Jiriwa. Despite being away from him, I felt like I was around him, thanks for your patience and for believing in me, taking care of our daughters, and helping my family as well. These thanks also go to my mother in-law and sister in-law for taking care of my little daughter Navil.
My research would not be possible without the money. Extended thanks go to all people who developed the African cassava whitefly project led by Prof. J. Colvin. Special thanks to our project donor Bill and Melinda Gates Foundation.
Finally, I want to thank my employer, the ministry of agriculture, under Tanzania Agriculture Research Institute (TARI) for giving me a study leave to pursue this course. I would also like to take this opportunity to thank my colleagues from TARI Ukiriguru for keeping me updated on important information.
3
RÉSUMÉ
Diversité et structuration génétique des populations émergentes d’aleurodes vecteurs de maladies sur manioc en Afrique de l’Est (Malawi, Tanzania, et Uganda)
Des pullulations d’aleurodes du complexe d'espèces cryptiques de Bemisia tabaci ont été associées à la propagation de deux maladies frappant le manioc en Afrique orientale: la maladie de la mosaïque du manioc (CMD) et, plus récemment (2000), la maladie de la striure brune du manioc (CBSD). Parmi les espèces d’aleurodes de ce complexe, l’espèce SSA2 a été associée à la première épidémie de CMD au cours des années 1990 en Ouganda. Cependant, SSA2 aurait été remplacée par SSA1 dans les années 2000, provoquant une recrudescence de CMD et de CBSD, participant à leur propagation dans plusieurs pays voisins. L’hypothèse défendue à ce jour expliquant la propagation de ces maladies vers le sud et l'ouest de l'Afrique incrimine cette nouvelle espèce considérée comme émergente et même invasive dans certains de ces pays.
Dans ma thèse, j’ai utilisé des données écologiques et des approches moléculaires (marqueurs mitochondriaux et nucléaires) afin de mieux comprendre les facteurs à l'origine des pullulations de vecteurs en Afrique de l'Est. Nous avons ainsi analysé : i) l’abondance, la diversité et la répartition des espèces (géographiques et plantes hôtes) sur un transect au travers trois pays : Ouganda, Tanzanie et Malawi, ii) la diversité génétique et la structure des populations actuelles des espèces de B. tabaci, iii) des échantillons de collections des années 90 (dans les zones forte incidence de CMD) qui ont été comparées aux populations actuelles (2017). Cette étude très large nous a permis d’avoir une image d’une situation plus complexe qu’attendue, en effet, l’espèce SSA1 a été détectée comme à l’origine de certaines des pullulations observées mais, également d’autres espèces, notamment IO et SSA1-SG3 ont aussi montrées cette capacité. Les foyers observés ne sont donc pas liés à une seule espèce en Afrique de l’Est.
De plus, nous avons montré que la communauté d'espèces et sa diversité génétique diffèrent d'un pays à l'autre, impliquant différentes situations épidémiologiques. L'analyse des anciens échantillons n'a pas mis en évidence l'implication d'une nouvelle espèce ni l'émergence d'une nouvelle population en 20 ans, bien qu’un changement de la dynamique au sein des groupes génétiques d’aleurode ait été observée. Nos résultats ont apporté de nouvelles connaissances sur les populations très abondantes sur manioc en Afrique orientale et permettrons de proposer des mesures de contrôle ciblées pour les populations locales.
4
ABSTRACT
Genetic diversity and structure of the superabundant whitefly populations, vectors of viruses causing diseases of cassava in three East African countries (Malawi, Tanzania, and
Uganda)
High populations of the whitefly, Bemisia tabaci Gennadius, a cryptic species complex have been associated with the vectoring and spread of viruses causing two diseases of cassava in East Africa: the cassava mosaic disease (CMD) and cassava brown streak disease (CBSD). Among the B. tabaci species, sub-Saharan Africa 2 (SSA2) was the vector associated with an epidemic of CMD since the 1990s in Uganda. However, this species is now replaced by the sub–Sahara Africa 1 (SSA1) and led to development of another epidemic by CBSD since the mid 2000s. The spread of both diseases toward South and West Africa is feared with this new supposed invader.
In my thesis I have used ecological data and molecular approaches (mitochondrial and nuclear markers) to better understand the factors driving the presence of the superabundant whitefly populations on cassava in East Africa. We have analyzed: i) species abundance, diversity and distribution (geographic and host plants) along a transect survey over three East African countries: Uganda, Tanzania, Malawi, ii) the genetic diversity and structure of current populations of B. tabaci species, and iii) comparing genetic changes between the old and new populations collected in 1997 and 2017, respectively. This study involved a large number of samples (n = 3563) provided insights of a more complex picture than expected. SSA1 was found to be the source of some observed outbreaks although SSA1–SG3 and IO species, have also shown this capability. The observed outbreaks are therefore not just related to a single species in East Africa.
In addition, we showed that the species community and its genetic diversity differ from one country to another, involving different epidemiological situations, without any clear pattern of invasion detected between the countries. Analysis of old samples did not show the involvement of a new species or the emergence of a new population in 20 years, although the dynamics within the whitefly genetic groups was observed over time. Our results contributed new knowledge on the super abundant populations on cassava in Eastern Africa and will facilitate the development of targeted control measures for these local populations.
5
6
Table of content
RÉSUMÉ ...3
ABSTRACT ...4
Chapter 1: literature review ...22
1.1. Importance of cassava as a staple food in sub–Sahara Africa, with focus on East Africa ..22
1.2. Whiteflies ...24
1.3. Bemisia tabaci classification ...26
1.5. Molecular tools used for molecular taxonomic issues ...30
(a) Amplified fragment length polymorphism (AFLP) ...30
(b) Restriction fragment length polymorphism (RFLP) ...30
(c) Random amplified of polymorphic DNA (RAPD)...30
(d) Sequence characterized amplified regions (SCAR) ...32
1.6. Other nuclear markers for population studies ...32
(a) Microsatellite markers ...32
(b) Restriction site associated DNA markers (RADseq) ...36
1.7. Biology of B. tabaci ...36
1.7.1. B. tabaci developmental stages ...36
1.7.2. B. tabaci host plants utilization ...40
1.8. Whitefly impact on agriculture...42
1.9. Bemisia tabaci distribution ...49
1.9.1 Worldwide distribution of B. tabaci invasive species ...49
1.9.2. B. tabaci distribution in sub–Sahara Africa ...50
1.9.2.1. The cassava colonizing group ...50
1.9.2.2. Non–cassava colonizing group ...54
1.10.1. History of the CMD pandemic from the initial outbreak in 1920s ...58
1.10.2. Factors driving the whitefly upsurges in East Africa, partly responsible of the spread of CMD ...59
7
1.10.22. Abiotic factors (temperature and rainfall) ...60
1.11. Study area: East Africa countries geography, demography, land use and agroecological zones ...62
1.12. Study objectives ...65
References used in the general introduction and literature review sections ...67
Page left purposely ...85
Chapter 2: What has changed in the outbreaking populations of the severe crop pest whitefly species in cassava in two decades? ...86
Introduction ...88
Material and methods ...90
Results ...98
Discussion ... 106
Acknowledgements ... 110
Supplementary information: ... 112
References... 124
Chapter 3: B. tabaci species distribution in Tanzania and Uganda: their genetic diversity and structuring according to agroecological zones, host plant utilization and population dynamic status ... 132
Introduction ... 134
Material and methods ... 136
Results ... 146 Discussion ... 167 Conclusion ... 174 Acknowledgements ... 175 Supplementary information ... 176 References... 183
Chapter 4: The whitefly, Bemisia tabaci, species distribution and genetic diversity in Malawi . 203 Introduction ... 205
Materials and methods ... 206
Results ... 212
8
Acknowledgements ... 225
Supplementary information accompanied this chapter ... 226
Chapter 5: General discussion ... 230
Conclusion and perspective ... 238
9
List of figures
Figure 1.1: Examples of cassava products. Sources Dada (2010), www.farmsteadmarket.com,
https://www.medicalnewstoday.com, https://www.poukouhalalfood.com...21
Figure 1.2: Adults B. tabaci, photo: A. Franck, CIRAD, UMR PVBMT©……….23 Figure 1.3: Distribution of genetic divergences based on the Kimura-2 parameter analysis for
taxonomic levels as described by Lee et al., (2013) ………...25
Figure 1.4: Different B. tabaci species obtained through mtCOI sequences according to Mugerwa
et al., (2018). ... 27
Figure 1.5: Detection of cassava whitefly populations based on RFLP (Ghosh et al. 2015). ... 31 Figure 1.7: Bayesian clustering analysis presenting different B. tabaci species collected from
different agroecological zones, different genetic clusters are seeing within the same species described by Hadjistylli et al. (2016). ... 33
Figure 1.8: Population structure of B. tabaci showing hybridization between SSA1 and its
sub-groups SG1 and SG2 (Wosula et al. (2017). ... 35
Figure 1.9: Different developmental stages of B. tabaci MEAM1 on cabbage leaves (photos are
from A Franck, CIRAD UMR PVBMT©). ... 37
Figure 1.10: B. tabaci species host range (a) according to botanical families (b) according to plant
order showing nine orders with asterisks are commonly shared by most of B. tabaci species as described in Malka et al. (2018). ... 39
Figure 1.11: B. tabaci effect (A) sooty mold on cassava leaves, (B) cotton field infested with
whitefly, (C) unregular ripening on tomato, (D) tomato plant infected with tomato yellow leaf curl begomovirus transmitted by whitefly, photo source: A) NRI library, B) Toscano et al. (1998), C) http://blogs.ifas.ufl.edu/pestalert/2017/02/10/whitefly-alert/ , D) https://www.lsuagcenter.com. ... ………41
Figure 1.12: Diagram of the main groups of plant viruses transmitted by whiteflies, according to
the structure of their viral particles, their mode of transmission and their genomic organization. Described by Navas-Castillo et al (2011). ... 43
10
Figure 1.13: ToCV leaf symptoms in comparison to healthy plants and ToCV-infected plants
Interveinal yellowing, necrotic flecking, rolling and thickening of the leaf blade are shown on entire plants (A), leaves (B) and leaflets (C), illustration from Navas-Castillo et al. (2014)... 45
Figure 1.14: Symptoms expression (a) leaf chlorosis and distortion following infection with CMD
(b) Leaf chlorosis after CBSD infection (c) brown root necrotic following infection with CBSD, photo A and B were taken in Tanzania following a field survey conducted in February 2016 and C is from the NRI library... 47
Figure 1.15: Geographical distribution of B. tabaci, with increased SSA1 and reduction of SSA2
presented by yellow dots during (A) 1997 – 1999 (B) 2000 – 2001 (C) 2002 – 2003 (D) 2004 – 2010 (Legg et al. 2014b). ... 55
Figure 1.16: Pattern of spread of the pandemic of severe cassava mosaic disease through East and
Central Africa between 1997 and 2009. Arrows indicate the direction of spread of the pandemic ‘front’ as described by Legg et al. (2014b). ... 57
Figure 1.17: African map showing five regions as described by United Nations geoscheme for
Africa ……….61
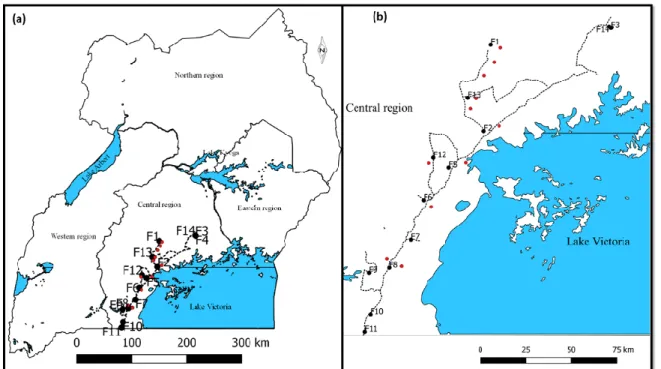
Figure 2.1: Geographical locations of sampling surveys conducted in (a) Uganda as a whole and
(b) part of the central region in which sampling was conducted.in February 1997 and February 2017. ... 91
Figure 2.2: Posterior probability phylogenetic tree generated by MrBayes by the Markov chain
Monte Carlo method for all the different mtDNA COI haplotype sequences (651bp) of 1997 and 2017 (n = 14) together with reference sequences (n = 12, in bold) obtained from GenBank for comparison... 99
11
Figure 2.3:. STRUCTURE bar plots for SSA1 and SSA2 populations collected from Uganda (a)
for 33 populations of SSA1 arranged by subgroup, site and year at K = 2 and 3, e.g., K2(a) and K3(a) with recessive allele option turned on, and K2(b) and K3(b) without the option turned on.
(b) For 102 randomly selected SSA1-SG1 and SSA1-SG2) together with 17 individuals of SSA2
at K = 3 and 4. The black line within SSA1 separates individuals of SSA1-SG1 and SSA1-SG2 for 2017 and SSA1-SG1 for 1997. ... 103
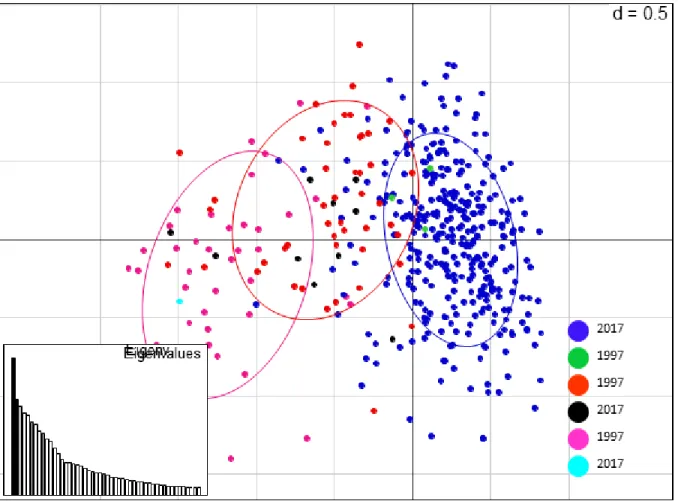
Figure 2.4: Principal component analysis of B. tabaci populations from Uganda. Colours show
the genetic clusters found with the Bayesian analysis of structure at K = 3. Each dot represents one individual. The blue cluster is dominated by the 2017 population, whereas the pink and orange clusters are dominated by the 1997 population. In each cluster there are few individuals of different years mixing within clusters……….105
Figure 3.1: Sampling sites where adult whitefly were collected from (A) uganda and (B) Tanzania
………143
Figure 3.2: B. tabaci species distribution per field A) Tanzania n = 1983 and B0 Uganda n =
661………147
Figure 3.3: Host plants of B. tabaci species distribution collected from different agroecological
zones in A) Tanzania B) Uganda, others representing low frequency occurred species (Uganda 1, SSA11, Sudan II, EA1 and unidentified species………...151
Figure 3.4: Mr. Bayes phylogenetic tree generated using 102 mtCOI sequences selected from a
total of 1071 long sequences with 595 nt obtained from adult B. tabaci (cassava and non-cassava) and 14 reference sequences from GenBank. All bold sequences represent references from GenBank and four new identified groups (>4% of nucleotide identity from the closest B. tabaci sequence)………..159
Figure 3.5: Different K populations of B. tabaci (A) SSA1 from Tanzania (TZ) and Uganda (UG)
(B) SSA1 from Tanzania (C) SSA1-SG3 from Tanzania and (D) Non-cassava species. Structure bar plots are based on 12 microsatellite loci. Individuals were arranged according to mtCOI species assignation and separated by black line………...………165
12
Figure 4.1: Malawi sampling sites, sampling made from 16 to 23rd of November 2016………..209
Figure 4.2: B. tabaci species distribution per host plant collected in Malawi……….215 Figure 4.3: Phylogenetic tree generated by Mr. Bayes involving the 30 different haplotypes
collected from different districts in Malawi. Reference sequences obtained from the GenBank are in bold. ... 217
Figure 4.4: Different population structures of B. tabaci (A) the whole dataset (n = 560) with four
B. tabaci species, (B) The SSA1 with its three subgroups (n = 322) and (C) The SSA1–SG3 (n =
286) collected from Malawi. Structure bar plot based on 12 microsatellite loci. Individuals were arranged according to mtCOI and separated by black line. For each data set optimal K selected by STRUCTURE HARVESTER. ... 221
Figure 5.1: Phylogenetic tree generated by Mr.Bayes with all the different B. tabaci mtCOI
haplotypes (n = 131) from this PhD sampled from Malawi (MW), Tanzania (TZ) and Uganda (UG) together with 17 reference sequences obtained from Genebank. The tree was rooted by B. afer. ... 231
Figure 5.2: A map showing B. tabaci species distribution according to country surveyed: Malawi
(n = 562), Tanzania (n = 1967) and Uganda (n = 650) ... 231
Figure 5.3: Different K populations of B. tabaci (A) SSA1 from Malawi (MW), Tanzania (TZ)
and Uganda (UG), (B) SSA1–SG3 from Malawi and Tanzania (C) Med from Malawi, Tanzania and Uganda. Structure bar plots are based on 12 microsatellite loci. Individuals were arranged according to mtCOI species assignation and separated by a black line. For each dataset the two best K are presented and were selected by STRUCTURE HARVESTER……….235
List of tables
Table 1.1: Survival and development from egg to adult of two B. tabaci putative species on eigt
different host plants. Table extracted from Xu et al 2011………...37
Table 1.2: B. tabaci species identified on cassava and other plant hosts from sub-Sahara
13
Table 1.3: Different climatic conditions experienced in Tanzania, Malawi and Uganda, the order
is in accordance with the dominance per country (https://en.climate-data.org/)...63
Table 2.1:. Location and information of adult whiteflies collected in Uganda. ... 91 Table 2.2: Characteristics of loci used for nuclear analysis. ... 93 Table 2.3: B. tabaci haplotype distribution within fields F1–F14 (Table 1) sampled 1997 or 2017
... 101
Table 3.1: Host plants and location of sampled adult B. tabaci in Tanzania and evidence of disease
oncassava………138
Table 3.2: Different B. tabaci haplotypes and their distribution found during the 2016 and 2017
surveys in Tanzania and Uganda……….155
Table 3.3: Population genetic diversity indices among the B. tabaci found in Tanzania and
Uganda……….161
Iist of supplementary tables
Supp Table 2.1: Population genetic diversity indices within B. tabaci collected in 1997 and
2017……….123
Supp Table 3.1: Characteristics of microsatellite loci used in the nuclear analysis……….178 Supp Table 3.2: Host plant utilization (A) all plants sampled from Tanzania and B) from Uganda
……….179
Supp Table 3.3: Frequency of null allele observed in each locus per B. tabaci species………...181 Suppl Table 3.4: Pairwise FST values among SSA1 populations sampled from Tanzania and
Uganda based on 12 microsatellites, individuals n > 5 from one site considered as a population. Non-significant FST values are indicated in bold with P < 0.05 ………...182
14
List supplementary figures
Supp Figure 2.1: Species distribution per field for samples collected in Uganda 1997………...112 Supp Figure 2.2: Species distribution per field for samples collected in Uganda 2017………...113 Supp Fig. 2.3: Histogram presenting the frequency of allele distribution per each microsatellite
locus used and in each sampling year………...114
Supp Fig 2.4a: Plot showing the number of genetic clusters K against the ΔK estimator derived
from STRUCTURE HARVESTER using Evano et al. (2005)method……….121
Supp Fig 2.4b: Plot showing the number of likely genetic clusters (K) against the estimated Ln
probability of data………121
Supp Fig 2.5: DAPC analysis of B. tabaci population collected from Uganda, Presented at K=3,
Cluster one and two contained 2017 population while cluster three contained 1997 population………122
Supp Fig. 3.1: DAPC analysis performed at K = 4 on 729 individuals of SSA1 species (n Tanzania = 288, n Uganda=and 441). Each cluster represents the dominant individuals within SSA1 species……….176
Supp Fig. 3.2: Different population structures bar plot of B. tabaci (A) Med from Tanzania and
Uganda analysed with 7 microsatellite markers (B) IO (Tanzania) analysed with 12 microsatellite markers (C) SSA12 and SSA13 from Uganda analysed with nine markers. Individuals were arranged according to mtCOI per site but due to few individuals observed per site for Med and SSA12 and SSA13 they were merged but for IO was presented per site. Black line separated population. For each data set optimal K selected by STRUCTURE HARVESTER………177
Supp. Fig. 4.1. (A) Plot showing the number of likely genetic clusters (K) against the estimated
Ln probability of data (B) Number of genetic clusters K assessed with the ΔK estimator derived from STRUCTURE HARVESTER using Evanno method for all dataset (n = 560) sampled from Malawi……….225
15
ABBREVIATION
ACMV African cassava mosaic virus
AFLP Amplified fragment length polymorphism
AnSL Africa non–silver leafing
ASL Africa silver leafing
B. afer Bemisia afer B. tabaci Bemisia tabaci
CBSD Cassava brown streak disease
CBSV Cassava brown streak virus
CdTV Chino del tomate virus
CMD Cassava mosaic disease
CMV Cassava mosaic virus
DNA Deoxyribonucleic acid
DRC Democratic Republic of Congo
EA East Africa
EACMV East Africa cassava mosaic virus
EACMV-UG East Africa cassava mosaic virus Uganda variant
EST Esterase
FAO Food and agriculture organization
IO Indian Ocean
ITS Internal transcribed spencer
HWE Hardy-Weinberg equilibrium
MCMC Marcov chain monte Calo algarithm
MEAM1 Middle East-Asia Minor-1
Med Mediterranean
Ms Former name of IO
mtCOI Mitochondrial cytochrome oxidase 1 NextRAD Next restriction site associated DNA
PCR Polymerase chain reaction
PHV Pepper huasteco virus
PCA Principle component analysis
PYLCV Pepper yellow leaf curl virus
RAPD Random amplified of polymorphic DNA
RCA Central Africa Republic
rDNA Ribosomal deoxyribonuceic acid
SCAR Sequence characterized amplified regions
SG Subgroup
SNPs Single nucleotide polymorphism
SSA Sub-Sahara Africa
ssDNA Single stranded DNA
ssRNA Single stranded ribonucleic acid
16 ToCMoV Tomato chrolotic mottle virus
ToCV Tomato chrolosis virus
TYLCV Tomato yellow leaf curl virus
Ug Uganda
Ugsp Uganda sweetpotato
US United states
ZHJ B. tabaci species originated from China
Units ~ Approximately oC Degree celcius $ Dollars % Percent N Number Km Kilometre Min Minute S Second µl Microlitre ± Plus or minus
17
18 GENERAL INTRODUCTION
Crop protection plays a key role in safeguarding global crop production against losses, thereby helping to meet the increasing demand for food caused by a growing human population (Oerke and Dehne 2004). Crop diseases, insect pests and weeds are among the factors causing extensive losses in the yield and quality of many cultivated crops.
In this era of climatic change, cassava is considered as one of the most important food security crops particularly in sub–Sahara Africa (SSA) due to its ability of tolerating drought. Its starchy roots are a major source of calories for more than 800 million people around the world. Despite its importance, the crop is affected by two groups of viruses cassava mosaic begomoviruses (CMBs) and cassava brown streak ipomoviruses (CBSIs), which cause cassava mosaic disease (CMD) and cassava brown streak disease (CBSD), respectively. CMBs and CBSIs are transmitted by the whitefly species Bemisia tabaci (Legg and Ogwal 1998, Maruthi et al. 2017). Masinde et al. (2016) observed the maximum yield losses attributed by CMD and CBSD were 56.7% and 74.0% respectively from Migori county in Kenya. Severe epidemics of CMD and CBSD have been facilitated by the rapid increase in whitefly populations (B. tabaci) (Legg and Ogwal 1998, Legg 1999, Legg et al. 2002, Maruthi et al. 2017).
B. tabaci affects plants by feeding, excretion of honey dew which is a substrate for sooty
mold fungi, however by far the largest impact is caused by the transmission of viruses. It transmits over 300 plant viruses including CMBs and CBSIs (Hendrix et al. 1992, Navas-Castillo et al. 2000, Navas-Castillo et al. 2011, Navas‐Castillo et al. 2014, Legg et al. 2015). The whitefly B. tabaci has been considered a complex of over 40 morphologically indistinguishable cryptic species. Species differentiation within this complex was based on the use of molecular markers due to their cryptic status. The core region of the mitochondrial cytochrome oxydase I gene (mtCOI) has been used as a species barcode. The B. tabaci species were found to differ in genetic composition, insecticide resistance, host plant utilization, ability to induce physiological disorders, virus transmission capacities, ability to host different communities of secondary endosymbiont and their differential geographical distribution (De Barro et al. 2011, Mugerwa et al. 2018).
19 Furthermore, some B. tabaci species are not able to hybridise (Maruthi et al. 2004, Omondi et al. 2005b, Liu et al. 2007, Wang et al. 2010, Xu et al. 2010, Tsueda and Tsuchida 2011, Saleh et al. 2012).
Two of these species have invaded a large part of the World: Middle East Asia minor I (MEAM1) and Mediterranean (MED), while others are continental restricted including sub–Sahara Africa (SSA1 to SSA13, except SSA2 that can also be found in Southern Europe (Banks et al. 1998, Hadjistylli et al. 2015). The first five SSA (SSA1 – SSA5) species prefer cassava plants for feeding and reproduction (Wang et al. 2011, Barbosa et al. 2014, Laarif et al. 2015, Wosula et al. 2017, Mugerwa et al. 2018). The SSA2 species was previously, associated with CMD epidemic on cassava in Uganda during the initial outbreak (1990s) (Legg et al. 2002). Nevertheless, in current studies the increase in abundance of whitefly population was by SSA1 with its two subgroups (SG1 and SG2) in all CMD and CBSD affected regions in Africa (Legg et al. 2002, Maruthi et al. 2005, Sseruwagi et al. 2005, Mugerwa et al. 2012, Legg et al. 2014b, Tajebe et al. 2015a). The distribution of whiteflies in Africa varied with SSA1 found throughout but dominated in east Africa (Ghosh et al. 2015, Tajebe et al. 2015a, Wosula et al. 2017, Mugerwa et al. 2018).
In this study, I used two molecular markers, the sequencing of the mtCOI barcoding region and a set of nuclear markers, to understand 1) B. tabaci species diversity according to host species and countrywide distribution in East Africa, 2) the genetic diversity and population gene flows within species from different countries, 3) to understand the population and species dynamics, and potential genetic diversity changes over time by comparing whitefly samples collected during the initial whitefly outbreak (1997) and the current outbreak of 2017 in Uganda.
20
21 Figure 1. 1: Examples of cassava products. Sources Dada (2010), www.farmsteadmarket.com, https://www.medicalnewstoday.com, https://www.poukouhalalfood.com.
22
Chapter 1: literature review
1.1. Importance of cassava as a staple food in sub–Sahara Africa, with focus on East Africa
Cassava is a woody shrub, considered as an important staple food crop in many countries of tropical and subtropical areas (Legg et al. 2006). Cassava originates from South America, it was introduced in Africa by the Portuguese during the 16th century on the west coast of Africa (Jones 1959) and later was introduced in East Africa via Madagascar and Zanzibar (Fauquet and Fargette 1990). This crop is produced in 102 countries with a majority of them found in Asia and Africa (FAOstat 2017). Its adaptation to marginal land makes it affordable for most subsistence farmers in Africa, because of the low cost of production. Cassava’s ability to tolerate drought makes it a food security crop (Jarvis et al. 2012, Reincke et al. 2018) and feeds more than 800 million people, majoriy of them are from sub–Sahara Africa (FAOstat 2017).
Cassava is valued for its different usages (Fig. 1.1): the roots are used as a source of carbohydrate, leaves as a leaf vegetable nutritionally important in fibre, vitamin A and B, protein and essential amino acids, while the stem as a source of fuel as well as planting material for the next season (Zhu et al. 2015). The roots can be harvested in piecemeal manner which provides food throughout the year as fresh meal, or it can be dried and processed into flour. The cassava flour can be sold in local markets or processed into value added food products such as in bakery (Hillocks et al. 2002).
Nigeria, Democratic Republic of Congo, Thailand, Indonesia, Brazil, Ghana, Angola, Cambodia, Viet Nam and Mozambique are among the 10 largest cassava producers in the world. Majority of these countries are from Southeast Asia and West Africa (FAOstat 2017). In Asia, cassava is mainly used for starch production or to feed animals, while in Africa cassava is used for human consumption (Howeler et al. 2013, Parmar et al. 2017). Africa produces 57% of the global cassava production with more than 20% coming from Nigeria alone (Bennett 2015, FAOstat 2017).
In East Africa, Tanzania is the leading producer. The crop is grown in different agroecological zones, but the main production areas include the Lake Zone (Mwanza Mara and
23 Figure 1. 2: Adults B. tabaci, photo: A. Franck, CIRAD, UMR PVBMT©.
24 Shinyanga), Coast regions (Lindi, Mtwara, Tanga, Zanzibar), Kigoma and Ruvuma areas. Being the third most important crop in the country, it contributes to 7.8% of the total calories in Tanzanian diet after maize and rice (Cochrane and D'Souza 2015).
Uganda is the second largest cassava producer in East Africa, and the crop also ranks second in importance after plantain (Haggblade and Dewina 2010). Per capita consumption the crop accounts for about 11% of calories intake (Haggblade and Dewina 2010). Cassava is grown in all regions of Uganda normally in mixed farming systems and about 9% of farmers grow the crop as a cash crop (Otim-Nape and Zziwa 1990).
Malawi is the largest cassava producer in Southern African zone. The crop ranks second after maize and as being drought resistance, it gained popularity following drought intervention in late and mid 1990s when maize was reduced by half of its normal production (Kambewa 2010, Minot 2010). The crop feeds 30 to 40% of Malawian population (Chipeta and Bokosi 2013) and also contributes to 7% of calories intake per capita consumption (Minot 2010).
Despite increases in cultivated land, significant reductions in cassava yields have been reported (FAOstat 2017). Cassava yield has the potential to reach up to 80.0 tonnes per ha under optimal conditions, however, the World average yield is only 12.2 tonnes, with much of the low productivity coming from sub–Saharan Africa (Howeler et al. 2013). Several factors attribute to this loss among them are poor soil fertility, early water stress, altitude, poor agriculture practices, inadequate extension services, poor processing as well as pests and diseases (Legg 1999, Moyo et al. 2004, Fermont et al. 2009, Patil et al. 2015, Reincke et al. 2018). Among the diseases, CMD and CBSD are the most prominent together with the insect pest whiteflies.
1.2. Whiteflies
Whiteflies are sap sucking insects. The name whitefly is derived from their white appearance due to the deposition of fine white powdery wax over their four wings and body (Fig.1.2). Whiteflies are not true flies, they are in the same order of insect as scales, aphids and mealy bugs of the order Hemiptera.
25 Figure 1. 3: Distribution of genetic divergences based on the Kimura-2 parameter analysis for taxonomic levels as described by Lee et al., (2013).
26 They belong to the Aleyrodidae family which is further divided into two sub families: Aleurodicinae which include, Aspidiotus destructor (Mackie) and Aleurodicus dispersus (Russell) and Aleyrodinae. More than 1550 species of whiteflies have been classified (Ko 2001, Martin 2003). Aleyrodinae ranks the largest sub family with around 140 genera, among them one of economic importance pest and vector known as B. tabaci.
1.3. Bemisia tabaci classification
The first B. tabaci specimen was found in Greece (1897), it was collected on tobacco and was described as a new genus, Bemisia inconspicua as a "type" species (Quaintance and Baker 1914, Gill 1990). It’s only in 1957 that this species, along with a dozen other species of whiteflies, were put synonimized (grouping of species) in the same taxon: Bemisia tabaci (Russell 1957).
The classification of whiteflies is based on the morphology of the last larval stage or pupa than on adults, which differ very little morphologically (Gill 1990). The observation of a large morphological variability of the last larval stage, related to the physical characteristics of the host plant, led the taxonomists to synonymize numerous species. Nevertheless, the subsequent variations reported in pupal morphology depended on host plant (Russell 1948), leaf surface character (Mound 1963), atmosphere (temperature) as well as surrounding environment (Sundararaj and David 1992).
Due to that discrepancy some populations were not differentiated. Other factors were considered in classifying populations which were based on life history (Costa and Brown 1991, Viscarret et al. 2003), induction of physiological disorders (Costa and Brown 1991, Cohen et al. 1992), mating behaviour (Bethke et al. 1991), or insecticide resistance (Dittrich et al. 1990, Costa and Brown 1991). This is the period where the concept of biotypes or races was introduced (Brown et al. 1995a). As a result, several studies considered B. tabaci as a species complex (Perring et al. 1993, Bellows Jr et al. 1994, Oliveira et al. 2001, De Barro et al. 2011, De Barro 2012, Lee et al. 2013).
27 Figure 1. 4: Different B. tabaci species obtained through mtCOI sequences according to Mugerwa et al., (2018).
28 Different approaches have been used to study population diversity and differentiation within each of the species complex, but the first true taxonomic differentiation between B. tabaci species was performed with the help of molecular tools. Those tools included several molecular markers such as polymerase chain reaction (PCR) amplified fragment length polymorphism (AFLP), or AFLP-PCR, the technique of PCR–restriction fragment length polymorphism (PCR-RFLP), microsatellite markers, Rad-seq, or sequencing of mitochondrial markers (Cytochrome oxidase 1, mtCOI) (Costa and Brown 1991, Wool et al. 1991, De Barro et al. 2003, De Barro et al. 2005, Sseruwagi et al. 2005, Delatte et al. 2006, Ma et al. 2007, Hadjistylli et al. 2016, Wosula et al. 2017).
Using mtCOI, 11 major B. tabaci genetic groups with 24 potential species were described with 3.5% of nucleotides of divergence between the morpho-species (Boykin et al. 2007, Dinsdale et al. 2010). The number of cryptic species increased from 24 to 28 (De Barro et al (2011), to 31 (Lee et al., 2013) and currently believed to be over 40 (Mugerwa et al., 2018). Lee et al., (2013) observed that the 31 species revealed an average of intraspecific genetic divergence of 1.2% (0.2 to 3.9%) and an average of interspecific genetic divergence of 15.7% (4.2 to 24.1%). These authors therefore proposed to raise the "threshold bar" samples of 3.5% of the species within the complex to 4% (Fig. 1.3).
Several species have been identified in SSA (see section 1.9) (Fig. 1.4). Although some B.
tabaci species such as MEAM1 and Med live in sympatry, biologically, they cannot reproduce (De
Barro et al. 2000, Saleh et al. 2012). Lack of hybridization between other B. tabaci species were also reported previously (Maruthi et al. 2004, Omondi et al. 2005b, Liu et al. 2007, Wang et al. 2010, Xu et al. 2010, Tsueda and Tsuchida 2011, Saleh et al. 2012).
29 Figure 1. 5: Detection of cassava whitefly populations based on RFLP (Ghosh et al. 2015).
30
1.5. Molecular tools used for molecular taxonomic issues (a) Amplified fragment length polymorphism (AFLP)
This method relies on the presence or absence of polymorphism within restriction enzyme sites. For example, the procedure was used to differentiate fall army worms strains collected from corn and forage grasses at Louisiana State (McMichael and Prowell 1999). Variation of Med and MEAM1 species was accessed using AFLP from populations in Brazil and China Cervera (2000). The AFLP technique was also used to study genetic relationship among B. tabaci species, as well as differentiating MEAM I and Med in China (Guo et al. 2012).
(b) Restriction fragment length polymorphism (RFLP)
In this technique polymorphism is determined by variation on the length of DNA fragment produced by restriction enzymes (Fig. 1.5). For instance, the method used to identify molecular phylogeny and evolutionary relationships among four mosquito (Diptera: Culicidae) species from India (Sharma et al. 2013). Similar approach was used to understand the genetic diversity of B.
tabaci collected from DRC, Malawi, Tanzania and Uganda (Ghosh 2015). The RFLP technique
was used in other studies to understand genetic diversity of different B. tabaci species (Bosco et al. 2006, Shoorcheh et al. 2008, Rocha et al. 2011, Queiroz et al. 2016).
(c) Random amplified of polymorphic DNA (RAPD)
The RAPD technique uses a single primer for amplification. The technique was applied in molecular ecology for studying taxonomic identity, kinship relationships, analyse mixed genome samples or create specific probes (Hadrys et al. 1992). In insects, RAPDs have widely been used for example to study aphid polymorphism (Black et al. 1992) and many other species. Studies using this marker were also, conducted on whiteflies, revealing first distinction between “biotype B” (former name of MEAM1) and non-B biotypes within the Brazilian B. tabaci populations (Lima et al. 2000, Lima et al. 2002). RAPD was also used to differentiate the cassava B. tabaci species from non–cassava species from B. tabaci collected in the major cassava growing area in Africa (Abdullahi et al. 2003). Other studies also, reported the genetic variation within B. tabaci by using similar procedures (De Barro and Driver 1997, Guirao et al. 1997, Horowitz et al. 2003, Delatte et al. 2005).
31 Figure 1. 6: Different structure patterns of honey bee collected from the Southern West of Indian Ocean archipelago, described by Teacher et al. (2017).
32
(d) Sequence characterized amplified regions (SCAR)
A locus specific marker is another PCR based tool. The primer can be designed following sequence analysis of RAPD or AFLP fragments (Agustí et al. 2000, Khasdan et al. 2005). Donkers–Venne (2000) developed a SCAR marker that were able to distinguish three species of major agriculture pest of Meloidogyne incognita, M. javanica and M. arenaria (Donkers-Venne et al. 2000). Correspondingly, two primer sets of SCAR was developed to study different B. tabaci populations (Ko et al. 2007). Further, the SCAR technique was used to understand the dynamic of species complex of MEAM1 and Med B. tabaci population in Israel (Khasdan et al. 2005, Queiroz et al. 2016) and India (Shankarappa et al. 2007)
1.6. Other nuclear markers for population studies (a) Microsatellite markers
These are tandem repeat motifs ranging from two to six base pairs occurring within the nuclear genome of organism. They are widely distributed consisting of coding and non–coding regions (Zane et al. 2002, Kalia et al. 2011). Being highly polymorphic, with high resolution power, chromosome specific and codominant, they are useful to study population genetics (Queller et al. 1993, Tenzer et al. 1999, De Barro 2005, Parida et al. 2006, Kalia et al. 2011, Georgescu et al. 2014). The application of microsatellite markers showed great potential in various population genetic studies.
For example, 12 microsatellite loci developed from melon fly (Bactrocera cucurbitae) species revealed the existence of genetic structure and little gene flow among B. cucurbitae collected from Asia (Wu et al. 2009, Wu et al. 2011). Similar procedures were utilized in Reunion island (Jacquard et al. 2013) or as a worldwide scale (Virgilio et al. 2010) showing parental invasion routes and population groups specific to different regions. Indeed, the application of microsatellite markers were used in many different insect population genetic studies including, for example, honey bees (Fig. 1.6) (Rasolofoarivao et al. 2015, Techer et al. 2016, Techer et al. 2017b, Techer et al. 2017a), thrips (Wu et al. 2014) and flat black beetle (Cryptolestes ferrugineus) (Wu et al. (2016).
33 Figure 1. 7: Bayesian clustering analysis presenting different B. tabaci species collected from different agroecological zones, different genetic clusters are seeing within the same species described by Hadjistylli et al. (2016).
34 De Barro (2003, 2005) initiated the use of this technique on B. tabaci populations. Those markers are being used to address many questions at the population levels such as retracing invasion routes, gene flow or hybridization between populations, deciphering species boundaries on close species, genetic diversity, inbreeding of populations but also, testing for population structure based on ecological factors (seasonal, host plants, elevation, geographic distance). Currently, several B. tabaci microsatellites markers have been used to understand the genetic parten of B. tabaci populations including MEAM1 and Med (De Barro et al. 2003, Delatte et al. 2006, Dalmon et al. 2008)
In the southern west Indian Ocean (SWIO), the genetic structure, distribution and geographical range of the indigenous IO species was revealed in the islands of Reunion, Madagascar, Mauritius, Comoros and Seychelles (Delatte et al. 2006, Thierry et al. 2011, Thierry et al. 2015).
Another combined study using 13 microsatellites loci and mtCOI analysed a worldwide set of populations (Hadjistylli et al. (2016). In this study, B. tabaci populations used were collected from 50 different countries worldwide. The results showed that the microsatellites markers used were able to resolve distinct genetic groups according to the geographical location (Fig. 1.7). Furthermore, the genetic structure between B. tabaci populations collected from greenhouses in southern France was studied by using seven microsatellite loci by Dalmon et al. (2008). In another study, the microsatellite analyses were able to separate MEAM I and Med structure from the B.
tabaci samples collected from different host plants in Tunisia (Saleh et al. 2012) or in China Med
(Chu et al. 2011). Another study revealed a high level of genetic differentiation to the same Med Q1 species sampled around the Mediterranean basin (Gauthier et al. 2014). A similar approach was used, with six microsatellite markers combined with the sequencing of the barcoding region of the mtCOI in Greece, revealing a substructure population of Med Q in two genetic clusters Tsagkarakou et al.(2007).
35 Figure 1. 8: Population structure of B. tabaci showing hybridization between SSA1 and its sub-groups SG1 and SG2 (Wosula et al. (2017).
36
(b) Restriction site associated DNA markers (RADseq)
RADseq is a popular technique based on next generation sequencing (NGS). RADseq has been recently used in the new era of NGS techniques in genome‐scale research for assessing population structure, hybridization, demographic history, phylogeography and migration (Lowry et al. 2017). RADseq are similar to microsatellite markers but generated by specific restriction enzymes. The restriction fragments are ligated to an adapter and the fragment of a selected size range are sequencing using NGS. The technique utilizes multiple loci to decipher population genetic analysis (McCormack et al. 2013).
A first study using this technique on whiteflies (Wosula et al. 2017) has shown its ability to cluster B. tabaci populations collected in eight cassava growing regions in Africa into six phylogenetic groups. Indeed, the study revealed the hybridization between SSA1 subgroups (SG1 and SG2) from DRC, Tanzania, Rwanda and Burundi. Additionally, sub structuring of SSA1 within and between countries was highlighted (Fig. 1.8) (Wosula et al. 2017).
1.7. Biology of B. tabaci
1.7.1. B. tabaci developmental stages
B. tabaci is an haplodiploid insect (haploid arrhenotoky), females are diploid, produced
from fertilized eggs while, males are haploid developed from unfertilized eggs (Byrne and Bellows Jr 1991) Adult female whiteflies are slightly larger than males, and their sizes differ according to species or host usage (Delatte et al. 2009). Female whiteflies live for up to 60 days while the life span for male whitefly ranged between 9 to 17 days in laboratory conditions (Gill 1990, Gangwar and Gangwar 2018). Mating takes place on the host plant and occurs several times during the life of the adult (Liu et al. 2007).
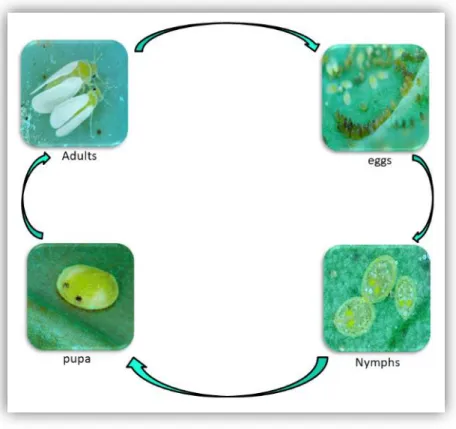
B. tabaci undergoes six life stages including the egg, four nymph stages and the adult (Fig.
1.9). The duration from egg to adult B. tabaci is influenced by several factors, among them are host plants for example sweet pepper is less preferred by MEAM1 (Iida et al. 2009, Tsueda and Tsuchida 2011), on the contrary, MEAM1 developed quicker on a wide host range than indigenous species of China (ZHJ2 and ZHJ2) (Table 1.1) (Zang et al. 2006, Xu et al. 2011).
37 Figure 1. 9: Different developmental stages of B. tabaci MEAM1 on cabbage leaves (photos are from A Franck, CIRAD UMR PVBMT©).
Table 1. 1: Survival and development from egg to adult of two B. tabaci putative species on eight different host plants. Table extracted from Xu et al., (2011).
38 Other factors that influence the larva developmental stages are temperature and humidity (Gerling et al. 1986). Bonato (2007) revealed the impact of temperature on developmental time, with low temperature a minimum of 20 days and the maximum of 56 days at 30°C and 17°C, respectively, recorded for Med Q1 reared on tomato.
The female B. tabaci lays eggs on the abaxial part of the upper leaves of the host plant. The Female whitefly can oviposit more than 300 eggs during its life time (Gangwar and Gangwar 2018), but this number depends on several factors including species of B. tabaci, temperature and host plants. At 21 oC MED Q1 can lay an average of 105.3 eggs (Bonato et al. 2007). Delatte et al. (2009) revealed a range of 74 – 170 eggs laid on tomato leaves by MEAM1 at 30 oC.
Four instar stages occur on whiteflies life cycle, the 1st, 2nd, 3rd and the 4th instar stages. The duration between each of the four instar stages depend on temperature and species, however, the first three instar stages share a similar duration range. The duration range of 2.4 – 6.4 days at 25 oC was recorded from first, second and third instar by (Sharaf and Batta 1985) on B. tabaci population reared on eggplant, Lantana shrubs, tobacco and tomato, while at 15 oC, the number of days raised from 7 – 9.5. Further, on similar stages (Bonato et al. 2007) noted a minimum range of 3.2 – 3.3 days on Med species reared on tomato.
The duration of the 4th instar stage has a wide range of values. An average of a maximum duration of 8.2 days was recorded on tomato and a shorter duration of 5.9 on eggplants. These data were recorded on MEAM1 species following a study conducted to understand the effect of host plant on development and reproduction (Kakimoto et al. 2007). Meanwhile, a negative correlation between temperature and duration of fourth instar was revealed, such as a duration range of 3.02 to 6.36 days for MEAM1 at 30 and 20 oC, respectively (Delatte et al. 2009).
At pupa stage no nutrients are taken any more. Some studies include this stage as the 4th instar (Sharaf and Batta 1985). However, Delatte et al. (2009) considered as unique stage, authors revealed variation in duration, this variation depends on temperature and the B. tabaci species. It was observed minimum duration of 2.3 and 2.36 days at 30 oC for IO and MEAM1 B. tabaci species respectively, whereas at 20 oC a maximum of 4.68 and 4.79 days was observed for the two species.
39 Figure 1. 10: B. tabaci species host range (a) according to botanical families (b) according to plant order showing nine orders with asterisks are commonly shared by most of B. tabaci species as described in Malka et al. (2018).
40
1.7.2. B. tabaci host plants utilization
B. tabaci has been described as a polyphagous species with more than 1000 host plants
belonging to 74 families (Mound and Hashley 1978, Brown et al. 1995a, Simmons et al. 2008, Malka et al. 2018). The most frequently reported host plants belong to the families: Malvacea, Euphobiacea, Solanaceae, Leguminosae, Convolvulaceae and Cucurbitaceae (Brown et al. 1995a, Simmons et al. 2008, Malka et al. 2018).
Although B. tabaci is described as having a wide host range, because it’s a complex of cryptic species, not all species of the complex equally utilized all those plants (Malka et al. 2018). MEAM1 species is reported to have the widest host range including vegetable crops such as cabbage, squash, kidney beans, pepper, tomato, cowpea, cassava, soybean, cucurbits as well as cash crops like cotton and tobacco and ornamental including poinsettia (Muñiz 2000, Simmons et al. 2008, Malka et al. 2018). The polyphagy of MEAM1 was further demonstrated when it colonized the medicinal plants such as feverfew (Tanacetum parthenium), St. John's wort (Hypericum perforatum L.), purple coneflower species (Echinacea pallida and E. purpurea L.) and common valerian (Valeriana officinalis L.) in south California (Simmons et al. 2000).
Both MEAM1 and Med Q1 are polyphagous species, however, the two species differ on their host plant usage. A study conducted in Tunisia to understand the regional co- occurrence of distinct B. tabaci species in relation to the role of host plants, revealed that the Med was closely associated with ornamentals while MEAM1 was associated with vegetables crops (Laarif et al. 2015). The occurrence of MEAM1 and Med into different host plants were also observed in Uganda (Sseruwagi et al. 2005), as well as in West Africa (Gnankine et al. 2013b).
In a recent review on host plant species, families and orders shared by 16 species of the B.
tabaci, 31% of the plant orders were commonly shared by different B. tabaci species (Malka et al.
2018) (Fig. 1.10). Further analyses revealed the existence of common detoxification machinery that was shared by the high performer groups of B. tabaci species which allowed them to adapt a wide range of host plants and new environments.
Despite the common belief that species within B. tabaci complex of cryptic species are polyphagous, a few exceptions are found.
41 Figure 1. 11: B. tabaci effect (A) sooty mold on cassava leaves, (B) cotton field infested with whitefly, (C) unregular ripening on tomato, (D) tomato plant infected with tomato yellow leaf curl begomovirus transmitted by whitefly, photo source: A) NRI library, B) Toscano et al. (1998), C) http://blogs.ifas.ufl.edu/pestalert/2017/02/10/whitefly-alert/ , D) https://www.lsuagcenter.com.
42 A mono-phagous population was reported from jatropha in Puerto Rico (Bird and Maramorosch 1978, Bird and Brown 1998). The SSA species including SSA1 to 5 were formerly known as cassava restricted species (Abdullahi et al. 2003, Berry et al. 2004, Omondi et al. 2005a, Legg et al. 2014b) but, lately, the SSA1 were found on a wider variety of plants and crops (Sseruwagi et al. 2006, Tajebe et al. 2015a, Tocko-Marabena et al. 2017, Mugerwa et al. 2018).
1.8. Whitefly impact on agriculture
Since, 1926 B. tabaci has been reported as one of the most destructive pest and plant virus vector of agriculture. However, attention to the species emerged around the 1980s after severe crops yield losses were reported together with increased whitefly numbers (Brown et al. 1995a, Perring 2001, Legg et al. 2002, Liu et al. 2012, Legg et al. 2014b). The effects caused by B. tabaci populations vary depending on host plants, season or climatic condition and the damages can be both direct and indirect (Fig. 1.11).
B. tabaci is a phloem sucking insect, both adults and immature nymphs feed directly from
the host plant. The process involves taking up potential nutrients including potassium, resulting in leaves turning to yellow, which then interfere in the photosynthesis process and eventually weaken the plants, leading to reduction in plant vigour, quality and yield (Uchida 2000, Polston et al. 2014, Gangwar and Gangwar 2018).
Several studies were performed to understand the relationships between MEAM1 and development of physiological disorders on tomato (Schuster et al. 1990, Schuster 2001) that were specifically observed for this species (Fig 1.11). Indeed, high abundances of MEAM1 on tomato were positively linked to cause irregular ripening and incomplete external colour on tomato, resulting in streaking as well as white spongy like tissue internally (Fig. 1.11) (Schuster 2001, McCormack et al. 2013).
Similarly, a study conducted in Imperial Valley (California, USA) showing an increase in abundance of invasive MEAM1 B. tabaci population had led to losses of more than US$ 2 billion in 1991, due to the effects observed on melon and on cotton, affecting the quantity and quality of cotton (Toscano et al. 1998).
43 Figure 1. 12: Diagram of the main groups of plant viruses transmitted by whiteflies, according to the structure of their viral particles, their mode of transmission and their genomic organization. Described by Navas-Castillo et al (2011).
44 Whiteflies also excrete honeydew on the plant leaf. The excreted honeydew favours the growth of sooty mold fungus which covers the leaf surface, as a result it interferes with photosynthesis process (Davidson et al. 1994). The sticky excretory waste can also stick to cotton lint together making difficult to gin as well reduce the cotton quality. Over 40% loss of production was reported on melon because of sooty mold in Guatemala (Dávila 1999).
Instars of MEAM1 species have been reported to induce plant physiological disorders commonly known as squash silver leafing (SSL) disorder on Cucurbita species (Yokomi et al. 1990, Costa and Brown 1991, Hoelmer et al. 1991, Brown et al. 1995a, Jiménez et al. 1995). Infected plant leaves appeared silver, normally at the upper part. The damage to the plants includes deformation of palisade cells a primary site for photosynthesis, severe infection by MEAM1 on pumpkin caused 40 to 50% chlorophyll reduction on pumpkin (Jiménez et al. 1995). The studies reported the ability of MEAM1 in induction of silver leafing in other countries (Delatte et al. 2005, Sseruwagi et al. 2005, Lourenção et al. 2011, Vyskočilová et al. 2018). Delatte et al. (2005) was also, observed the capability of IO species in induction of such a disorder.
The biggest impact caused by whitefly is by the spread of over 400 viral plant pathogens, belonging to different genera: Begomovirus, Ipomovirus, Crinivirus, Closteroviridae, Carlavirus and
Torradovirus (Jones 2003, Navas-Castillo et al. 2011, Navas‐Castillo et al. 2014, Polston et al.
2014). These viruses are all transmitted by the B. tabaci complex of species by different modes (Fig. 1.12).
Those viruses were reported to cause severe damages to vegetable, legume, fibre crops and ornamental crops (Legg 1999, Livieratos et al. 1999, Usharani et al. 2005). Among all, begomoviruses are economically most significant (Oliveira et al. 2001) They include: Cassava mosaic begomoviruses (CMBs), Tomato yellow leaf curl virus (TYLCV), Tomato chlorotic mottle
virus (ToCMoV), Pepper yellow leaf curl virus (PYLCV), Chino del tomate virus (CdTV), Pepper huasteco virus (PHV) and several others (Polston et al. 1999, Navas-Castillo et al. 2011,
45 Figure 1. 13: ToCV leaf symptoms in comparison to healthy plants (left) and ToCV-infected plants (right). Interveinal yellowing, necrotic flecking, rolling and thickening of the leaf blade are shown on entire plants (A), leaves (B) and leaflets (C), illustration from Navas-Castillo et al. (2014).
46 TYLCV is among the most devastating disease affecting tomato production. This virus most probably originates from Iran where the highest TYLCV genetic diversity was found. It then invaded the Middle Eastern basin including Israel, where it was first described by (Cohen and Harpaz 1964), Americas and spread further worldwide (Lefeuvre et al. 2010)
The infected tomato plants show the symptoms of severe stunting, leaf necrosis, leaf curling, leaf size reduction and reduction in fruit production (Fig. 1.10). This virus was reported in different countries including Caribbean islands, Japan, Spain, Australia, North and Southern America (Polston et al. 1999, Navas-Castillo et al. 2000, Idris et al. 2007, Sugiyama et al. 2008) (Polston et al. 1999, Navas-Castillo et al. 2000, Delatte et al. 2007, Idris et al. 2007, Sugiyama et al. 2008, Van Brunschot et al. 2010). Yield losses can reach 100% in severe infected fields of tropical and subtropical regions (Picó et al. 1996, Lapidot et al. 2000).
The Tomato chlorosis virus (ToCV) belongs to the family Closteroviridae, genus
Crinivirus had been also reported to damage tomato in different countries (Orílio and
Navas-Castillo 2009, Hirota et al. 2010, Navas-Navas-Castillo et al. 2011, Polston et al. 2014). High whitefly abundance in Malaga Spain facilitated the severe spread of ToCV (Navas-Castillo et al. 2000). The infected tomato showed symptoms including interveinal yellowing, necrotic flecking, rolling and thickening of leaves (Fig. 1.13). As a result, yield reduction, delay fruit ripening as well as induce early senescence (Navas‐Castillo et al. 2014). Zhao et al. (2013) showed 5 – 80% ToCV disease incidence in China. Apart from transmitting diseases on tomato, the whitefly species vectored ToCV on sweet pepper (Lozano et al. 2004, Wintermantel and Wisler 2006).
Whitefly also involved in the transmission of plant virus including: Carlavirus example
Cowpea mild mottle virus (CpMMV) affecting soy bean (Zanardo et al. 2014), Torradovirus
example Tomato torrado virus (ToTV) affecting tomato (Amari et al. 2017) and Polerovirus example Pepper whitefly borne vein yellow virus (PeWBVYV) causing damage to pepper (Ghosh et al. 2019)
47 Figure 1. 14: Symptoms expression (a) leaf chlorosis and distortion following infection with CMD (b) Leaf chlorosis after CBSD infection (c) brown root necrotic following infection with CBSD, photo A and B were taken in Tanzania following a field survey conducted in February 2016 and C is from the NRI library.