HAL Id: hal-01249122
https://hal.archives-ouvertes.fr/hal-01249122
Submitted on 30 Dec 2015
HAL is a multi-disciplinary open access
archive for the deposit and dissemination of
sci-entific research documents, whether they are
pub-lished or not. The documents may come from
teaching and research institutions in France or
abroad, or from public or private research centers.
L’archive ouverte pluridisciplinaire HAL, est
destinée au dépôt et à la diffusion de documents
scientifiques de niveau recherche, publiés ou non,
émanant des établissements d’enseignement et de
recherche français ou étrangers, des laboratoires
publics ou privés.
Spatial variability of fine particles in Parisian streets
Sarah Duché, Gérard Beltrando
To cite this version:
Sarah Duché, Gérard Beltrando. Spatial variability of fine particles in Parisian streets. ICUC8 – 8th
International Conference on Urban Climates, Aug 2012, Dublin, Ireland. 3 p. �hal-01249122�
ICUC8 – 8th International Conference on Urban Climates, 6th-10th August, 2012, UCD, Dublin Ireland.
Spatial variability of fine particles in Parisian streets
Sarah Duché*, Gérard Beltrando
CNRS UMR 8586 PRODIG, Université Paris Diderot Sorbonne Paris cité, Paris, France* [email protected]
Abstract
To study the spatial variability of airborne particles and to evaluate the personal and tourist exposure to fine particles in Paris, measurements of fine particles (PM2.5) concentrations have been made in Parisian streets in different mode of transport (bus, bike and walking), using a portable sensor. We use also meteorological parameters sensor (temperature, humidity and wind speed), a camera to view traffic and a GPS to compare with particles levels. PM2.5 levels are highly variable depending on emission sources (traffic road, work building and natural sources in park). Wind speed and PM2.5 concentrations vary according to urban morphology: wind speed and concentrations are higher in streets canyon than in open spaces. Fine particles (particles <2.5 µm in aerodynamic diameter) are proportionately higher than the coarser particles (particles between 10 and 2.5 µm in aerodynamic diameter) in height and in streets canyon.
Keywords: Method –Instrumental observations; Topic – Air quality 1. Introduction
Fine particles PM2.5 (particles <2.5 µm in aerodynamic diameter) affect human health (cardiovascular, respiratory and allergic diseases) [1]. Concentration, composition and size distribution of particles are spatially highly variable [2]. To assess the personal and tourist exposure to fine particles in Paris, we made a series of outdoor field measurements in different mode of transport (by foot, by bike, and tourist bus) and in street with diverse morphology in June 2010, spring 2011 and 2012. The results of these measurements show a high variability of PM2.5.
The aim of this article is to present this spatial variability of PM2.5 concentrations and its factors observed.
2. Data and methods
2.1 Data measurement
A hand-held instrument DustMate (Turkney Optical Particle Analysis System) is used to measure and record the concentration of airborne particles. It uses nephelometer and determines concentrations for each particle size fractions (TSP, PM10, PM2.5 and PM1). Its fast response permits to detect easily locate sources of particles.
These measures were completed by a sensor measuring meteorological parameters (temperature, humidity and wind speed), a camera to view traffic and a GPS. Data were recorded with a time step of 1 minute.
2.2 Transport and route
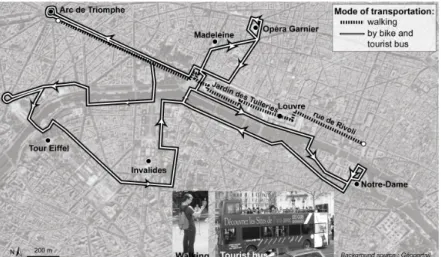
The measurements are made in four different modes of transport: double-decker tourist bus, barge on the Seine, bike and walking (Fig. 1). The particle sensor is carried to an average height of the upper respiratory tract, approximately 1.65 m above the ground by foot. In tourist buses, we sit outside on the second floor with the sensor at the same height as the mouth and nose. In bike, it is difficult to carry the sensor which is placed in the basket on the front. The selected routes have a contrasting urban morphology (street canyon, wide avenue ...).The routes are identical for each day of measurement.
2.3 Days and hours of measurement
To observe variability at a fine-scale, particles is measured during anticyclonic situations with wind speeds less than 3 m/s. 11 days of measurements in June 2010, spring 2011 and spring 2012 are presented in this paper.
The instrument DustMate has no heating head, unlike sensor with FDMS (Filter Dynamics Measurement System), referenced by the European Union [3]. The concentrations of PM10 and PM2.5 measured with the sensor Dustmate have been compared with the official network monitoring in Paris in background and traffic situation. The levels of PM10 and PM2.5 are approximately similar with a threshold of humidity (below 40%). The measurements are performed in the afternoon (between 14 pm and 17 pm) with humidity below 40%.
ICUC8 – 8th International Conference on Urban Climates, 6th-10th August, 2012, UCD, Dublin Ireland.
Fig 1. PM2.5 mean concentrations of one minute and of different areas in a tourist bus, 25th march 2011.
3. Results
The concentrations of PM2.5 observed show a high variability that explains by the proximity of particles sources emission, difference of mode of transport and urban morphology.
3.1 Spatial variability of PM2.5 depending on different particles sources
Figure 2 presents PM2.5 concentrations measured the 25th march 2011 on bus. Spatial variability was important and depended mainly on road traffic. For instance, the stop next to a truck or bus increases concentrations PM2.5. Average concentrations are higher when traffic is dense than when it is flowing. On the figure 2, the first area (around the Eiffel Tower and the Invalides) and the ninth (around the Grand Palais and the Trocadéro) always have a lower traffic than other area. The concentrations of PM2.5 are lower in these areas for all the measurements by bus and bike.
Fig 2. PM2.5 mean concentrations of one minute and of different areas in a tourist bus, 25th march 2011.
Other anthropogenic sources have greatly increased levels of PM2.5 on foot, by bus and bike: the building work.
PM2.5 concentrations observed walking in the Tuileries garden were quite high. The weak winds (between 1 and 2.5 m/s) suspend particles which have a terrigenous origin [4]. The 28th June 2011, the PM2.5 concentrations measured on the Tuileries garden was similar to PM2.5 concentrations observed in Rivoli Street near traffic. The 29th June, after a rainstorm, the concentrations of PM2.5 was higher near road, because the soil was wet in the park, preventing the suspended particles.
3.2 Mode of transport
The results in different mode of transport can’t be compared directly. We have only one particle instrument and the measurements are made on different days. But we observe that the position of transport over the road will greatly influence the PM2.5 concentrations. The concentrations measured by bus and by bike are higher in the road traffic and correspond to the concentrations measured by the traffic stations. The levels observed walking are lower than those measured by the traffic stations
The ratio between fine particles (PM2.5) and coarse particles (PM10) have been calculated for all mode of transport (Tab. 1). The ratio PM2.5/PM10 is higher on bus at the 2nd floor: PM2.5 are lighter than PM10 therefore more easily re-suspension with breezes.
Table 1: Ratio of mean concentration of PM2.5 and PM10 for different mode of transportation
Mode of transportation Ratio PM2.5/PM10
On foot 0,21
On bike 0,37
On bus 0,60
3.3 Urban morphology and breezes
The circuits used have a heterogeneous urban morphology. The levels of PM2.5 are also explained by urban morphology. The areas 1, 8 and 9 on the figure 2 are open area (large avenue or open space). The concentrations in these areas are lower than the other areas with deeper streets.
ICUC8 – 8th International Conference on Urban Climates, 6th-10th August, 2012, UCD, Dublin Ireland.
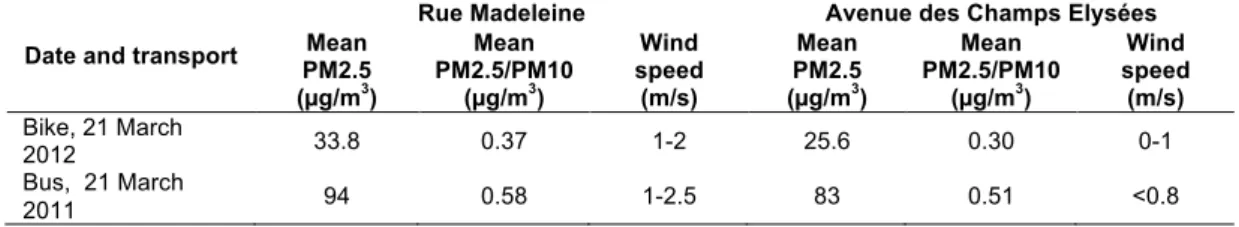
Table 2 : Mean concentrations of PM2.5 and the ratio PM2.5/PM10, and wind speed in two different roads Rue Madeleine (street canyon) and Avenue des Champs Elysées (large avenue) by bike, the 21th March 2011 and by bus the 21 March 2011
Date and transport
Rue Madeleine Avenue des Champs Elysées
Mean PM2.5 (µg/m3) Mean PM2.5/PM10 (µg/m3) Wind speed (m/s) Mean PM2.5 (µg/m3) Mean PM2.5/PM10 (µg/m3) Wind speed (m/s) Bike, 21 March 2012 33.8 0.37 1-2 25.6 0.30 0-1 Bus, 21 March 2011 94 0.58 1-2.5 83 0.51 <0.8
The observed winds (wind speed below 3 m/s) vary depending on the width and height of the streets. Wind speed measured at bus stops, March 25, 2011, was almost equal to zero or very low (<0.8 m/s) except in the streets-canyon near the Madeleine street, where speed was higher (1 to 2.5 m/s; tab. 2). It explains by channeling effect. This speed does not allow the dispersion of pollution but facilitates the suspension of fine particles. With a similar traffic road (fig. 3), the concentrations of PM2.5 are higher in Madeleine Street, street canyon, than the Champs Elysées Avenue, large street.
Fine particles (particles <2.5 µm in aerodynamic diameter) are proportionately higher than the coarser particles (particles between 10 and 2.5 µm in aerodynamic diameter) in the street canyon than the large avenue.
A- Champs Elysées
B – Rue Madeleine
Fig 3. Photographs of Madeleine Street (street canyon) and the Champs Elysees (street width), March 25, 2012
4. Conclusion
The measurements of PM2.5 show a high fine-scale spatial variability and different factors. PM2.5 concentrations are higher near road traffic (on double-decker tourist bus and by bike). Concentrations are even higher than the streets
are narrow with high buildings and a important road traffic.
5. References
1. Pope, C.A., Young, B. & Dockery, D.W., (2006). Health effects of fine particulate air pollution: lines that connect. Journal of the Air &
Waste Management Association, 56(6) : p.709–
742.
2. Pöschl, U., (2005). Atmospheric Aerosols: Composition, Transformation, Climate and Health Effects. Angew. Chem. Int. Ed., 44: p. 7520– 7540.
3. Ustache, A., Favez, O., (2009). Suivi et
optimisation de l’utilisation des TEOM-FDMS, partie 2/2: Accompagnement à la mise en œuvre des modules FDMS, Rapport Ineris.
4. Guégan, H., Leminh, Q., Chaveny, M., Patouille, B., Bourquin, P., (2008). Identification et quantification des contributions relatives des sources de poussières fines en milieu urbain.