HAL Id: halshs-01161888
https://halshs.archives-ouvertes.fr/halshs-01161888
Submitted on 9 Jun 2015
HAL is a multi-disciplinary open access archive for the deposit and dissemination of sci-entific research documents, whether they are pub-lished or not. The documents may come from teaching and research institutions in France or abroad, or from public or private research centers.
L’archive ouverte pluridisciplinaire HAL, est destinée au dépôt et à la diffusion de documents scientifiques de niveau recherche, publiés ou non, émanant des établissements d’enseignement et de recherche français ou étrangers, des laboratoires publics ou privés.
School Autonomy, Education Quality and Development:
an Instrumental Variable Approach
Nicolas Contreras
To cite this version:
Nicolas Contreras. School Autonomy, Education Quality and Development: an Instrumental Variable Approach. 2015. �halshs-01161888�
Documents de Travail du
Centre d’Economie de la Sorbonne
School Autonomy, Education Quality and Development: An Instrumental Variable Approach
Nicolas CONTRERAS
School Autonomy, Education Quality and
Development: an Instrumental Variable Approach
Nicolas Contreras
Paris School of Economics - University Paris 1 Panthéon-Sorbonne
Supervised by David Margolis and Marie-Anne Valfort
February 15, 2015
Abstract
In this paper I mainly seek to test the robustness of Hanushek et al.’s (2013) hypothesis, according to which the impact of autonomy in terms of learning outcomes differs across levels of development, being positive for developed countries but not for developing countries. I do so by constructing a school-level measure of autonomy, which I instrument using the distinction between de jure and de facto autonomy, as laid out by Gunnarsson et al. (2009). I also follow them in differentiating between parents participation and school autonomy, thus providing an explanation to their results, in line with the conceptual framework of Hanushek et al. (2013).
Keywords: School autonomy, Parental participation, PISA, Education quality, Developing countries, panel estimation, instrumental variable
JEL: Analysis of Education (I21), Education: Government Policy (I28), Human Capital; Skills; Occupational Choice; Labor Productivity (J24), Economic Development: Human Resources; Human Development; Income Distribution; Migration (O15)
L’université de Paris 1 Panthéon-Sorbonne n’entend donner aucune approbation ni désapprobation aux opinions émises dans ce papier: elles doivent être considérées comme
propre à leur auteur.
The University of Paris 1 Panthéon-Sorbonne neither approves nor disapproves of the opinions expressed in this paper: they should be considered as the author’s own.
1. Introduction
The view that human capital (Becker 1964) in general, and cognitive skills (Hanushek & Woessmann 2008) in particular, are key ingredients in the recipe of human and economic development is rather consensual. Much less so are the ways to invest in them and speed up their accumulation.
Until recently this issue was raised in quantitative terms, that is, if human capital remained scarce in many parts of the world, it was in part because access to education too was limited there. Increasing supply would therefore remedy such situation and promote learning. And indeed, many children were brought into classrooms and school attainment1 rose in many developing countries (UNESCO 2012).
Yet, the actual learning outcomes for those same children proved disappointing. The performance of developing countries in international assessment programs is still lagging behind that of their richer counterparts. Similarly, evaluations conducted in several such countries revealed that a significant part - in some cases the majority - of children enrolled at a given grade level were unable to read texts or perform computations which can be found in lower grades (see for instance in Kenya, Uwezo 2011).
As a consequence, the issue has recently shifted from the quantity to the quality of education. The focus is now on the learning experience of students (instead of their mere presence at school) and on how best to optimize it (Hanushek & Woessmann 2008). In this regard, the institutional set-up under which governments manage the provision of education is of prime importance. A practical aspect of this is the role given to different loci of decision, in other words, the degree of (de)centralization of schooling systems. In fact, decentralizing the management of educational services, and, in particular, granting schools autonomy in decision-making have been viewed by development institutions as a way for developing countries to achieve higher quality education delivery in spite of low-quality institutions (Gunnarsson 2009, Patrinos, 2011).
However, the literature on the impact of school autonomy2 has proven rather inconclusive. On one hand, properly identifying such an impact is difficult, and on the other hand, when studies propose robust identification strategies, they often reach conflicting results. For instance,
1 School attainment corresponds to the highest grade completed in one’s educational career.
2 School autonomy is used as a synonym to school-base management, with the implied consideration that they
point to the same phenomenon: some measure of responsibility in decision-making being transferred from higher levels of governance to school agents.
Clark (2009) finds a positive and significant impact of an autonomy reform in the United Kingdom using a version of the regression discontinuity design, while in the context of Latin America, Gunnarsson et al. (2009), using an instrumental variable strategy, find no evidence of a positive impact of school autonomy.
In reaction to these mixed patterns, Hanushek et al. (2013) argue that the impact of school autonomy in terms of students learning outcomes is heterogeneous across levels of development. Namely, school autonomy would be good for developed countries, but not so for poorer countries. They reach this conclusion by constructing a country-by-year measure of autonomy within a fixed effect framework so as to estimate its impact on individual students’ test scores. By doing so, they neutralize the risks of selection bias and general equilibrium effects and also control for unobserved country- (and year-) specific heterogeneity. If their findings are indeed robust, then it is highly consequential for development policies, given the popularity school autonomy enjoys among the development community. Nevertheless, their identification strategy is still vulnerable to biases stemming from possible time-varying country confounders.
My main purpose in this paper is therefore to test the robustness of Hanushek et al.’s (2013) findings. To do so, I combine their approach with an instrumentation strategy inspired by that of Gunnarsson et al. (2009) so as to construct a school-level measure of autonomy which produces unbiased estimates of its impact on students’ learning outcomes. I also follow Gunnarsson et al. (2009) by differentiating between school autonomy and parents participation when estimating the impact of the former. This in turns allows me to rationalize the results they obtained with a Latin American sample. Finally, I also improve on Hanushek et al.’s (2013) work on a technical aspect by implementing the computational methods recommended by the OECD (2009) when it comes to working with plausible values and estimating standard errors with their complex sample data.
The next section briefly presents the conceptual framework I use for this paper. Section 3 includes a discussion on estimation issues relative to measuring the impact of school autonomy. Section 4 presents the data I use and some descriptive statistics. Section 5 presents the regression results, as well as a few robustness checks. Finally, section 6 concludes.
2. Conceptual framework
The conceptual framework for this work draws mainly on that of Hanushek et al. (2013), which as be described as follows. They regard the school autonomy puzzle in terms of a principal-agent framework, with the central administration in charge of education (the principal) delegating some managerial power to the schools (the agents).
Such delegation may lead to positive outcomes as it allows agents to use their superior local knowledge and strengthens the incentives to achieve high academic standards by bringing the decisions closer to the recipients (Patrinos 2011). Yet, its success will also depend on the alignment of interests between the principal and the agents, and on the degree of information asymmetry that exists between them as well as on the technical capacity of the agents to handle more decisional power.
Accordingly, if one assumes that more developed countries are less prone to agency issues because they have more reliable institutions and a better educated population, then school autonomy is likely to be positive for them, but not for developing countries, for whom it may in fact be detrimental to students learning outcomes.
This framework can be refined by distinguishing between two categories of agents, school staffs on one hand; and parent groups on the other hand. In fact, while both are subject to their possibly limited technical capacity, it can be assumed that divergence of interests is a more acute issue in the case of school staffs than in that of parent groups. Indeed since parents who send their children to school can reasonably be assumed to want them to receive the best education possible, their goal is basically aligned with that of the administration in charge of education, namely, educating children.
3. Estimation issues and identification strategies
When using survey data, learning outcomes can be described with the help of an education production function, which typically model achievement as a function of different inputs: students, parents, teachers and schools characteristics (Glewwe 2002; Glewwe & Kremer 2006).
Following Hanushek et al. (2013), one may consider the institutional set-up regarding decision-making in the educational system as a term similar to total factor productivity in more general production functions. This entails that the student achievement resulting from any set of inputs will be determined by the decision-making institutions. However, one may
suspect that these institutions are not purely exogenous if, for instance, the best students and/or the best teachers are attracted to the most autonomous schools.
To circumvent this selection bias as well as potential general equilibrium effects, Hanushek et al. (2013) define autonomy at the country-by-year level. More precisely, they measure autonomy as the proportion of schools within a country, and for a given year, which exert autonomous decision-making, and estimate its impact by running estimations with country (and year) fixed effect, as allowed by the panel structure of their data. As a result however, they cannot provide a school-level interpretation, but instead have to concentrate on a cross-country analysis, with all the risks this entails in terms of proper identification. Indeed, although they control for time-invariant, country-specific factors3, their results may well suffer from the influence of correlated unobserved time-varying country factors, such as concomitant educational reforms.
Another approach is the instrumental variable (IV) strategy of Gunnarsson et al. (2009), which is based on a distinction between autonomy as it is prescribed by the law (de jure autonomy) and as it actually exists within each school (de facto autonomy). They argue that school agents (e.g. principals and parents) choose how much managerial effort they will exert (de facto autonomy) based on their school and school attendees characteristics. In this context, the laws on decision-making in the education system (de jure autonomy) only act as a moderating mechanism, making autonomous management more or less difficult, but do not in effect dictate the decision-making process of each school. In the words of the authors: “Even if the constitutionally mandated locus of control over schools resides with the central government, it does not necessarily prevent the exercise of local control over the school, but [it] will raise the cost of exerting local authority” (Gunnarsson et al. 2009: p. 39).
Under these conditions and the identifying assumption that existing legal responsibilities for school management are not set in response to contemporaneous test scores, it is possible to use de jure autonomy as an excluded instrument for de facto autonomy and therefore obtain an unbiased estimation of the impact of autonomy on students’ outcomes. This results in a cross-country analysis too, as the excluded instrument (de jure autonomy) is at the country level. However, its flavor is different to that of Hanushek et al. (2013), in particular regarding the interpretation of the results. Indeed, the IV approach keeps the focus of the analysis at the school-level, although the variation across schools in decision-making which identifies the
impact of autonomy is that which is tied to variation in national laws.
The main caveat from Gunnarsson et al. (2009) stems from the cross-sectional nature of their data, which prevents them from combining their IV strategy with fixed effects. Similarly, estimating the impact of autonomy at the school level makes it very difficult to disentangle general equilibrium effects.
In this paper, I try to combine both approaches in order to estimate the impact of school autonomy. In particular, I build an international PISA panel database which I combine with
Education at a glance (EAG) data on decision-making rules in lower public secondary
education so as to use the IV approach along with fixed effects to estimate the school-level impact of autonomy. PISA data will provide a proxy for autonomy as it exists de facto in each school it samples, while EAG data will reflect de jure autonomy, as it is prescribed by the law in every country at certain points in time. This will then allow me to test Hanushek et al.’s (2013) central hypothesis. I also make use of country-level autonomy measures so as to fully take advantage of the range of my data and to propose a discussion on parents participation, in the vein of Gunnarsson et al. (2009). The next section describes the data I use, including the measures of autonomy and the instruments, and also provides some descriptive statistics.
4. International panel data
a. Construction of a PISA panel dataset
The primary source of data used in this study comes from the Programme for International Student Assessment (PISA), conducted by the Organization for Economic Cooperation and Development (OECD) every 3 years since 2000. Consequently, data are available on the PISA website for years 2000, 2003, 2006, 2009 and 2012. PISA 2012 was not available at the time Hanushek et al. (2013) first drafted their work. The inclusion of this wave is one of the contributions of this study. In fact, as PISA grew older, each wave included more and more non-OECD countries, among which several developing and emerging countries. In particular, PISA 2012 included 65 countries, with 31 non-OECD countries.
PISA tests 15-year-old students, regardless of grade or school type4. The main reason for this age is that it roughly corresponds to the end of compulsory education in OECD countries. The sampling procedure generally takes place in two-steps: schools in which 15-year-old are
4
In reality, the spectrum of PISA students’ grades is actually limited and ranges from 7 to 12, which roughly corresponds to lower and upper secondary education.
enrolled are selected, with their probability of selection being proportional to their size. Then, a subset of students is sampled in each selected school. Sampling conditions are strictly monitored to ensure the student samples are representative of the relevant populations. This in turn implies that schools are targeted to optimize the sampling of students. PISA school samples are therefore not representative of the populations of schools with 15-year-old students in participating countries (OECD 2009). Also, the country-specific school samples are not the same from one year to another. Therefore, aggregating PISA waves yields a panel of data at the country level, while at the school level, it only produces a repeated cross-section.
PISA tests the reading, mathematical and scientific literacy of participants in terms of how well they can apply the knowledge and skills they have acquired to real-life situations. These tests are two-hour long pencil-and-paper tests, including both multiple-choice and open questions. Math scores are used as the main measure of learning outcomes throughout this paper, with the idea that mathematical proficiency is more readily comparable across countries than science and especially reading5. Math scores are also the basis for the results of Hanushek et al. (2013). Test scores for all three subjects are scaled so that, across OECD countries, the mean is 500 and one standard deviation equals 1006.
In addition to test scores, PISA surveys also include a student questionnaire and a school questionnaire, which respectively provide information on the background of students and their families, and on various features of schools functioning. The school questionnaire is addressed to school principals, and as such, the answers it produces should be considered as reflecting the views of school principals on autonomy, as it is implemented in their particular school (Hanushek et al. 2013). Each questionnaire is embedded in a single dataset. The student dataset includes test scores too.
The PISA panel database was constructed in several steps. First, I selected the relevant raw variables from the student and school datasets for each wave from 2000 to 20127. Then I harmonized data between waves and recoded them to fit the regression analysis. Third, I merged the student and school datasets and then proceeded with the building of the country-level autonomy measures. Since PISA schools are not a representative sample of countries’
5 2SLS results are presented in the appendix (see Table A3) for science and reading.
6 In fact math scores were measured differently in 2000. I account for such year-specific common shocks by
using year fixed effects.
school populations, their characteristics are better considered as those of their respective students, the student samples being representative of the student populations (OECD 2009). This is why the computations necessary for the construction of autonomy measures have to be done after the merger, at the student level8. Finally, I appended the merged file of each wave to one another from 2000 to 2012 and built the school-level autonomy measures.
At this point, what will be called henceforth the Full PISA sample can be obtained. In that, I follow Hanushek et al. (2013) by selecting only observations from countries which participated in at least three of the five waves available9. In order to compare the structure of my samples to theirs, I also use the World Bank income classification of countries of 2002. The Full PISA sample includes 1,591,278 students from 53 countries in total with 3 low-income countries, 11 lower-middle-low-income countries, 11 upper-middle-low-income countries and 28 high-income countries10. In total, nine additional non-high-income countries are included in the analysis compared to Hanushek et al. (2013) and thanks to the availability of wave 2012. This roughly corresponds to an additional 600,000 students included in the sample. Finally, data from the full PISA sample are completed with countries’ GDP per capita in constant 2005 USD for year 2000 taken from the World Bank Development Indicators which I will hereon refer to as “initial” GDP p.c..
A major issue with such observational data is missing values. Dropping observations with at least one missing value for any variable of interest results in loosing roughly half of the data. For this reason, I follow Hanushek et al. (2013) again in imputing values for observations with missing controls by using country-by-wave means and I also include a dummy for imputed values in the regressions to control for the imputation. Next I give more details on the measures of autonomy.
b. Measuring de facto autonomy
As explained earlier, my main goal is to combine the approaches of Gunnarsson et al. (2009) and Hanushek et al. (2013) to provide a further test to the central hypothesis of the latter. The main element in doing so is to measure de facto autonomy at the school level. However, data
8 See below for details on the construction process of autonomy measures.
9 As mentioned before, Hanushek et al.’s (2013) sample actually ranges from 2000 to 2009. They therefore
selected only countries which participated in at least three of the four waves they had available.
10
Montenegro and Serbia were not included in the World Bank classification, but I consider them as low-income countries due to their low level of GDP p.c. in 2000 and the promiscuity with the end of the Yugoslav wars. Also, not all “high-income countries” are countries, e.g. Macao in China. Unlike Hanushek et al. (2013), I decided not to exclude small educational systems from the sample, except Liechtenstein which is a notable outlier in terms of GDP p.c..
for the instruments do not exactly match PISA data (see below). In particular, they do not allow taking advantage of the inclusion of new developing and emerging countries, as made possible by the addition of the latest PISA wave. Therefore, I also construct and use an autonomy measure at the country level, in the style of Hanushek et al. (2013), to fully exploit the range of my data.
The raw questionnaire items used in both cases are the same as theirs. To be precise, I use a question asked to principals in every wave, regarding who has the main responsibility for different tasks11. I focus on one category of autonomy, academic-content autonomy, due to limited data availability concerning my instruments (see below). To do so, I use the same tasks as Hanushek et al. (2013): deciding which courses are offered; determining course content; and choosing which textbooks are used.
For each task, the question allowed principals to tick more than one item, with each item corresponding to different levels of governance. Since I am interested in full autonomy, which is the basis of Hanushek et al.’s (2013) results, I consider a school as autonomous in a given task only if at least one school-level agent (the principal, teachers, the school board, or department heads) holds the main responsibility for this task while no non-school-level agent does. In other words, if responsibility is shared by one or more school agents and any other institution at a higher level of governance (e.g. national education authorities), then the corresponding school is not considered to be autonomous. I construct a dummy reflecting this divide for each task and for every school, with value 1 reflecting full autonomy and 0 the absence of full autonomy.
The last step consists in combining these dummies. However, this is not done in the same way for the country-level and the school-level measures. The country-level measure of academic-content autonomy is obtained in two steps. First, each task dummy is aggregated at the country-by-wave level by taking the corresponding proportion of schools which are considered autonomous in the relevant task12. Then, these proportions are combined across the three tasks by taking the average of them three.
11 To be exactly accurate, PISA 2000 and 2003 asked principals “who has the main responsibility...” and PISA
2006 up to 2012 asked “who has considerable responsibility...”. This slight difference is captured by the inclusion of year fixed effects in every estimation.
12 In fact, as mentioned earlier, this aggregation is done at the student level, since school characteristics are better
considered as those of their students (OECD 2009). What is actually computed is therefore the proportion of students in the sample who are enrolled in autonomous schools for the relevant task, for each country-year nexus.
To generate the school-level measure of academic-content autonomy, which I will use to measure de facto autonomy, I use the simple average of the three task dummies13. Finally, I standardize the resulting indexes for de facto academic-content across the sample I use to perform the two-stage least-squares estimation. A minor drawback of the school-level measure comes from data attrition with some schools registering missing values. However, this represents only around 5 percents of observations at the student level. In the following section, I describe the data used for the instruments and the construction of the corresponding sample.
c. Education at a glance instruments: autonomy de jure
As mentioned before, the measures of autonomy de jure which I use as excluded instruments are taken from Education at a glance (EAG) data (OECD 1998, OECD 2004, OECD 2008, OECD 2012). EAG provides data on where and how decisions are taken in various education systems in lower public secondary education, which corresponds to the grade levels where the majority of students participating in PISA were studying at the time of testing. These indicators are based on surveys of panels of experts from each participating country. Experts are chosen from three levels of government (central, middle and school level) and are asked who decides and how in their country according to applicable rules or to the most common practices.
The different levels of decision include the central, federal, regional, sub-regional, local and school levels. The modes of decision refer to either: full autonomy, after consultation, within a framework or others.
Data are available for the items corresponding to the PISA tasks used to build the de facto measure of academic-content autonomy, namely: the choice of textbook, the design of study programmes (corresponding to the PISA item related to the choice of courses offered) and the definition of course content. Unfortunately, data are not available in this format for other items related to the fields of personnel and budget management, which is why I focus on
13
Gunnarsson et al. (2009) use a weighted average to create their school-level measure of autonomy, with weights corresponding to the first principal component of each task dummy. Doing so with my data gives very similar results compared with using non-weighted averages. In fact, the weights generated with a principal component analysis are roughly similar across task dummies in the case of my data. Therefore, using weighted or simple averages makes very little difference.
academic-content autonomy14.
I construct three de jure academic-content autonomy variables, based on the afore-mentioned items. For each of them, I input the value 2 if schools are considered as fully-autonomous decision-makers, 1 if they bear the burden of decision but do so after consultation, within a framework or according to other processes. Finally, these variables take the value 0 if schools are not the decision makers, regardless of the mode of decision. Although I’m interested in full autonomy, I still find it useful to distinguish between the last two cases, since, on the field, consultation processes or frameworks may have limited scope, thus leading to de facto full autonomy.
The main limitation of EAG data is their limited coverage. Not all countries participating in PISA have EAG data and vice-versa. Similarly, data availability for EAG is more restricted in terms of year than it is for PISA and does not exactly cover the same periods. To be precise, EAG indicators of interest are available for years 1998, 2003, 2007 and 2011. I match these EAG waves with the most contemporaneous PISA waves, that is, EAG 1998 is matched with PISA 2000, EAG 2003 with PISA 2003, EAG 2007 with PISA 2006 and EAG 2011 with PISA 2012. PISA wave 2009 is therefore lost. Also, since the selected indicators concern the management of public schools only, private schools are excluded from the sample.
In spite of their limited scope, EAG data are available for several countries and years, which therefore allow me to combine the IV approach with fixed effects. Also, the correspondence in terms of years is such that the exclusion restriction for the instrumentation is credible, at least regarding reciprocity. For instance, the laws on school autonomy in force in 2003 could hardly have been set up in response to the PISA scores of the same year. As result, EAG measures of de jure autonomy are unlikely to be related to PISA test scores other than through their effect on the de facto autonomy of schools as measured by PISA15.
By merging EAG data with those of PISA for public schools, I obtain what is thereon referred to as the EAG-PISA sample. I again follow Hanushek et al. (2013) in selecting only countries which participated in at least three of the four available waves. I also complete the resulting
14 Data related to these fields are only available at a higher level of aggregation which makes them unfit for my
identification strategy.
15 This argument is more tentative when considering the matching of PISA 2006 with EAG 2007, although it is
still reasonable to assume that the inertia in educational reforms prevents a strong causality from running from PISA 2006 test scores to EAG 2007 measures of legal autonomy. Another concern is that EAG measures of legal autonomy could be correlated with time-varying omitted variables tied to test scores. At the very least, they are not significantly correlated with country-level characteristics, be it GDP p.c. or controls aggregated at the country level (not shown).
base with data on initial GDP p.c.. The EAG-PISA sample is much more restricted in terms of non-high-income countries. It comprises 20 countries with just three upper-middle-income countries and no lower-middle-income or low-income countries whatsoever. This being said, the EAG-PISA sample still includes 449,498 students after accounting for the 5% of missing values for the autonomy variables (cf. supra). The next section presents some descriptive statistics on the Full PISA sample and the EAG-PISA sample.
d. Descriptive statistics
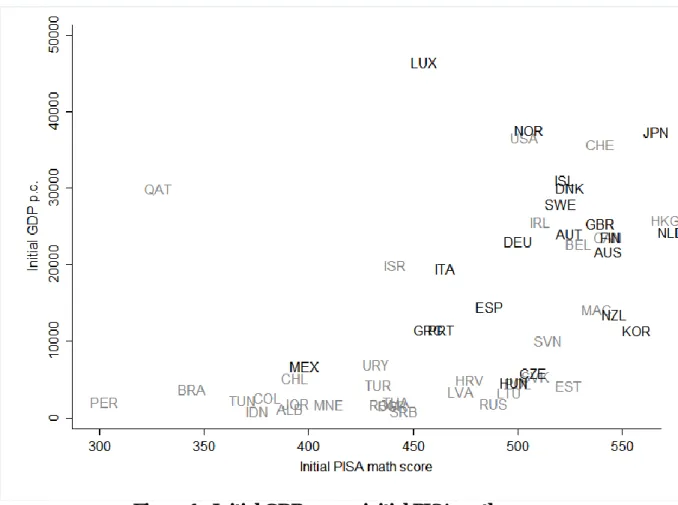
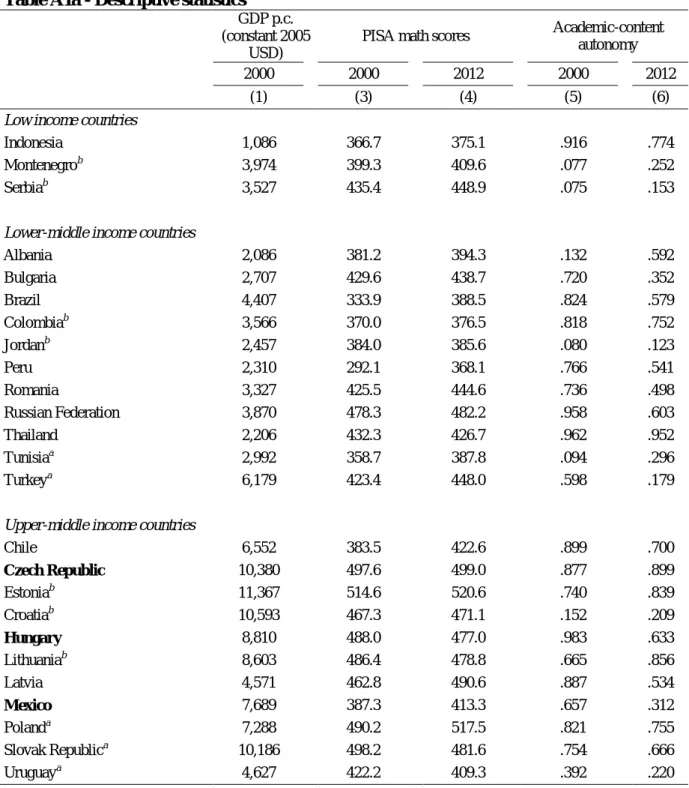
Figure 1 plots initial country mean scores in math against initial GDP p.c.. This plot allows to visualize the different countries encountered in the analysis in terms of how developed they are when it comes to schooling outcomes and income. Countries included in both the Full PISA and the EAG-PISA samples are marked in black, countries which are only present in the Full PISA sample are in grey.
Figure 1 shows that in general, richer countries perform better in PISA, especially when setting aside Luxembourg and the Qatar. However, there still is substantial variation in test scores across countries with similar income levels and vice-versa. For instance, Brazil and Estonia have a comparable initial GDP p.c. but are located at opposite ends in terms of test scores. Estonia actually performs better than the US and Norway which are some of the richest countries in the sample. In a similar fashion, Korea performs better than all but the tree countries when it comes to initial PISA math score, although its initial income per capita is far from ranging among the highest.
Figure 1 - Initial GDP p.c. vs. initial PISA math score
Notes: Country codes: ALB-Albania; AUS-Australia; AUT-Austria; BEL-Belgium; BGR-Bulgaria; BRA-Brazil; CAN-Canada; CHE-Switzerland; CHL-Chile; COL-Colombia; CZE-Czech Republic; DEU-Germany; DNK-Denmark; ESP-Spain; EST-Estonia; FIN-Finland; GBR-United Kingdom; GRC-Greece; HKG-Hong Kong SAR. China; HRV-Croatia; HUN-Hungary; IDN-Indonesia; IRL-Ireland; ISL-Iceland; ISR-Israel; ITA-Italy; JOR-Jordan; JPN-Japan; KOR-Korea. Rep.; LTU-Lithuania; LUX-Luxembourg; LVA-Latvia; MAC-Macao SAR. China; MEX-Mexico; MNE-Montenegro; NLD-Netherlands; NOR-Norway; NZL-New Zealand; PER-Peru; POL-Poland; PRT-Portugal; QAT-Qatar; ROM-Romania; RUS-Russian Federation; SRB-Serbia; SVK-Slovak Republic; SVN-Slovenia; SWE-Sweden; THA-Thailand; TUN-Tunisia; TUR-Turkey; URY-Uruguay; USA-United States. Countries in grey are present only in the Full PISA sample, while countries in black are included in both the EAG-PISA sample and the Full PISA sample.
Next, Figure 2 presents a scatter plot of the change in academic-content autonomy, measured at the country level, versus the change in PISA math score, between the last and first years in which countries entered the sample. Here, high income countries are represented in grey, and non-high income countries in black. The grey line is the linear fit for high income countries. It displays a positive slope. What’s more, most of high income countries are located either in the lower left or upper right quadrants. On the contrary, the dashed black line, which represents the linear fit for high income countries, is downward sloping. While there are a few non-high income countries in the upper right quadrant, it is nonetheless clear that non-non-high income countries which experienced the highest increase in PISA math score have restricted school autonomy over time, as is evident from the cases of Peru, Brazil and Chile. There is therefore
descriptive evidence of a heterogeneous relationship between academic-content autonomy and achievement, across levels of economic development.
Figure 2 - Change in acad.-content autonomy vs. change in math score
Notes: Country codes: ALB-Albania; AUS-Australia; AUT-Austria; BEL-Belgium; BGR-Bulgaria; BRA-Brazil; CAN-Canada; CHE-Switzerland; CHL-Chile; COL-Colombia; CZE-Czech Republic; DEU-Germany; DNK-Denmark; ESP-Spain; EST-Estonia; FIN-Finland; GBR-United Kingdom; GRC-Greece; HKG-Hong Kong SAR. China; HRV-Croatia; HUN-Hungary; IDN-Indonesia; IRL-Ireland; ISL-Iceland; ISR-Israel; ITA-Italy; JOR-Jordan; JPN-Japan; KOR-Korea. Rep.; LTU-Lithuania; LUX-Luxembourg; LVA-Latvia; MAC-Macao SAR. China; MEX-Mexico; MNE-Montenegro; NLD-Netherlands; NOR-Norway; NZL-New Zealand; PER-Peru; POL-Poland; PRT-Portugal; QAT-Qatar; ROM-Romania; RUS-Russian Federation; SRB-Serbia; SVK-Slovak Republic; SVN-Slovenia; SWE-Sweden; THA-Thailand; TUN-Tunisia; TUR-Turkey; URY-Uruguay; USA-United States. High income countries are represented in grey, non-high income countries in black. The change which is plotted is that which occurred between the last and first years in which each country entered the sample. Academic-content autonomy is measured at the country level. The dashed black line is the linear fit for high income countries; the grey one is the linear fit for all other countries.
Tables A1 in the appendix sums up this information in the form of a table, presenting levels for variables of interest (GDP p.c., PISA math score and academic-content autonomy) for the dates at which countries enter and leave the samples, usually 2000 and 2012 respectively.
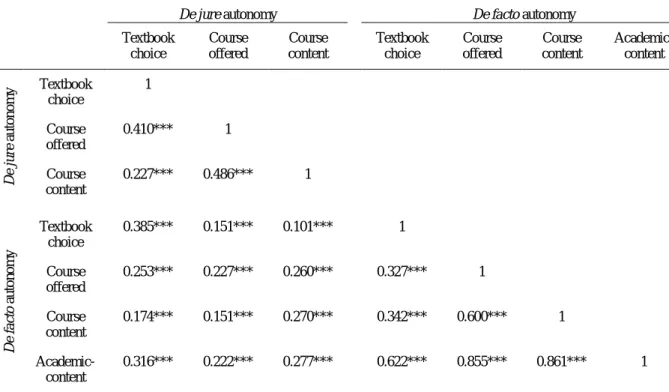
Table 1 below shows the correlation between de jure and de facto measures of academic-content autonomy. In line with the argumentation developed by Gunnarsson et al. (2009), the
correlations between respective items of prescribed and actual autonomy are positive, but rather humbly so. In other words, from this descriptive perspective, de facto autonomy indeed seems to be largely determined by factors others than de jure autonomy, thus supporting the view that actual autonomy is endogenously determined in each school, and only moderated but not dictated by legal prescriptions.
Table 1 - Correlation matrix, de jure and de facto autonomy
De jure autonomy De facto autonomy
Textbook choice Course offered Course content Textbook choice Course offered Course content Academic-content De ju re a u to n o m y Textbook choice 1 Course offered 0.410*** 1 Course content 0.227*** 0.486*** 1 De fa cto a u to n o m y Textbook choice 0.385*** 0.151*** 0.101*** 1 Course offered 0.253*** 0.227*** 0.260*** 0.327*** 1 Course content 0.174*** 0.151*** 0.270*** 0.342*** 0.600*** 1 Academic-content 0.316*** 0.222*** 0.277*** 0.622*** 0.855*** 0.861*** 1
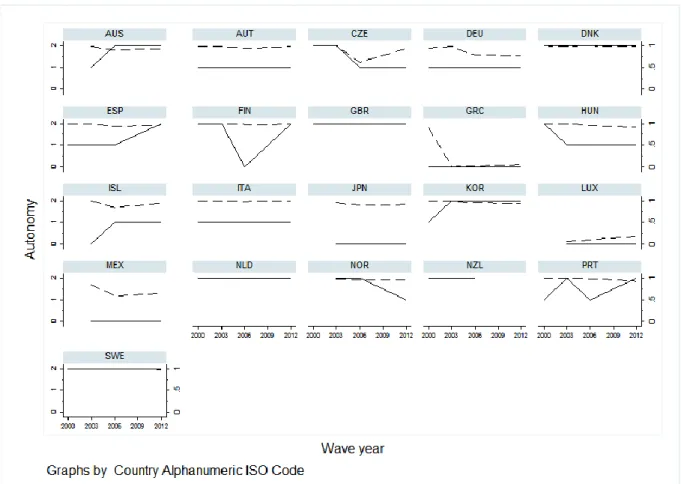
Figure A1 to A3 in the appendix show the evolution of de jure and de facto academic-content autonomy over time for all countries in the EAG-PISA sample. They provide a graphical illustration of the stylized fact emphasized by Table 1: there is some measure of correlation between prescribed and actual autonomy, but it is rather partial. The next section goes beyond descriptive statistics and into the regression analysis.
5. Regression analysis
I start by presenting the baseline equation of Hanushek et al. (2013) along with the results it produces when replicated with the Full PISA sample and the EAG-PISA sample. Then I introduce the two stages of the instrumental procedure and present the results they yield as well as those of a simple least square estimation, for the sake of comparison. Finally, I discuss the results obtained when including parents participation in the analysis, using country-level measures of both participation and autonomy.
All results are computed according to the method recommended by the OECD (2009) 16. This includes making use of all plausible values17 to produce estimations, through a multiple imputation method; and using a balanced repeated replication procedure to estimate standard errors, so as to take into account the complex sampling procedure of PISA. Ignoring the former or the latter can lead to biased estimations and inaccurate standard errors respectively (see von Davier et al. n.d.). As such, this represents a minor technical improvement on Hanushek et al. (2013) who used country clustering to compute standard errors and did not precise how they used of plausible values.
a. Cross-country analysis: replications in the style of Hanushek et al. (2013)
The empirical model which Hanushek et al. (2013) estimate can be described as follows:
𝑇𝑐𝑡𝑠𝑖 = 𝛼1𝐼𝑐𝑡+ 𝛼2(𝐼𝑐𝑡× 𝐷𝑐) + 𝛽𝐹𝐹𝑐𝑡𝑠𝑖+ 𝛽𝑆𝑆𝑐𝑡𝑠+ 𝜇𝑐+ 𝜇𝑡+ 𝜀𝑐𝑡𝑠𝑖
where the test score 𝑇 of student 𝑖 enrolled in school 𝑠 at time 𝑡 in country 𝑐 is a function of her country’s educational institutions in terms of decision-making (i.e. autonomy) 𝐼, and of her family (𝐹) and school (𝑆) inputs. The model is estimated with country (𝜇𝑐) and year (𝜇𝑡) fixed effect. 𝐷 stands for the level of development of country 𝑐. 𝜀𝑐𝑡𝑠𝑖 is an error term18.
𝑇 is measured with PISA scores in mathematics. Family and school characteristics, 𝐹 and 𝑆, include a set of characteristics about the gender and age of students, their migratory status and socio-economical background, the size of their school, etc. The full set is presented in the appendix. Here, autonomy is measured at the country level for academic content, in the style of Hanushek et al. (2013). The development level is captured by the initial GDP p.c., measured in logs. Finally, since the analysis is at the student level, country and year fixed effects are included in the form of 𝑁 − 1 dummies.
The interest lies in estimating 𝛼 =𝜕𝑇𝜕𝐼, the impact of autonomy on test scores. I do so with the Full PISA sample and the EAG-PISA sample, in order to replicate the analysis of Hanushek et al. (2013) with an extended set of developing and emerging countries, and, later, to
16
I used the Stata user-made prefix “pv” written by Kevin Macdonald (2014) to do so.
17 Plausible values are used throughout international student test programmes to estimate performance. In the
case of PISA data, five plausible values are available for each field of test, including mathematics (see OECD 2009 for more information).
18 A particular concern in the analysis of Hanushek et al. (2013) is the correlation of 𝐼 with potential confounders
varying at the country-by-wave level too, namely, educational reforms concomitant to a change in autonomy policies. However, they tested for several possible cofounders including national expenditures per student and found their results to be robust in every case. I do not perform these tests, in part due to a lack of data.
compare the pattern produced with their method to that which emerges from the IV approach.
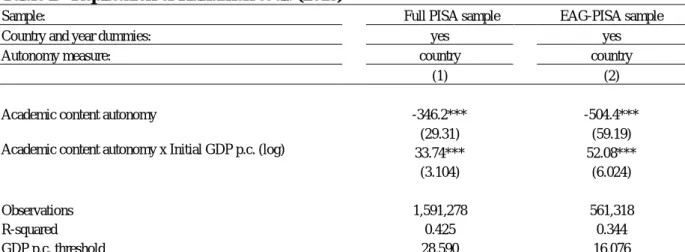
Results are presented in Table 2 in columns (1) and (2) for the Full PISA sample, and the EAG-PISA sample respectively19. They are in accordance with the central hypothesis of Hanushek et al. (2013): the main effect of autonomy is negative, but varies positively with initial GDP p.c.. These estimates are also statistically different from zero at the 1-percent level in both cases.
Table 2 - Replication of Hanushek et al. (2013)
Sample: Full PISA sample EAG-PISA sample
Country and year dummies: yes yes
Autonomy measure: country country
(1) (2)
Academic content autonomy -346.2*** -504.4***
(29.31) (59.19)
Academic content autonomy x Initial GDP p.c. (log) 33.74*** 52.08***
(3.104) (6.024)
Observations 1,591,278 561,318
R-squared 0.425 0.344
GDP p.c. threshold 28,590 16,076
Standard errors in parentheses. Dependent variable: PISA math score. Each column corresponds to a different regression, estimated at the student level. Each regression includes controls for student and school characteristics as well as a dummy for observations with imputed values. See Table A2 for the list of controls.
*** p<0.01, ** p<0.05, * p<0.1
Taking the Full PISA estimation, academic-content autonomy starts have a positive effect for a level of initial GDP p.c. of roughly $28,000 (in 2005 USD), regardless of whether or not GDP p.c. varies with time, which is higher than what was estimated by Hanushek et al. (2013), who found the threshold to lay at around $20,000. On the contrary, when using the EAG-PISA sample, which comprises mostly rich countries, the level of initial GDP p.c. for which the impact of autonomy becomes positive is lower than that of Hanushek et al. (2013) and than what I estimate with the Full PISA sample: it lays at around $16,000. This is probably due to the country composition of the EAG-PISA sample, which comprises mainly rich countries.
So far, I can therefore say that Hanushek et al.’s (2013) central hypothesis is not rejected by my data when using their approach, i.e. a country-level measure of autonomy. However, the precise level of development for which autonomy becomes beneficial is not robust to changes
19 I report only the coefficients of interest. The full list of controls can be found in Table A2., which shows the
controls coefficients for the first-stage estimation of the 2-SLS procedure (see infra). The same controls are used in every regression.
in sample. It should thus be interpreted with caution. I now present the results which I obtain when measuring academic-content autonomy at the school-level.
b. School-level analysis: instrumentation in the style of Gunnarsson et al.(2009)
The baseline equation for the school-level analysis is roughly similar to that of Hanushek et al. (2013), to the exception that academic-content autonomy is measured at the school level:
𝑇𝑐𝑡𝑠𝑖 = 𝛼1𝐼̂𝑐𝑡𝑠+ 𝛼2(𝐼̂𝑐𝑡𝑠× 𝐷𝑐) + 𝛽𝐹𝐹𝑐𝑡𝑠𝑖+ 𝛽𝑆𝑆𝑐𝑡𝑠+ 𝜇𝑐 + 𝜇𝑡+ 𝜀𝑐𝑡𝑠𝑖
I present two types of estimations for this model, one where academic-content autonomy is assumed to be exogenous, hence a simple least square estimation, and another where it is considered endogenous and therefore is instrumented.
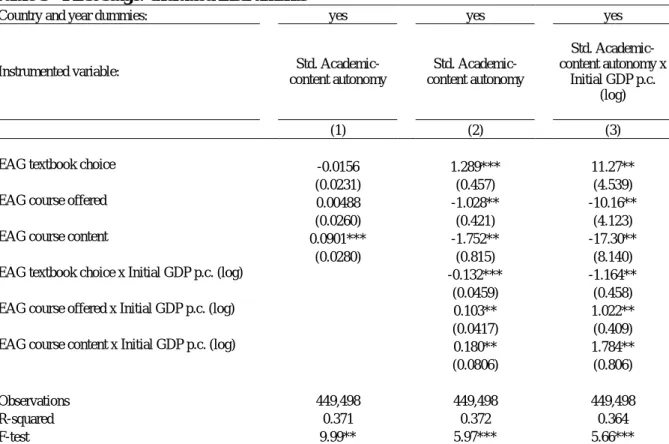
Table 3 presents the first stage results for the excluded instruments when running estimations for academic-content autonomy20. Generally speaking, the parameters of the excluded instruments point in the expected direction: if the law allows schools to take more decisions, then schools tend to be in fact more autonomous. They are jointly significant in every specification, while statistical significance for individual parameters varies across variables and specifications, owing to multicollinearity (see Table 1).
Table A2a and A2b in the appendix show the results of the first stage for the controls. They provide a few insights on what drives de facto autonomy in schools apart from legislated autonomy.
In this regard, there is no clear pattern regarding selection into autonomous schools, at least in the case of students. The pattern indeed seems to be that of a positive selection of teachers in autonomous schools, with a rather strong and statistically significant correlation between the share of fully certified teachers and academic-content autonomy. Regarding students, however, the evidence is mixed. There is a marginally significant and positive relationship between parents’ educational and occupational background and academic-content autonomy, supporting the idea of a positive selection of students. However, students whose home language is different from the teaching language tend to go to schools with more decisional power regarding curricula, thus mitigating the pattern of positive selection of students in autonomous schools.
20
The IV procedure is implemented at the student level for each of the two stages for both forms of the baseline equation (linear & interacted).
Table 3 - First stage: excluded instruments
Country and year dummies: yes yes yes
Instrumented variable: Std.
Academic-content autonomy Std. Academic-content autonomy Std. Academic-content autonomy x Initial GDP p.c. (log) (1) (2) (3)
EAG textbook choice -0.0156 1.289*** 11.27**
(0.0231) (0.457) (4.539)
EAG course offered 0.00488 -1.028** -10.16**
(0.0260) (0.421) (4.123)
EAG course content 0.0901*** -1.752** -17.30**
(0.0280) (0.815) (8.140)
EAG textbook choice x Initial GDP p.c. (log) -0.132*** -1.164**
(0.0459) (0.458)
EAG course offered x Initial GDP p.c. (log) 0.103** 1.022**
(0.0417) (0.409)
EAG course content x Initial GDP p.c. (log) 0.180** 1.784**
(0.0806) (0.806)
Observations 449,498 449,498 449,498
R-squared 0.371 0.372 0.364
F-test 9.99** 5.97*** 5.66***
Standard errors in parentheses. Dependent variable: see column headings. Each column corresponds to a different regression, estimated at the student level. Each regression includes controls for student and school characteristics as well as a dummy for observations with imputed values. See Table A2 for the list of controls.
*** p<0.01, ** p<0.05, * p<0.1
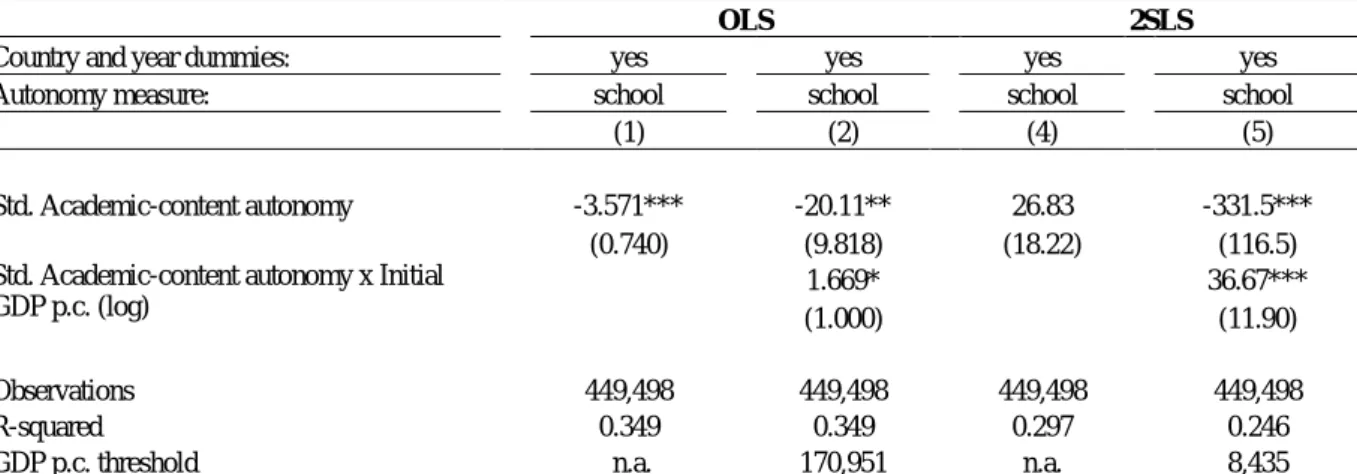
Table 4 shows the results when running the OLS estimations and the second stage of the IV procedure for both the linear and the interacted versions of the baseline equation. The 2SLS results go in the same direction as Hanushek et al. (2013), with academic-content autonomy registering a base impact which is negative, but varying positively with GDP p.c.. The threshold beyond which the impact of academic-content autonomy becomes positive turns out to be more than twice lower than what I obtained on a similar sample, but using a country-level measure.
If comparing the least square estimates with the results of the instrumentation, it is possible to notice a downward bias, which probably stems from non-native speakers being more likely to attend schools that are autonomous in defining curricula.
These results are more concrete when commented in terms of the estimated impact of a school gaining autonomy in defining academic content. Take for instance a country with an initial GDP p.c. close to that of Mexico, the poorest country in the EAG-PISA sample, at around $7,700 per capita in 2000 (in 2005 USD). At such a level of development, my estimations indicate that an increase in autonomy of one standard deviation decreases math score by
roughly -3.4 points on average, all else equal. In other words, in the case of a country like Mexico, autonomy has no educationally significant impact, in accordance with the results of Gunnarsson et al. (2009), obtained with a Latin American sample. However, if making out-of-sample predictions, and taking the poorest country in the Full PISA out-of-sample, Indonesia, with an income per capita for year 2000 of roughly $1000, then a one standard deviation increase in academic-content autonomy reduces test score in mathematics by -75 points on average. At the other end of the income range, at a level of initial GDP p.c. comparable to Norway’s (i.e. over $62,000), a one standard deviation increase in autonomy increases students’ math score by over 70 points on average, all else equal. In lieu of illustration, it is useful to remember that PISA scores are scaled for one standard deviation to be equal to 100 across OECD countries. These impacts at both ends of the development spectrum are therefore relatively large.
Table 4 - 2SLS estimates
OLS 2SLS
Country and year dummies: yes yes yes yes
Autonomy measure: school school school school
(1) (2) (4) (5)
Std. Academic-content autonomy -3.571*** -20.11** 26.83 -331.5***
(0.740) (9.818) (18.22) (116.5)
Std. Academic-content autonomy x Initial GDP p.c. (log)
1.669* 36.67***
(1.000) (11.90)
Observations 449,498 449,498 449,498 449,498
R-squared 0.349 0.349 0.297 0.246
GDP p.c. threshold n.a. 170,951 n.a. 8,435
Standard errors in parentheses. Dependent variable: PISA math score. Each column corresponds to a different regression, estimated at the student level. Each regression includes controls for student and school characteristics as well as a dummy for observations with imputed values. See Table A2 for the list of controls.
*** p<0.01, ** p<0.05, * p<0.1
The principal drawback from the school-level approach is that it makes it impossible to disentangle general equilibrium effects. For instance, an increase in autonomy for school 1 may induce a competitive response from school 2. Alternatively, granting more autonomy to schools can alter the supply of teachers or school personnel in general. For the better, if future applicants welcome the new decision-making load, but also possibly for the worse, if they consider it as an additional burden. Regarding supply effects, I follow Hanushek et al. (2013) by controlling for math teacher shortage. Nonetheless, this sole variable can hardly capture supply effects on its own. Also, I have no way to control for possible competitive responses to autonomy at the local level because PISA data include no geographical dimensions apart from the national and federal levels.
Table A3 in the appendix presents the results which are obtained through both a simple least square estimation and an instrumental procedure, for the two other test subjects comprised in PISA, namely science and reading. Results are robust in the case of the former but not in that of the latter, for which adding an interaction term between academic-content autonomy and development yields insignificant results. In the case of science, where the estimated parameters of interest are significantly different from zero at the 1 percent level, the threshold of GDP p.c. past which academic-content autonomy starts having a positive impact is quite similar to what I found in the case of mathematics (approx. $7,300 and $8,400 respectively).
Next, I conclude this section with a discussion on parents participation and autonomy.
c. School autonomy and parents participation
Gunnarsson et al. (2009) argue that school autonomy and parents participation are two different empirical constructs in that, while being related to one another, they do not point to the exact same phenomena. Consequently the impact of autonomy on schooling outcomes is not well estimated if one doesn’t take into account parents participation. To be precise, they find contradictory coefficients when estimating the impact of autonomy with and without parents participation. Disregarding parents participation leads them to conclude on a positive and statistically significant impact of autonomy, while it is in fact negative and not significant when parents participation is included. This is consistent with the view that the impact of autonomy is partly dependent on the level of accountability, as noted by Hanushek et al. (2013). Further, Gunnarsson et al. (2009) actually finds a positive and significant effect of parents participation on test scores, in particular in language.
I am therefore interested in testing two extensions of the initial hypothesis of Hanushek et al. (2013) concerning community involvement: is the effect of autonomy different from that of parents participation and are the estimates of the impact of autonomy altered by the inclusion of parents participation.
Hanushek et al. (2013) implicitly include parents participation in their approach of measuring school autonomy. I argue along with Gunnarsson et al. (2009) that the two are distinct elements of schools’ decision-making process. In waves 2003, 2006 and 2009, PISA included a question which well embodies parental participation in its local accountability dimension. It mirrors the question asked to principal regarding autonomy by asking them to select bodies who have a direct influence on various affairs, including instructional content. The bodies in
question include parents groups. I therefore construct a discrete variable for parents participation in academic-content definition, which is set to one if the principal ticks the item corresponding to parents group for instructional content.
EAG data do not include any equivalent for PISA 200921. The EAG-PISA sample is therefore too limited to account for parents participation with the IV strategy. However, since the results of the instrumented school-level measures of autonomy are in accordance with the pattern found by the approach of Hanushek et al. (2013), it is possible to use their strategy to include parents participation in the estimations of the impact of academic-content autonomy on test scores. I therefore aggregate the parents participation dummies at the country-by-wave level by taking the proportions of schools where parents groups are influential in the instructional content. The sample for which these variables are available is more restricted than the Full PISA sample, but not as much as for the EAG-PISA sample. I select only countries which participated in the three relevant waves, 2003, 2006 and 2009. Specifically, these include 25 high-income countries, 7 upper-middle-income countries, 5 lower-middle-income countries and 1 low-lower-middle-income country. In total, this amounts to 904,069 students from 38 countries.
My country-level measures of parents participation in instructional content are only weakly correlated with their equivalent in terms of school autonomy (0.265), as in the case of Gunnarsson et al. (2009), which supports their argument that participation is empirically different from autonomy. Consequently, results should not be plagued by multicollinearity.
As mentioned earlier when describing the conceptual framework, the concerns which apply to autonomy in terms of agency may well apply to parents participation, albeit to different degrees. I therefore choose to let the impact of parents participation differ across initial GDP p.c., still in logs.
Table 5 presents the estimations obtained for autonomy alone and along parents participation in academic-content, using the same sample. Including parents participation does not affect the general pattern of the impact of autonomy. It does however change significantly the threshold at which the impact of academic-content autonomy becomes positive, pushing it upward. The actual parents participation parameters have the expected signs and are
21 In fact it is possible to use EAG data for year 2011 as to instrument parents participation as measured by PISA
for year 2009, but it creates too big a discrepancy and leads to weak instruments which in turn produce no significant results. This can explained by the lesser inertia in changing the roles of parents at schools, compared to that of teachers for instance, which makes a two-year gap too rough an approximation.
statistically significant. What’s more, the impact of participation in academic-content switches sign at a much lower initial GDP p.c. level if compared to autonomy.
Overall, these results are highly consistent with those of Gunnarsson et al. (2009), in that taking into account participation makes it harder for autonomy to have a positive impact (cf. higher threshold), while participation itself has a positive impact at a much lower level of GDP p.c., which could explain why they found autonomy to have no effect on achievement and participation to be a positive factor. Nonetheless, the thresholds identified for autonomy are extremely high. These results should therefore be interpreted with caution, in a comparative perspective between autonomy and participation.
Finally, this is also consistent with the refinement of Hanushek et al.’s (2013) framework which I discussed earlier, i.e. that agency is less of an issue when decisional power is delegated to parents than when it is attributed to teachers for instance, hence the lower threshold for parents participation. This refinement of the conceptual framework can thus account for the pattern unearthed by Gunnarsson et al. (2009).
Table 5 - Parents participation and autonomy
Country and year dummies: yes yes
Autonomy measure: country country
(1) (5)
Academic-content autonomy -177.2*** -166.8***
(35.17) (36.25)
Academic-content autonomy x Initial GDP p.c. (log) 13.09*** 11.93***
(3.628) (3.756)
Parents participation in acad. content -445.7***
(96.68) Parents participation in academic content x Initial GDP p.c.
(log) 44.11*** (10.33) Observations 904,069 904,069 R-squared 0.412 0.413 GDP p.c. threshold: Autonomy 756,949 1,180,630 Participation n.a. 24,448
Standard errors in parentheses. Dependent variable: PISA math score. Each column corresponds to a different regression, estimated at the student level. Each regression includes controls for student and school characteristics as well as a dummy for observations with imputed values. See Table A2 for the list of controls.
*** p<0.01, ** p<0.05, * p<0.1
6. Conclusion
By combining the approaches of Hanushek et al. (2013) and Gunnarsson et al. (2009), I am able to provide a solid test for the hypothesis of Hanushek et al. (2013), for the particular case
of academic-content autonomy. The main characteristics of my approach is indeed the combination of an instrumentation strategy, based on the distinction between legally prescribed and actual autonomy, with a pseudo-panel of PISA data, which allows me to confirm that the impact of academic-content autonomy is heterogeneous across levels of development, being negative or null for developing countries, but positive for developed countries.
Also, I find that controlling for an exogenous measure of parents participation, interacted with level of development, makes it harder for autonomy to have a positive impact, since it pushes the threshold of GDP p.c. upward, which is consistent with the findings of Gunnarsson et al. (2009). Also in line with these authors is the fact that I find parents participation in academic-content to have a positive impact at lower development levels if compared to autonomy.
My findings therefore advocate nudging schools’ institutional set-ups towards parents participation rather than autonomous decision-making if one wants to improve the educational performance of students from developing countries. From a theoretical perspective, this can be explained by lesser agency issues when delegating decisional power to parents as opposed to other school agents such as teachers.
Finally, to conclude with a note of caution, it is important to remember that the level of development for which the impact of school autonomy or parents participation becomes positive is sensitive to changes in sample characteristics, sometimes quite dramatically so. For this reason, the general pattern matters more than the numerical examples I give.
7. References
Becker, G.S., 1964. Human Capital: A Theoretical and Empirical Analysis, with Special Reference to Education. Chicago, University of Chicago Press.
Chaudhury, N., Parajuli., D., 2010. Giving It Back: Evaluating the Impact of Devolution of School Management to Communities in Nepal. Unpublished manuscript, World Bank, Washington, DC.
Clark, D., 2009. The performance and competitive effects of school autonomy. Journal of Political Economy 117 (4), 745–783.
von Davier, M., Gonzalez, E. & Mislevy, R., n.d.. What are Plausible Values and why are they useful? In: M. von Davier & D. Hastedt (Eds.): IERI Monograph Series: Issues and Methodologies in Large Scale Assessments, Vol. 2. http://www.ierinstitute.org/fileadmin/Documents/IERI_Monograph/IERI_Monograph_ Volume_02_Chapter_01.pdf
Galiani, S., Gertler, P., Schargrodsky, E., 2008. School decentralization: helping the good get better, but leaving the poor behind. Journal of Public Economics 92 (10–11), 2106– 2120.
Glewwe, P., Kremer, M., 2006. “Schools, Teachers and Educational Out-comes in Developing Countries.” In Handbook of the Economics of Education, ed. E. Hanushek and F. Welch. Amsterdam: Elsevier Science.targeted
Glewwe, P., 2002. Schools and Skills in Developing Countries: Educational Policies and Socioeconomic Outcomes. Journal of Economic Literature 50:436–82.
Gunnarsson, V., Orazem, P.F., Sánchez, M.A., Verdisco, A., 2009. Does Local School Control Raise Student Outcomes? Evidence on the Roles of School Autonomy and Parental Participation. Economic Development and Cultural Change 58, 25–52.
Hanushek, E.A., Link, S., Woessmann, L., 2013. Does School Autonomy Make Sense Everywhere? Panel Estimates from PISA. Journal of Development Economics 104, 212-232.
Hanushek, E.A., Woessmann, L., 2008. The role of cognitive skills in economic development. Journal of Economic Literature 46 (3), 607–668 (September).
Macdonald, K., 2014. PV: Stata module to perform estimation with plausible values.
Organisation for Economic Co-operation and Development, 1998. Education at a Glance 1998: OECD Indicators. OECD, Paris.
Organisation for Economic Co-operation and Development, 2004. Education at a Glance 2004: OECD Indicators. OECD, Paris.
Organisation for Economic Co-operation and Development, 2008. Education at a Glance 2008: OECD Indicators. OECD, Paris.
Organisation for Economic Co-operation and Development, 2009. PISA Data analysis manual. OECD, Paris.
Organisation for Economic Co-operation and Development, 2012. Education at a Glance 2012: OECD indicators. OECD, Paris.
Patrinos, Harry A., 2011. School-based management. In: Bruns, Barbara, Filmer, Deon, Patrinos, Harry A. (Eds.), Making Schools Work: New Evidence on Accountability Reforms. The World Bank, Washington, DC, pp. 87–140.
Unesco, 2012. EFA Global Monitoring Report: Youth and skills: Putting education to work. Paris, Unesco.
Uwezo Kenya, 2010. Are our Children Learning? Annual Learning Assessment Kenya 2010. http://uwezo.net/uploads/files/Introduction_1_1(2).pdf (accessed 2.7.14).
8. Appendix
Table A1a - Descriptive statistics
GDP p.c.
(constant 2005 USD)
PISA math scores
Academic-content autonomy
2000 2000 2012 2000 2012
(1) (3) (4) (5) (6)
Low income countries
Indonesia 1,086 366.7 375.1 .916 .774
Montenegrob 3,974 399.3 409.6 .077 .252
Serbiab 3,527 435.4 448.9 .075 .153
Lower-middle income countries
Albania 2,086 381.2 394.3 .132 .592 Bulgaria 2,707 429.6 438.7 .720 .352 Brazil 4,407 333.9 388.5 .824 .579 Colombiab 3,566 370.0 376.5 .818 .752 Jordanb 2,457 384.0 385.6 .080 .123 Peru 2,310 292.1 368.1 .766 .541 Romania 3,327 425.5 444.6 .736 .498 Russian Federation 3,870 478.3 482.2 .958 .603 Thailand 2,206 432.3 426.7 .962 .952 Tunisiaa 2,992 358.7 387.8 .094 .296 Turkeya 6,179 423.4 448.0 .598 .179
Upper-middle income countries
Chile 6,552 383.5 422.6 .899 .700 Czech Republic 10,380 497.6 499.0 .877 .899 Estoniab 11,367 514.6 520.6 .740 .839 Croatiab 10,593 467.3 471.1 .152 .209 Hungary 8,810 488.0 477.0 .983 .633 Lithuaniab 8,603 486.4 478.8 .665 .856 Latvia 4,571 462.8 490.6 .887 .534 Mexico 7,689 387.3 413.3 .657 .312 Polanda 7,288 490.2 517.5 .821 .755 Slovak Republica 10,186 498.2 481.6 .754 .666 Uruguaya 4,627 422.2 409.3 .392 .220
Notes: PISA national math scores are computed according to the computation method recommended by the OECD (2009). National percentages for academic-content autonomy are computed based on non-imputed values and weighted using final student sampling probabilities. Countries in bold characters are included in the EAG-PISA sample. The income classification follows that of the World Bank for year 2002.
a PISA data refers to 2003 instead of 2000. b PISA data refers to 2006 instead of 2000.
Table A1b - Descriptive statistics
GDP p.c.
(constant 2005 USD)
PISA math scores
Academic-content autonomy
2000 2000 2012 2000 2012
(1) (3) (4) (5) (6)
High income countries
Australia 30,870 533.3 504.2 .932 .706 Austria 35,027 515.0 505.5 .691 .595 Belgium 34,009 519.6 514.5 .724 .568 Canada 33,373 533.0 518.1 .760 .408 Denmark 45,340 514.5 500.0 .889 .684 Finland 33,217 536.2 518.8 .954 .659 Germany 32,662 489.8 513.5 .551 .612 Greece 18,041 446.9 453.0 .903 .035 Hong Kong-China 22,152 560.5 561.2 .991 .854 Iceland 46,986 514.4 492.8 .797 .687 Ireland 41,954 502.9 501.5 .779 .699 Israel 19,225 433.0 466.5 .911 .558 Italy 29,872 457.4 485.3 .717 .743 Japan 33,957 556.6 536.4 .988 .923 Korea 15,162 546.8 553.8 .973 .884 Luxembourg 72,394 445.7 489.9 .000 .137 Macao-Chinaa 18,995 527.3 538.1 .992 .917 Netherlands 37,547 563.8 523.0 .956 .940 New Zealand 24,362 536.9 499.8 .958 .859 Norwaya 62,454 495.2 489.4 .571 .475 Portugal 17,891 453.7 487.1 .560 .474 Qatarb 58,066 318.0 376.5 .234 .157 Sloveniab 18,839 504.5 501.1 .276 .440 Spain 23,921 476.3 484.3 .798 .529 Sweden 36,576 509.8 478.3 .874 .531 Switzerland 50,188 529.3 530.9 .381 .298 United Kingdom 34,059 529.2 493.9 .978 .914 United States 40,965 493.2 481.4 .912 .419 Notes: PISA national math scores are computed according to the computation method recommended by the OECD (2009). National percentages for academic-content autonomy are computed based on non-imputed values and weighted using final student sampling probabilities. Countries in bold characters are included in the EAG-PISA sample. The income classification follows that of the World Bank for year 2002.
a PISA data refers to 2003 instead of 2000. b
Figure A1 - De jure and de facto autonomy through time: textbook choice
Notes: Country codes: AUS-Australia; AUT-Austria; CZE-Czech Republic; DEU-Germany; DNK-Denmark; ESP-Spain; FIN-Finland; GBR-United Kingdom; GRC-Greece; HUN-Hungary; ISL-Iceland; ITA-Italy; JPN-Japan; KOR-Korea. Rep.; LUX-Luxembourg; MEX-Mexico; NLD-Netherlands; NOR-Norway; NZL-New Zealand; PRT-Portugal; SWE-Sweden. De jure autonomy is represented by the solid line and de facto autonomy is depicted as a dashed line. The left-hand y-axis refers to the former and the right-hand y-axis to the latter. De facto autonomy is measured as the country-by-wave average, which is basically the same as Hanushek et al.’s (2013) measure since the average of a dummy yields a proportion.