HAL Id: hal-01875580
https://hal.archives-ouvertes.fr/hal-01875580
Submitted on 17 Sep 2018
HAL is a multi-disciplinary open access
archive for the deposit and dissemination of
sci-entific research documents, whether they are
pub-lished or not. The documents may come from
teaching and research institutions in France or
L’archive ouverte pluridisciplinaire HAL, est
destinée au dépôt et à la diffusion de documents
scientifiques de niveau recherche, publiés ou non,
émanant des établissements d’enseignement et de
recherche français ou étrangers, des laboratoires
Towards the reconstruction of wide historical sites: A
local graph-based representation to resample gigantic
acquisitions
Arnaud Bletterer, Frédéric Payan, Marc Antonini, Anis Meftah
To cite this version:
Arnaud Bletterer, Frédéric Payan, Marc Antonini, Anis Meftah. Towards the reconstruction of wide
historical sites: A local graph-based representation to resample gigantic acquisitions. 16th
EURO-GRAPHICS Workshop on Graphics and Cultural Heritage (EG GCH), Nov 2018, Vienna, Austria.
pp.1 - 9. �hal-01875580�
EUROGRAPHICS Workshop on Graphics and Cultural Heritage (2018), pp. 1–9 R. Sablatnig and M. Wimmer (Editors)
Towards the reconstruction of wide historical sites:
A local graph-based representation to resample gigantic acquisitions
Arnaud Bletterer1, Frédéric Payan1, Marc Antonini1and Anis Meftah2
1Université Côte d’Azur, CNRS, I3S 2Cintoo3D
Abstract
Nowadays, LiDAR scanners are able to digitize very wide historical sites, leading to point clouds composed of billions of points. These point clouds are able to describe very small objects or elements disseminated in these sites, but also exhibit numerous defects in terms of sampling quality. Moreover, they sometimes contain too many samples to be processed as they are. In this paper, we propose a local graph-based structure to deal with the set of LiDAR acquisitions of a digitization campaign. Each acquisition is considered as a graph representing the local behavior of the captured surface. Those local graphs are then connected together to obtain a single and global representation of the original scene. This structure is particularly suitable for resampling gigantic points clouds. We show how we can reduce the number of points drastically while preserving the visual quality of large and complex sites, whatever the number of acquisitions.
Categories and Subject Descriptors(according to ACM CCS): I.4.8 [Image Processing and Computer Vision]: Scene Analysis— Range data I.3.5 [Computer Graphics]: Computational Geometry and Object Modeling—Geometric algorithms, languages, and systems
1. Introduction
Many initiatives are under way to store and share digitally cultural heritage all over the world. Since two decades now, strong attention has been given towards 3D scanning methods. There are many pur-poses of such an application like digital archiving, physical repli-cation, remote fruition, digital restoration, monitoring of cultural heritage [PGA01]...
There exists a broad range of processes allowing to obtain 3D digital representation of real-life objects such as laser scanning, shape from X (structured light, silhouette, stereo, video, shading, photometry, focus, shadow), or even contact systems [PKA∗07]. The use of one instead of another depends on a broad range of cri-teria like area of the region to capture, precision of the measures, duration of the acquisition campaign, and so on. Overall, one can decompose the 3D digitization process into two main steps : acqui-sitionand aggregation.
The first step consists in the capture of the elements composing the region of interest. For this, acquisition systems are moved to different positions, in order to acquire information from different points of view. Such data is then processed into the second step, which assembles the different pieces acquired independently. This step can be quite different between two distinct processes, as the data which has to be merged might not be of the same type. In a context of shape from X, the data acquired are classical 2D images, and 3D points are extracted from such images during this merging
process. In a context of laser scanning, the acquired data are already 3D points, but defined in the local coordinate frame of the scanner. Thus, the aggregation process consists in the registration of all the points in a single world coordinate frame.
In the end, all of those methods provide a point cloud represent-ing samples on the surface of the captured scene. However, such a representation is rarely used as this. For example, for visualiza-tion, visual perception can be better if the inherent surface is dis-played instead of such a point cloud. Also, when replicating an ob-ject, by stereolithography for instance, a polygonal model must be constructed from the point cloud before its creation. Finally, those usages though not being an exhaustive list of the possibilities al-ways require the reconstruction of surfaces from the point clouds generated.
2. Related work
The accuracy of LiDAR acquisition systems has considerably in-creased over the years. Such a technological evolution make it pos-sible to obtain extremely precise acquisitions, up to 1mm accuracy. This means that nowadays such equipments can be used to obtain an overall description of a cultural heritage site, but also to capture very small details, despite the huge area of the region they cover.
Having such a precision while digitizing a whole site results in point clouds which can contain several billions of points.
More-over, those point clouds are the result of the merging of different acquisitions taken at different locations. Thus, they exhibit numer-ous defects in terms of sampling quality (highly non-uniform dis-tributions, noise, etc.), and may contain too many samples to be processed as they are. These drawbacks limit their usage and their sharing, and make some processings very complex, or even impos-sible (surface reconstruction for instance).
Resampling the data is one solution to tackle this problem, but this is not straightforward for such particular data. There are mainly two reasons. Firstly, point clouds are often unstructured, which makes their management complex, in particular because the knowl-edge of the underlying surface is a valuable information that is missing. Secondly, massive point clouds may not fit in memory, and discard many in-core algorithms from being used on standard desktop machines.
The most common approach is to construct space partitioning trees to structure and then to manage the point clouds. Several methods already exist [PK05,SZW09,RH10,RGM∗12,LZZ13,
HWB∗13,EBN13]. Those methods have the advantage to process unstructured point clouds without any a priori on their origin. But, given the specificities of our data - wide sites with various small details - those representations may be inappropriate, because the domain of definition of the captured samples is a surface, and not the 3D space. For example, without additional processing, using normals for instance, these methods are unable to take into account the behavior of the surface throughout the points.
An important point to note though, is that such methods aim at providing solutions to interactively visualize or compress dense sets of points, using different strategies to extract relevant infor-mation from the constructed trees quickly. As a result, they never explicitly extract a resampled version of a point cloud for further processings.
Recently, [CTF∗18] proposed to use a graph to describe a point cloud. This structure has the advantage to take into account the topology of the captured surface, which is convenient to apply clas-sical signal processings, such as resampling. Unfortunately, this global structure is not really scalable, and finally is inappropriate to deal with our gigantic acquisitions.
3. General overview
In this paper, we propose an alternative solution to the work of [CTF∗18]. The idea is to construct a local graph for each LiDAR acquisition, before merging all of them as a single point cloud. Our main motivation relies on the fact that each acquisition provides a depth map that is a structured representation of a part of the ac-quired surface. We consider these graphs as local, because each of them describes only a subset of the whole point cloud. Then, to process the point clouds in a globally coherent manner, but also to avoid redundant computations in the overlapping regions, we also propose a solution to "connect" our local graphs. This enables, when dealing with a specific graph, to transmit/fetch various infor-mation to/from the other graphs representing the same regions. To show the interest of such a structure in practice, we consider it to resample gigantic point clouds merging multiple LiDAR acquisi-tions, via a Poisson-disk sampling strategy.
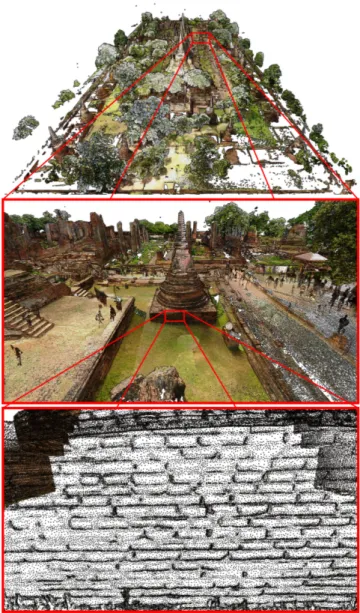
Figure 1: The site Wat Phra Si Sanphet, Ayutthaya (Thailand), re-sampled with our graph-based approach. The original data contain more than 5 billion points, merging 156 different acquisitions. We are able to represent it with only 2.8% of the original number of points while preserving fine-scale details (such as bricks in a wall over a 40.000m2area).
Our local graph-based resampling has many advantages. First, the memory required for any local processing is bounded by the number of graphs involved, which enables to deal with gigantic points clouds. Second, it provides some guarantees with respect to the covering of the captured surface. Third, by modifying the metric associated to each graph, fine details can be preserved even in large-scale scenes. In this paper, we show how our method is particularly relevant for resampling acquisitions of cultural heritage sites (see Figure1) that generally merge numerous scans, to reach more than a billion of points. We also show how it enables the use of surface
A. Bletterer, F. Payan, M. Antonini & A. Meftah / A local graph-based representation to resample gigantic acquisitions 3
reconstruction algorithms to recover the underlying surface of those gigantic acquisitions, and the level of detail that can be recovered.
The rest of the paper is organized as follows. Section4provides a background on the notions of depth maps and Poisson disk sam-pling. In Section5, we introduce our local graph-based represen-tation as a way to structure a set of acquisitions. In Section6, we present a surface-aware resampling strategy using the local graphs proposed. In Section7, several experimentations are shown on large and complex cultural heritage sites, both in terms of timings and vi-sual quality as well as reconstructions obtained from our samplings.
4. Background
For a good understanding of our motivations, we explain in this sec-tion the characteristics of the native structure of the captured data, namely depth maps, as well as a basic introduction to the sampling process considered in this work, the Poisson-disk sampling.
4.1. Depth maps
A depth map D (also called range image) is a 2-dimensional im-age whose intensities represent the distance between the points ac-quired in the scene, and the position of the acquisition system. A depth map is composed of valid pixels, i.e., acquired points, and non-validpixels, representing directions with no depth information and identified by having a null intensity. Depth maps can be pro-vided by different kinds of acquisition devices (capture of real-life scenes), but also created synthetically from any 3D digital model (similarly to the work of [PTSZ11]).
Combined with its parameterization function (a mapping from 3D to 2D), a depth map is geometrically equivalent to a point cloud. A depth map also gives an information about the surface topol-ogy, which has to be recovered when processing the resulting point cloud only. Finally, depth maps naturally provide a suitable domain to deal with the captured surface, e.g., for neighborhood requests, subsampling, filtering, etc.
More formally, a depth map DM is a parameterization of a point cloud PC acquired from a specific position and orienta-tion. DM is obtained by using a parameterization function c, such that DM = c(PC). This function is invertible, which means that PC= c−1(DM). c is called the projection and c−1the embedding. In our context, the depth maps come from terrestrial LiDARs. In this case, the position p = (m, n) ∈ N2of a pixel represent respec-tively the azimuthal angle θ and the polar angle ϕ, and its intensity I(p) represents the radial distance r (all representing a spherical coordinates system centered on the position of a LiDAR during the acquisition). The function c can be expressed as a change of co-ordinates. Let pw= (x, y, z) be a 3D point in the cartesian world
coordinate system. Its coordinates in a cartesian coordinate system centered on the scanner during the ith acquisition are obtained by using a rotation matrix Rsiand a translation vector Tsi:
xsi ysi zsi = psi= Rsi(pw− Tsi).
Then, the conversion to spherical coordinates can be done : rsi= q x2si+ y 2 si+ z 2 si, θsi= tan −1 (ysi xsi ), ϕsi= cos −1 (zsi rsi ).
Finally, the coordinates in the depth map pi= (msi, nsi) can be
ob-tained by quantizing θsiand ϕsiwith respect to the resolution of the
depth map DM.
4.2. Poisson-disk sampling
Due to its blue noise characteristics, Poisson-disk sampling is a common sampling strategy in Computer Graphics (see [Coo86] and [Uli88] for more details). A Poisson-disk sampling generates a random distribution of samples on a plane H, while imposing a minimum distancebetween them. This minimum distance is con-trolled by using disks of radius r, centered on each sample, such that no disk overlaps any other one. Consequently, the disks ensure a lower bound on the distances between samples :
∀si, sj∈ S, i 6= j, ||si− sj|| > 2r, (1)
where S ⊂ H represents the set of samples.
A Poisson-disk sampling is said to be maximal if no sample can be added anymore. In this case, the maximum distance between any point in the plane and its closest sample is directly related to the ra-dius r is strictly lower than 2r, as for any point located at a distance 2r of a sample a new sample with a disk of radius r could be added without overlapping any other disk. Thus, a maximal Poisson-disk sampling also ensures an upper bound of the distance between any point x ∈ H and the closest sample:
∀x ∈ H, ∃s ∈ S, ||x − s|| < 2r. (2) In our context, this gives guarantees about the covering of the do-main.
Over the years, generalizations have been done, to sample n-dimensional domains quite efficiently [Bri07]. Research has also been oriented towards non-uniform domains, e.g., on surfaces [BWWM10,CCS12,PPA15], and/or algorithms efficiency. For ex-ample, [PPA15] has shown that a low complexity sampling could be achieved by considering a discrete approach of the popular dart throwingtechnique [Coo86] to sample surfaces.
5. A set of local graphs to describe the captured surface The work of [CTF∗18] gives theoretical ideas that demonstrate the interest of constructing graphs over point clouds, for applying sig-nal processing tools afterward. By associating a topology to a point cloud, graphs are particularly suitable to process its underlying sur-face, instead of its ambient space. As pointed out by the authors, a graph is a generalization of a polygonal mesh, but whose construc-tion is easier, since connectivity restricconstruc-tions existing in polygonal meshes are relaxed.
Nevertheless, the construction of a single graph over the whole point cloud is far too expensive to be done on massive data for now.
Instead, we propose to construct a set of local graphs, each graph describing a part of the underlying surface of a point cloud. 5.1. Construction
At each acquisition, a terrestrial LiDAR scanner provides a depth map. As a depth map can be seen as a structured representation of the captured scene, we consider its connectivity to construct a local graph representing the part of the surface captured by this acquisition.
However, simply transposing a depth map as a graph may be inefficient. First, acquisitions are generally noisy, because of the external conditions during the acquisition (ambient light, surface shininess, dust and moisture in the atmosphere, ...). Secondly, for a given depth map, neighboring pixels are not necessarily associated to points geodesically close on the underlying surface, because of occlusionsbut also obtuse scanning angles that can appear, depend-ing on the position of the LiDAR.
Dealing with noisy acquisitions In order to lower the impact of the noise during the computations, without degrading the accuracy of an acquisition, we first apply a bilateral filtering [AW95,SB97,
TM98] on the depth map. Following notations of [PKTD07], we re-call that a bilateral filter is a non linear filter that smoothes a signal while preserving strong edges:
b D(p) = 1
Wpq∈Ω
∑
p
IqGσs(||p − q||)Gσr(|I(p) − I(q)|), (3)
where bDis the denoised depth map, Gσsis a gaussian function
tak-ing into account the spatial closeness, and Gσris a gaussian
func-tion taking into account the intensity difference. Wpcorresponds to
the normalization factor :
Wp=
∑
q∈Ωp
Gσs(||p − q||)Gσr(|I(p) − I(q)|).
This filtering reduces the noise present in a depth map - and in the point cloud, by invariance of the association - without merging different regions with strong depth variations (see Figure2). In the rest of the section, we will refer to D as being the filtered depth map
b D.
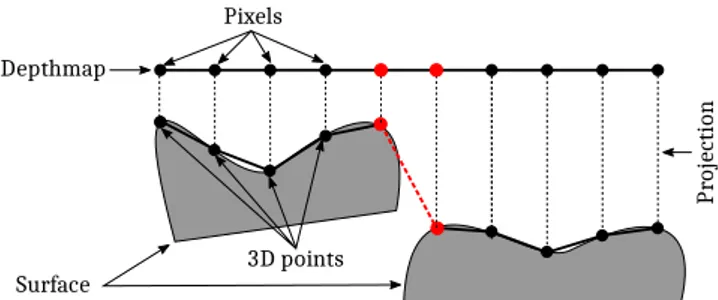
Dealing with the occlusions As typical scenes are composed of various elements, many different objects may appear close once projected into a depth map, even if they are not next to each other on the surface. Figure3illustrates the problem in a nutshell: because of the occlusions, some neighboring pixels do not correspond to neighboring points on the corresponding surface.
Most of the time, when two neighboring pixels in a given depth map belong to two distinct elements in the scene, their depths strongly vary. Therefore high depth variations are detected to iden-tify vertices which should not be linked together in the graph. Tech-nically, we compute morphological gradients g(D) [RSB93] on the depth map D :
g(D) = D ⊕ b − D b,
where b is a structuring element, and ⊕ and are the dilation and erosion operations, respectively. Then, we tag as non-valid the pix-els with high gradients, by considering an adaptive thresholding on
Figure 2: Impact of the bilateral filtering on a given depth map, on the quality of the point cloud (top: before filtering ; bottom : after filtering). Close-up view ofSt Trophime.
Depthmap Pixels Pr ojecti on 3D points Surface
Figure 3: Typical case of connectivity in the parameterization do-main provided by the depth map that is not faithful to the topology of the acquired surface: two objects in the acquired scene are pro-jected onto neighboring pixels, but the red edge must not exist in the graph.
g(D), to take into account the intensity variation with respect to the distance between a point and the acquisition system. Finally, an undirected graph G= (V, E) is constructed, where the vertices V correspond to the valid pixels, and the edges E connect neighbor-ing valid pixels.
5.2. Connections between the local graphs
In the context of surface parameterization, when an atlas of charts is constructed, some parts of a manifold can be covered by differ-ent charts. In that case, some parts of the parameterization domain of a given chart are mapped to the parameterization domains of the other charts, and vice-versa [GZ06]. This is done with a transition functions τi jthat transforms points of the parameterization domain
Gito the parameterization domain Gjaccording to the
parameteri-zation functions c:
τi j= cj◦ c−1i .
In our context, we consider the acquisition process as the creation of an atlas of charts, where:
A. Bletterer, F. Payan, M. Antonini & A. Meftah / A local graph-based representation to resample gigantic acquisitions 5
• the manifold is the acquired surface, • a chart corresponds to an acquisition,
• the parameterization domain associated to a chart corresponds to the depth map generated by this acquisition.
Those transition functions could be used to construct a global seamless parameterization, as in [PTSZ11]. But this approach, al-though being an elegant and implicit solution, is computationally expensive, and thus inappropriate for gigantic acquisitions.
As an alternative solution, we propose to link the vertices of the different graphs that correspond to nearby points on the surface. Hence, each vertex v ∈ Vi of a given graph Gi(Vi, Ei) ∈ G is
as-sociated with Cv, its set of m corresponding vertices in the other
graphs, using the transition functions between each pair of graphs (when such vertices exist): Cv= {v0, v1, v2..., vm−1}.
From there, a unique graph similar to the one constructed by [CTF∗18], could be obtained by merging corresponding vertices, and then, could be used to apply various signal processing algo-rithms [SNF∗13]. Unfortunately, in our context of gigantic data, this global graph suffers from its space complexity (O(|V | + |E|)), that makes its management impractical.
Indeed, a cultural heritage site contains multiple points of inter-est, such as statues at different locations of the site. Thus, a single acquisition is not enough to describe precisely all the different ele-ments belonging to such a scene. As a consequence, a digitization campaign generally consists of several acquisitions done at differ-ent positions, which can quickly rise to dozens or even more than a hundred for large-scale scenes.
Therefore, instead of merging the corresponding vertices to con-sider the links between graphs as implicit, we choose to keep the graphs distinct, and to store the corresponding vertices Cv
associ-ated to each vertex explicitly. Hence, when computing a local pro-cessing, only the vertices and the associated edges concerned by this processing are loaded in memory.
5.3. Managing the overlapping regions
In overlapping regions, the number of vertices belonging to each graph depends on the position and the resolution of the acquisition device. The density of the graph can have a strong influence on the accuracy of the computations. For example, when estimating dis-tances on the graphs, a denser graph would lead to a more precise estimation of distances. To simplify computations, while getting the most accurate results, we propose to identify the graph with the highest density in each overlapping region. For a specific region, all the operations will be performed from this graph. Then, to ensure coherency between different graphs, once calculations have been done for the vertices of this region, results are transmitted to all their corresponding vertices in the other graphs.
Identification of the highest density graphs To identify in which local graph a given calculation has to be done, and from which graph a result can be fetched from another graph, we must deter-mine the sampling density around each vertex, according to its ac-quisition. For a given vertex vi, this can be done by computing its
average squared distance to all the vertices vj∈ Nk(vi), Nk(vi)
be-ing the k-hop neighborhood of vi. The k-hop neighborhood of vi
contains the vertices connected to viby at most k "edge hops". The
density w(vi) is estimated as being the inverse of this distance :
1 w(vi) = 1 |Nk(vi)|v
∑
j∈Nk(vi) ||vj− vi||2.Then, for each vertex vi∈ Viof each graph Gi, we compare its
density w(vi) with the density w(v0i) of its corresponding vertices
v0i∈ Cvi. At the end of this process, each set of vertices Viof each
graph Giis decomposed into two sets :
• Vi+⊆ Vi, the set of vertices having the highest density with
re-spect to all their corresponding vertices • Vi−= Vi\Vi+, the remainders.
6. Resampling gigantic point clouds using local graphs In this section, we present how our local-graph based structure can be used to resample point clouds. First, we present our implemen-tation of the popular Dart throwing algorithm [Coo86] that enables the maximal Poisson-disk sampling of a single LiDAR acquisition. Then, we show it can be extended to a set of overlapping acquisi-tions to deal with gigantic points clouds.
6.1. Graph based dart throwing for a single LiDAR acquisition
The principle of dart throwing is simple. Considering the minimum distance 2r required between two samples, it consists in i) picking out randomly a candidate sample on the domain, ii) constructing a disk of radius r centered on this sample, and iii) verifying if this disk intersects another disk. If not, this candidate belongs to the distribution. Otherwise, this candidate is discarded. To get a max-imal Poisson-disk sampling, this process is repeated until no more sample can be "thrown" on the domain without violating the "no disk intersection" constraint.
Algorithm1summarizes the procedure. Data: V : the list of candidate samples Result: Sr: the set of final samples while V is not empty do
v= V .getRandomElement(); Dv= constructPoissonDisk(v, r);
if Dvintersects an existing diskthen
V.removeElement(v); else Sr.addElement(v); for vi∈ Dvdo V.removeElement(vi); end end end
Algorithm 1: Discrete dart throwing algorithm.
The vertices of the graph are the initial list of candidate samples, and the idea is to test the validity of each candidate by constructing its disk over the graph. At the end, the set of samples Srcorresponds to the final distribution.
The construction of the disks can be done using Dijkstra’s short-est path algorithm [Dij59]. One attractive feature of our graph-based structure is that it is very simple to model different metrics, by simply modifying the weights associated to the edges E. For ex-ample, if we choose as weights the distances between the points in 3D space, then the shortest path from a vertex to another one in the graph represents the shortest path from a point to another point on the surface.
Figure4shows a part of a maximal Poisson-disk sampling of the model St Trophime, resulting from our graph-based dart throw-ing. Observe that the construction of the disks is stopped when the silhouette of an object has been reached, taking into account the topology of the captured surface.
Figure 4: Maximal Poisson-disk sampling of one acquisition of St Trophime, obtained with our graph-based dart throwing. From left to right : front view and side view.
6.2. Resampling a set of 3D acquisitions
Using the local graph approach proposed, the generalization of the Algorithm1is fairly elementary. Let us consider the set G = {G1, G2, G3, ..., Gn} as the set of n local graphs constructed from n
acquisitions. For each graph Gi∈ G :
• Algorithm1is applied on Gi, with the vertices Vi+as candidate
samples,
• for each other graph Gj∈ G, j 6= i, vertices Vjfetch information
about the inclusion (or not) to a specific disk of their correspond-ing vertices in Vi.
Thanks to the local aspect of the dart throwing, and by relying on the construction and verification of disk intersections, only a part of the total data needs to be considered for each potential sample. As a consequence, only the graphs concerned have to be stored in memory.
7. Experimental results
All the experimental results represent real-life scenes of different historical monuments. The acquisitions of Ananda Oak Kyaung, Eim Ya Kyaung, Khaymingha, St Trophime and Wat Phra Si San-phet are courtesy of the CyArk/Google Open Heritage Program.
The acquisitions of Grand Palais are courtesy of Art Graphique et Patrimoine.
All the results have been generated on the same computer [Intel Core i7-5960X CPU @ 3.00GHz, NVIDIA Quadro M5000, 32GB of RAM and 1TB SSD drive].
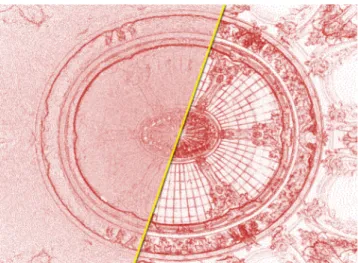
Figure 5shows the difference of distributions obtained on the model Grand Palais, with or without a curvature-aware metric. This curvature-aware metric simply consists in weighting each edge with respect to the curvature between the two vertices linked by this edge. While keeping approximately the same number of points, we can see that the detailed areas are further enhanced. This result highlights the interest of taking into account the curvature during the resampling, which is quite easy thanks to our graph-based approach.
It is interesting to note that one could consider weigthing edges with respect to other metrics, and thus sampling more densely some areas instead of others, by considering for instance a weight de-pending on the position of a point with respect to a region of inter-est.
Figure 5: Part of the Grand Palais (2 billion points, 35 acquisitions) resampled (0.15% of the original number of points) with a uniform distribution (left), or with a curvature-aware distribution (right).
Figure1shows the site of Wat Phra Si Sanphet, Ayutthaya, in Thailand, resampled with our graph-based approach. The original data contains more than 5 billion points, divided in 156 acquisi-tions. Our resampled model contains only 155 millions points. By efficiently distributing the samples according to a curvature-aware approach, we are able to preserve fine-scale details, such as bricks in a wall, despite the expanse of the site.
Another convincing result is shown in Figure6. It represents a close-up view of a statue of the Eim Ya Kyaung temple. Even if this site represents a really big area of 6,000m2, modeled by an orig-inal point cloud composed of 1.7 billion points, our algorithm is able to process it as a whole. We can see that the resulting samples are well distributed and fit closely areas of high curvature, reduc-ing drastically the number of points (0.6% of the original number of points left) while preserving the shape of small scale elements
A. Bletterer, F. Payan, M. Antonini & A. Meftah / A local graph-based representation to resample gigantic acquisitions 7
present in the site. To have an idea of the error induced during the sampling process, and of its impact on the quality of relevant ele-ments of such a huge site, we also present a color-coded represen-tation of the original point cloud, showing how the error is spread. This error represents the distance from the points of the original point cloud to the closest sample of the final distribution. Thanks to the curvature-aware resampling, we can see that the highest errors (biggest distances between original points and samples of the final distribution) are concentrated in areas of low curvature.
Finally, to attest that the piecewise nature of our approach does not introduce any distortion in terms of sampling quality, Figure7
gives a close-up view of two overlapping acquisitions. We can see that the graph correspondences enable to get a globally coherent distribution, and that we cannot distinguish any distortion along the borders.
In Table1, we present the computing times of the proposed al-gorithm on several gigantic data. The construction of the graphs is the longest step, and represents the bottleneck of our algorithm for the biggest acquisitions. However, for a given set of acquisitions, this construction can be done once and for all, independently of the resampling step. So, the graphs can be saved to be used sub-sequently, for any further processing, which lowers the impact of those computations. Concerning the resampling step itself, even if the datasets are big and that our approach is working sequentially, the algorithm is able to provide samplings in few hours (more than 500.000 points processed per second for points clouds around one billion points and nearly 400.000 for point clouds around 5 billion points).
Application to surface reconstruction
To definitively show the interest of our approach in the domain of cultural heritage, Figures8and9show reconstructions gener-ated with the method of [BL17] from points obtained with our re-sampling technique. We used [BL17] because it is able to recon-struct efficiently detailed surfaces, and that the vertices of the re-constructed mesh are exactly the input points. The resulting recon-structions are quite remarkable, thanks to the surface-aware behav-ior of our resampling operation (highlighted by the quality of the final triangulation).
8. Discussion
Even if this paper focused on terrestrial LiDARs acquisitions, it is important to note that the proposed local graph structure can be used on a broader range of acquisition systems, such as aerial LiDARs or Kinect-like acquisitions. Though care should be taken when dealing with the noise generated by Kinect-like systems, since this one can be quite different from the one present in ter-restrial LiDAR acquisitions.
In undersampled areas, the assumption made about depth dispar-ity to link vertices in the graphs might not hold anymore. In such areas, two problems can occur :
• when the scanner is too far from a region, the distance between two neighboring samples in the depth map might be more impor-tant than the size of a hole between two different regions. Thus this would result in a false-negative contour.
• when the laser hits some areas at obtuse angles, the depth be-tween two samples might vary strongly, while still belonging to the same element. This would result in a false-positive contour. Though, such particularities do not pose problems in practice, be-cause undersampled regions are generally covered by other acqui-sitions having a higher density.
When creating a graph from an acquisition, different connectiv-ities could be considered. The choice of connectivity gives some compromise between speed (with a low number of edges per ver-tex) and accuracy (with a higher number of vertices connected to-gether) of the distances computed. In our experiments, we noticed that the 8-connectivity was giving good results, both in terms of speed and accuracy.
For now, we have no guarantee that the resulting distributions will keep all the information present in the original point clouds. This is because the cutting frequency (the radius of the disks) has to be related to the maximal frequency appearing in the spectrum of the point cloud. But to our knowledge, none method is able to compute "frequencies" over massive point clouds like the one pre-sented in this paper. An interesting work would be to study the use of the Laplace-Beltrami operator for such particular data. Though, the provided sampling algorithm gives the guarantee that the er-ror between the point cloud - considered as input of the sampling algorithm - and the final distribution is bounded and will always be proportional the disk radius. Further processes generally pre-condition the maximum number of points that should be kept from the original point clouds (since it influences the computing time). Thus we think that giving the control on the radius of the disks is something essential, even if it might result in a loss of information (undersampling the original point clouds).
9. Conclusion
In this paper we mainly presented two contributions.
Firstly, we introduced a new structure for processing point clouds generated from a set of terrestrial LiDARs. By taking ad-vantage of the structure of depth maps created by LiDARs, local graphs are constructed - describing the local behavior of the surface acquired - and linked together to process the point cloud globally.
Secondly, we presented an efficient resampling method for gi-gantic point clouds, based on our local graph structure. Our objec-tive was to reduce the number of points without altering the visual quality of large and complex sites. Sampling each graph using a maximal Poisson disk sampling ensures a good local quality of the distribution. Correspondences between those graphs enable an ef-ficient resampling of overlapping regions, ensuring a good quality of the distribution globally.
Experimental results have shown that our algorithm is able to take into account the behavior and the local details of the cap-tured surfaces efficiently. In particular we showed that our method generates good curvature-aware resamplings even on gigantic point clouds, and enables surface reconstructions of high quality.
This work has promising perspectives. We are convinced that using a set of connected graphs taking advantage of the topology of
Figure 6: Close-up view of a statue inside the Eim Ya Kyaung temple. Despite the size and complexity of the scene (1.7 billion of points, 58 acquisitions spread over 6,000 m2), our resampling preserves very fine details with only 0.6% of the original number of samples. Maximum error: 6.3cm (between the legs of the statue); Mean error: 0.8cm. Left: original data; middle: our curvature-aware resampling; right: color-coded difference between the original point cloud and the resulting distribution (blue: low error; red: big error). It is interesting to note that the adaptive resampling strategy concentrates the highest errors in the areas of low absolute curvature, where few details are present.
Model In Acquisitions Construction (h:m) Out Sampling (h:m)
Khaymingha
1,383M 74 00:59
44.8M 00:39
Bagan, Myanmar 21.2M 00:39
9.2M 00:46
Ananda Oak Kyaung
1,703M 126 02:14
41.9M 00:56
Bagan, Myanmar 21.9M 00:55
11.6M 01:01
Wat Phra Si Sanphet
5,313M 156 11:56
148.2M 03:49
Ayutthaya, Thailand 76.3M 03:44
37.9M 03:50
Table 1: Performances of our resampling algorithm on real-life acquisitions. In represents the number of points of the original point cloud. Out the number of points of the resulting distributions. Construction represents the time to construct the local graphs structure. Sampling represents the time to sample each graph and to transmit information between graphs. All timings include reading/writing time from/to the disks.
the acquisitions is a relevant structure for many other point cloud processings. For instance, we are currently working on a surface reconstruction algorithm based on the proposed structure. Acknowledgements
Thanks to the anonymous reviewers for their insightful comments. This work is supported by a grant from Région Provence Alpes Côte d’Azur(France).
References
[AW95] AURICHV., WEULEJ.: Non-linear gaussian filters performing edge preserving diffusion. In Mustererkennung 1995. Springer, 1995, pp. 538–545.4
[BL17] BOLTCHEVAD., LEVYB.: Surface reconstruction by computing restricted voronoi cells in parallel. Computer-Aided Design 90 (2017), 123–134.7,9,10
[Bri07] BRIDSONR.: Fast poisson disk sampling in arbitrary dimensions. In SIGGRAPH sketches (2007), p. 22.3
[BWWM10] BOWERSJ., WANGR., WEIL.-Y., MALETZD.: Parallel poisson disk sampling with spectrum analysis on surfaces. ACM Trans-actions on Graphics (TOG) 29, 6 (2010), 166.3
[CCS12] CORSINIM., CIGNONIP., SCOPIGNOR.: Efficient and flex-ible sampling with blue noise properties of triangular meshes. IEEE
Transactions on Visualization and Computer Graphics 18, 6 (2012), 914–924.3
[Coo86] COOKR. L.: Stochastic sampling in computer graphics. ACM Trans. Graph. 5, 1 (Jan. 1986), 51–72. URL:http://doi.acm. org/10.1145/7529.8927,doi:10.1145/7529.8927.3,5
[CTF∗18] CHENS., TIAN D., FENGC., VETROA., KOVA ˇCEVI ´CJ.: Fast resampling of three-dimensional point clouds via graphs. IEEE Transactions on Signal Processing 66, 3 (2018), 666–681.2,3,5
[Dij59] DIJKSTRA E. W.: A note on two problems in connex-ion with graphs. Numer. Math. 1, 1 (Dec. 1959), 269–271. URL:http://dx.doi.org/10.1007/BF01386390,doi:10. 1007/BF01386390.6
[EBN13] ELSEBERGJ., BORRMANN D., NÜCHTER A.: One billion points in the cloud–an octree for efficient processing of 3d laser scans. ISPRS Journal of Photogrammetry and Remote Sensing 76(2013), 76– 88.2
[GZ06] GRIMMC., ZORIND.: Surface modeling and parameterization with manifolds: Siggraph 2006 course notes. ACM, 2006.4
[HWB∗13] HORNUNGA., WURMK. M., BENNEWITZM., STACHNISS
C., BURGARD W.: Octomap: An efficient probabilistic 3d mapping framework based on octrees. Autonomous Robots 34, 3 (2013), 189– 206.2
[LZZ13] LOOPC., ZHANG C., ZHANGZ.: Real-time high-resolution sparse voxelization with application to image-based modeling. In Pro-ceedings of the 5th High-Performance Graphics Conference (2013), ACM, pp. 73–79.2
A. Bletterer, F. Payan, M. Antonini & A. Meftah / A local graph-based representation to resample gigantic acquisitions 9
Figure 7: Our point clouds do not suffer from any distortion in terms of sampling quality, despite its piecewise nature. Top row: two acquisitions overlapping each other, leading to strong density variations in the original point cloud. Bottom row: two uniform dis-tributions, with different densities, obtained with our graph-based approach. For visualization purposes, low density samplings have been targeted.
[PGA01] PIERACCINIM., GUIDIG., ATZENIC.: 3d digitizing of cul-tural heritage. Journal of Culcul-tural Heritage 2, 1 (2001), 63–70.1
[PK05] PENGJ., KUOC.-C. J.: Geometry-guided progressive lossless 3d mesh coding with octree (ot) decomposition. In ACM Transactions on Graphics (TOG)(2005), vol. 24, ACM, pp. 609–616.2
[PKA∗07] PAVLIDIS G., KOUTSOUDIS A., ARNAOUTOGLOU F., TSIOUKASV., CHAMZASC.: Methods for 3d digitization of cultural heritage. Journal of cultural heritage 8, 1 (2007), 93–98.1
[PKTD07] PARISS., KORNPROBSTP., TUMBLINJ., DURANDF.: A gentle introduction to bilateral filtering and its applications. In ACM SIGGRAPH 2007 courses(2007), ACM, p. 1.4
[PPA15] PEYROT J.-L., PAYAN F., ANTONINI M.: Direct blue noise resampling of meshes of arbitrary topology. The Visual Computer 31, 10 (October 2015), 1365–1381. doi:10.1007/ s00371-014-1019-1.3
[PTSZ11] PIETRONIN., TARINIM., SORKINEO., ZORIND.: Global parametrization of range image sets. In ACM Transactions on Graphics (TOG)(2011), vol. 30, ACM, p. 149.3,5
[RGM∗12] RODRIGUEZM. B., GOBBETTIE., MARTONF., PINTUS
R., PINTOREG., TINTIA.: Interactive exploration of gigantic point clouds on mobile devices. In VAST (2012), pp. 57–64.2
[RH10] RYDEJ., HUH.: 3d mapping with multi-resolution occupied voxel lists. Autonomous Robots 28, 2 (2010), 169.2
[RSB93] RIVESTJ.-F., SOILLEP., BEUCHERS.: Morphological gradi-ents. J. Electronic Imaging 2, 4 (1993), 326–336.4
[SB97] SMITHS. M., BRADYJ. M.: Susan—a new approach to low level image processing. International journal of computer vision 23, 1 (1997), 45–78.4
[SNF∗13] SHUMAN D. I., NARANG S. K., FROSSARD P., ORTEGA
A., VANDERGHEYNSTP.: The emerging field of signal processing on graphs: Extending high-dimensional data analysis to networks and other irregular domains. IEEE Signal Processing Magazine 30, 3 (2013), 83– 98.5
Figure 8: Part of a sampling generated from the Wat Phra Si San-phet site, and reconstruction obtained considering those selected samples as an input of [BL17].
[SZW09] SCHEIBLAUERC., ZIMMERMANNN., WIMMERM.: Interac-tive domitilla catacomb exploration. In Proceedings of the 10th Interna-tional conference on Virtual Reality, Archaeology and Cultural Heritage (2009), Eurographics Association, pp. 65–72.2
[TM98] TOMASI C., MANDUCHIR.: Bilateral filtering for gray and color images. In Computer Vision, 1998. Sixth International Conference on(1998), IEEE, pp. 839–846.4
[Uli88] ULICHNEYR. A.: Dithering with blue noise. Proceedings of the IEEE 76, 1 (1988), 56–79.3
Figure 9: Surfaces reconstructed using [BL17] from the pro-posed curvature-aware resampling. Top : Statues inside theEim Ya Kyaung temple and close-up view of the details of the cape. Bottom : Statue inside theKhaymingha temple and close-up view of the quality of the triangulation produced, a direct consequence of the good distribution of samples.

![Figure 8: Part of a sampling generated from the Wat Phra Si San- San-phet site, and reconstruction obtained considering those selected samples as an input of [BL17].](https://thumb-eu.123doks.com/thumbv2/123doknet/13407490.406821/10.892.81.435.121.390/figure-sampling-generated-reconstruction-obtained-considering-selected-samples.webp)
![Figure 9: Surfaces reconstructed using [BL17] from the pro- pro-posed curvature-aware resampling](https://thumb-eu.123doks.com/thumbv2/123doknet/13407490.406821/11.892.77.441.122.954/figure-surfaces-reconstructed-using-posed-curvature-aware-resampling.webp)
![[PDF] Introduction à la conception objet et à c++ | Cours informatique](data:image/gif;base64,R0lGODlhAQABAIAAAP///wAAACH5BAEAAAAALAAAAAABAAEAAAICRAEAOw==)