HAL Id: hal-02336476
https://hal.archives-ouvertes.fr/hal-02336476
Submitted on 30 Oct 2019
HAL is a multi-disciplinary open access archive for the deposit and dissemination of sci-entific research documents, whether they are pub-lished or not. The documents may come from teaching and research institutions in France or abroad, or from public or private research centers.
L’archive ouverte pluridisciplinaire HAL, est destinée au dépôt et à la diffusion de documents scientifiques de niveau recherche, publiés ou non, émanant des établissements d’enseignement et de recherche français ou étrangers, des laboratoires publics ou privés.
Effect of Asymmetric Anchoring Groups on Electronic
Transport in Hybrid Metal/Molecule/Graphene Single
Molecule Junctions
Chunhui He, Qian Zhang, Yinqi Fan, Cezhou Zhao, Chun Zhao, Jingyao Ye,
Yannick Dappe, Richard Nichols, Li Yang
To cite this version:
Chunhui He, Qian Zhang, Yinqi Fan, Cezhou Zhao, Chun Zhao, et al.. Effect of Asymmetric Anchor-ing Groups on Electronic Transport in Hybrid Metal/Molecule/Graphene SAnchor-ingle Molecule Junctions. ChemPhysChem, Wiley-VCH Verlag, 2019, 20 (14), pp.1830-1836. �10.1002/cphc.201900424�. �hal-02336476�
1
Effect of Anti-Symmetric Anchoring Groups on Electronic Transport in Hybrid Metal/Molecule/Graphene Single Molecule Junctions
Chunhui He, 1,2 Qian Zhang,1,2 Yinqi Fan, 1,2 Cezhou Zhao,3 Chun Zhao,3Jingyao Ye,4
Yannick J. Dappe,5 Richard J. Nichols,2 Li Yang*1,2
1. Department of Chemistry, Xi’an-Jiaotong Liverpool University, 215123, Suzhou, China.
2. Department of Chemistry, University of Liverpool, Liverpool, L69 7ZD, UK.
3. Department of Electrical and Electronic Engineering, Xi’an-Jiaotong Liverpool University, 215123, Suzhou, China
4.Department of Chemistry, Copenhagen University, Copenhagen, Denmark. 5. SPEC, CEA, CNRS, Université Paris-Saclay, CEA Saclay 91191 Gif-sur-Yvette Cedex, France
AUTHOR INFORMATION Corresponding Author
2
Abstract
A combined experimental and theoretical study on molecular junctions with asymmetry in both the electrode type and asymmetry in the anchoring group type is presented here. A scanning tunneling microscope is used to create the “anti-symmetric” Au-S-(CH2)n
-COOH-graphene molecular junctions and determine their conductance. These measurements are combined with electron transport calculations based on Density Functional Theory (DFT) to analyze the electrical conductance and its length attenuation factor from a series of junctions of different molecular length (n). Our results show an unexpected trend with a rather high conductance and a smaller attenuation factor for the Au-S-(CH2)n-COOH-graphene configuration compared to the
equivalent junction with the “symmetrical” COOH contacting using the HOOC-(CH2)n
-COOH series. Due to the effect of the graphene electrode, the attenuation factor is also smaller than the one obtained for Au/Au electrodes. These results are interpreted through the relative molecule/electrode couplings and molecular level alignments as determined with DFT. We show that in an anti-symmetric junction, the electrical current flows through the less resistive conductance channel, similarly to what is observed in the macroscopic regime.
Introduction
Aviram and Ratner first proposed the creative idea of using molecules as rectifiers by connecting molecules within a sandwich structure.1 Since then,molecular electronics has been put forward as a notion for extending the physical scale limits of conventional silicon integrated circuits. In terms of technical breakthrough in the measurement of electrical current through “molecular circuits” a key breakthrough was made in 1988 by Aviram et al., who deployed a scanning tunneling microscope (STM) to observe the
I-V characteristics of an “anti-symmetrical” semiquinone containing molecular bridges
(by “anti-symmetrical” we mean here molecular bridges which do not have a center of symmetry, either as a result of their intrinsic molecular symmetry or as a result of different contacting to the electrode contacts at either end). This was a seminal attempt
3
to measure the electrical properties of single molecules using a STM to record the I-V response for molecular junctions (MJs).1 Today, mechanically controlled break junctions (MCBJ)2, scanning tunneling microscopy-break junctions (STM-BJ)3, conductive probe atomic scanning force microscopy (CP-AFM)4 and STM I(s)5 (I = current, s = distance) have all been developed as effective methods to characterize the essential properties of MJs. Examples of the use of these techniques to study the electrical characteristics of single molecule can be found in review.6-12
So far, well-studied molecular junction systems most often have symmetric configurations, for instance using molecules terminated with similar anchoring groups at each extremity of the junction, including dithiol13-15 , diamine14, 16 and dicarboxylic acid14, 17etc. Likewise, the majority of single-molecule electrical studies have used the same metal contact types on either respective side, with gold being the most common 6-12, although other electrodes have been used such as Cu18, 19 and Ag18 etc. There have
also been a selection of studies where different contact electrodes have been used for example gold as one contact, with the second contact being graphite or graphene20 or semiconductors such as gallium arsenide21or silicon.22 Nevertheless, the majority of single molecule electrical characterizations have been carried out with both symmetrical molecules and identical metal contact types at either end of the molecular bridge. Such symmetrical MJ configurations have been welcome since they are generally most readily constructed particularly with gold contacts and have formed the testbed for most fundamental studies of charge flow through single molecule junctions.6-12 However, anti-symmetrical configurations occur opportunities for new
ways of generating electrical functionality as such rectification, switching, molecular transistor behavior and charge storage. Indeed, some of the founding studies in molecular electronics demonstrated rectification through the use of directionally orientated and non-symmetric molecular monolayers, formed for example by Langmuir-Blodgett methods.23, 24 A number of studies25 have attempted to describe how introducing asymmetry into single molecule electrical junctions can impact on the
4
current-voltage or electrical conductance response. For example, Martin et al.26 found that a series of molecules (SH-(CH2)n-COOH) with anti-symmetric anchoring groups
exhibits a lower conductance than their comparable symmetric molecules. On the other hand, Wang et al.27 presented an investigation of 1,4-disubstituted benzene molecular junctions and they analyzed molecular rectification and the impact arising from anti-symmetric anchoring groups. Diez-Perez et al.28 have achieved current rectification at the single molecule level by controlling the orientation of a non-symmetric diblock dipyrimidinyldiphenyl molecule bound between a pair of gold electrode contacts which responded as a single molecule diode. Other examples of the use of anti-symmetric MJs to create the future single-molecule information processing devices (rectification, switching and negative differential resistance) can be found in review.29
In our previous works, we have investigated anti-symmetric hybrid Au-molecule-graphene junctions, where the anti-symmetry arises from the different contacts at either ends of the molecular bridge. In these studies a number of different anchoring groups have been employed (dithiol30, 31, diamine32, and dicarboxylic acid33). We found that the anti-symmetric MJs with a graphene bottom electrode contact lead to a lower current attenuation factor (decay constant, -factor) than the corresponding symmetric gold-molecule-gold junctions. These results bring in new perspectives for enhanced conductance at longer molecular length. It is also clear that the mechanism of transport properties for molecule-graphene junctions is remarkably different from the gold-molecule-gold counterpart. Anti-symmetric graphene/gold contacts open new routes for controlling the electrical properties of single-molecule junctions. We now extend this work by combining two anti-symmetric elements (anti-symmetric anchoring groups and anti-symmetric electrodes) simultaneously into one molecular junction. The molecular bridges deployed in this study are polymethylene (alkane) chains with different lengths terminated on one side by a carboxylic acid anchoring group and on the other end by a thiol moiety. The electrodes are a STM gold tip and a graphene bottom electrode. The conductance of these junctions is measured using a so-called
5
STM I(s) method, which can be considered as a variant of the in situ break junction method (in situ BJ). In this technique the STM tip is used to form molecular junctions by approaching very close to the graphene substrate, but direct physical contacting between the gold tip and graphene is avoided to prevent damage to either. In this study, we found that the conductance of Au-S-(CH2)n-COOH-graphene junctions decays
exponentially with the number of methylene groups with an attenuation factor of 0.37 per molecular unit length, similar to the alkanedithiol molecular bridges tethered between gold and graphene electrodes. These anti-symmetric junctions with Au/graphene contacts present a higher conductance than those formed with symmetric molecular bridges with carboxylic acid anchoring groups. However, the conductance of Au-S-(CH2)n-COOH-graphene junctions is found to be lower than the equivalent
junctions with thiol moieties on both ends of the molecular junction (i.e. Au-S-(CH2)n
-SH-graphene electrodes). In this respect it is noted that the attenuation factor is driven by the low attenuation channel conductance associated with the thiol group. Density Functional Theory (DFT) calculations confirm this feature and help in interpreting the obtained attenuation factors and relative conductance values.
Experimental methods
In this experiment, gold-molecule-graphene junctions were formedusing the STM-I(s) method6 (Bruker Multimode 8 microscope) and all the conductance measurements were performed under a stable liquid (mesitylene) environment. Gold wires (99.99%) bought from Tianjing Lucheng Metal were made into STM tips by electrochemical etching as has been reported previously.34 The 1 × 1 cm size graphene substrates (Graphene Supermarket, US) were used as the bottom electrode. During the conductance measurement, the graphene substrate was fixed onto the sample plate using silver gel to make the electrical contact between the graphene and the metal sample plate. The target molecules were prepared as 10 mM solution in mesitylene (99%, Aladdin) and the solution was placed in a liquid cell and first allowed to stabilize before the formation of MJs. The gold STM tip was set at an initial vertical distance (4 nm) and then toward
6
to the graphene substrate. The gold tip was then retracted to its initial distance, and the process of approach and retraction cycle was repeated continuously to obtain a large number of I(s) curves. The tip bias in each experiment was set at + 0.3 V unless otherwise stated. Over 10000 I(s) curves were collected from the conductance measurements of each MJ. The I(s) curves which present big noise and no plateau were removed. The remaining I(s) curves were divided into a few equal bins according to the position of the plateaus. More than 500 I(s) curves from the bins with the most I(s) curves were selected for data analysis. The selected current data was converted into conductance values to obtain a one-dimensional (1D) conductance histogram. A Gaussian fit was applied to the most prominent peak in the 1D histogram. The conductance data was also used to plot the two-dimensional (2D) frequency histograms to locate the most probable range for the conductance value of molecular junctions. The color of specific area in 2D histogram ranges from blue (low count) to red (high count) as an indicator of an increasing number of data point within this area. To verify the configuration of MJs, control experiments were conducted. The gold STM tips were dipped into either SH-(CH2)7-COOH or SH-(CH2)11-COOH containing solutions for 24
hours in order to promote close-packed surface coverage of the molecular target on the gold STM tip. This procedure will favor of the formation of Au-S-(CH2)n
-COOH-graphene molecular junctions (the H atom is expected to be removed through the formation of Au-S, as has been observed previously21). The measurement was carried out punctually on the day following the 24 hour adsorption period to form the molecular film on the gold STM tips. The collected I(s) curves were closely monitored and the new gold STM tip was generally changed if after a few hours no further plateaus were observed in the I(s) traces.
Results and discussions
The conductance of a series of hybrid graphene/molecular junctions has been measured. Figure 1 shows typical I(s) traces of molecular junctions during the opening process of the STM-I(s) method. Two types of curves are presented. The black exponential decay
7
curve which shows no current steps indicates the absence of molecular junction formation. When a molecular junction is captured between the two electrodes, a pronounced plateau appears as can be observed in other color curves. The plateau is due to the enhanced current through the molecule, with the position of the plateaus reflecting the MJ conductance. For example,the conductance of Au-S-(CH2)7
-COOH-Graphene junctions is around 4-6 nS, while the conductance of the shorter Au-S-(CH2)5-COOH-Graphene junctions is located at around 10-15 nS. To find the dominant
location of conductance from a large amount of raw data, selected plateau curves were used to plot 1D and 2D histograms as shown in Figure 2a and 2b. In Figure 2a, a significant peak is observed for the Au-S-(CH2)7-COOH-Graphene molecular junctions,
giving a peak conductance value of around 5 nS after a Gaussian curve fit is applied. The corresponding 2D histogram is presented in Figure 2b. In this 2D plot a high count feature is apparent, as seen in the red area located at around 4 to 6 nS; this is in good agreement with the peak in Figure 2a and the plateaus for this MJ (Figure 1).
Although these MJs are anti-symmetric, only a single conductance peak is observed indicating that the two different orientations, with the thiol bound to either graphene or gold, respectively, do not give discernable conductance values. Here it is noted that thiols (thiolates) bind much more strongly with gold than carboxylic acid end groups do, so from this fact it would appear likely that Au-S-(CH2)7-COOH-graphene
junctions would be favored over Au-COOH-(CH2)7-S-graphene junctions. Differences
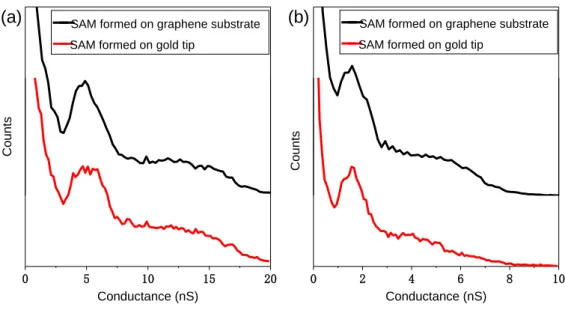
in MJs formed with either thiol (thiolate) or carboxylic (carboxylate) anchoring groups to gold has been previously studied. It was found that when changing from a thiol to a carboxylic acid anchor the contact resistance increased, and this increase was correlated with the decrease in bond strength with the Au surface.14 Control experiments have also been carried out in which the self-assembly of the target molecules was done in two different ways. The comparison here was to either (a) form the SAM on the graphene substrate or (b) to form the SAM directly onto the gold STM tip. Figure 3 shows a comparison of MJ conductance using these two different self-assembly modes. For
SH-8
(CH2)7-COOH (Figure 3a) and SH-(CH2)11-COOH (Figure 3b), it is seen that the
conductance value of SAM formed on the gold tip and graphene substrate are essentially similar to each other.
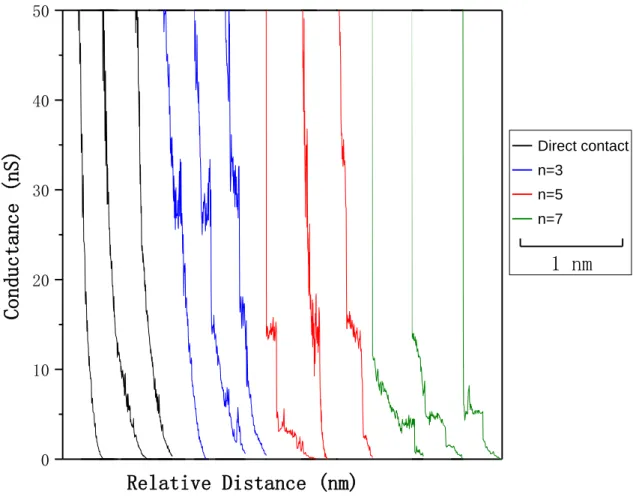
0 10 20 30 40 50 — Direct contact — n=3 — n=5 — n=7
Relative Distance (nm)
Conductance (nS)
1 nm
Figure 1: Typical I(s) curves of SH-(CH2)n-COOH, with n = 3 (blue), 5 (red) and 7 (green).
The black curve is recorded in absence of molecules on graphene (without forming molecular junctions).
9 0 4 8 12 16 20 0 1000 2000 3000 0 1 2 3 4 0 5 10 15 20 High (b) (a) C o nductance (nS) C o unts
Conductance (nS) Retraction Distance (nm)
Low
Figure 2: (a) A 1D histogram for the Au-S-(CH2)7-COOH -graphene hybrid junction (from
selected 534 I(s) curves). (b) The corresponding 2D histogram, where the red colour represents high point count. The distance is the retraction distance from the set point
conditions. 0 5 10 15 20 0 2 4 6 8 10 Co u n ts Co u n ts Conductance (nS)
━━SAM formed on graphene substrate ━━SAM formed on gold tip
(b) ━━ SAM formed on graphene substrate ━━SAM formed on gold tip
(a)
Conductance (nS)
Figure 3 : Comparison of molecular conductances between SAMs formed on graphene substrate (black) and SAMs (red) formed on gold tip (a) SH-(CH2)7-COOH (b) SH-(CH2)11-COOH.
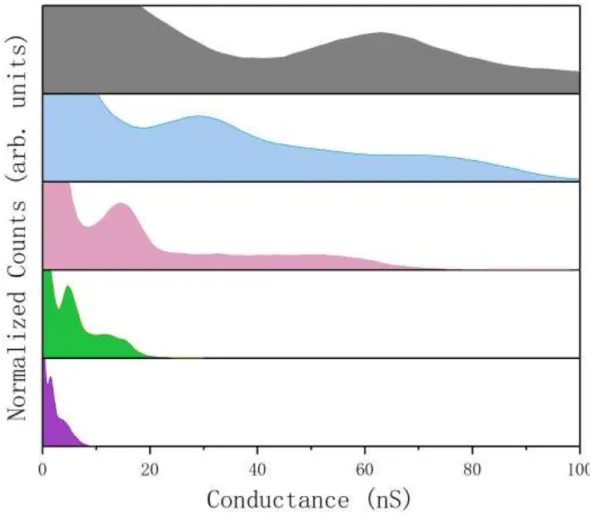
Figures 4 presents the five conductance histograms with the same scaling in order to compare the conductance peaks for different molecular lengths. Only a single main
10
peak was found for each histogram, and the conductance values of SH-(CH2)1-COOH
(grey), SH-(CH2)3-COOH (blue), SH-(CH2)5-COOH (pink), SH-(CH2)7-COOH (green)
and SH-(CH2)11-COOH (purple) are determined to be 63, 30, 15, 4.9, and 1.7 nS,
respectively. As expected, the conductance decreases as the molecular length increases; clearly the molecular backbone lengths play a key important role in determining the magnitude of the molecular conduction.35 It has been demonstrated that for a wide variety of different anchoring groups (-SH14, 30, 36,-NH214, 32, 36,-COOH14, 33, 37,-I38 …) in
the case of polymethylene (alkane) backbones conductance decreases sharply with molecular length, generally satisfying the well-known equation:
𝐺 = 𝐴exp(−𝛽𝑛𝑁)
where G is the conductance, 𝛽𝑛 is the attenuation factor per number of –CH2 units, N
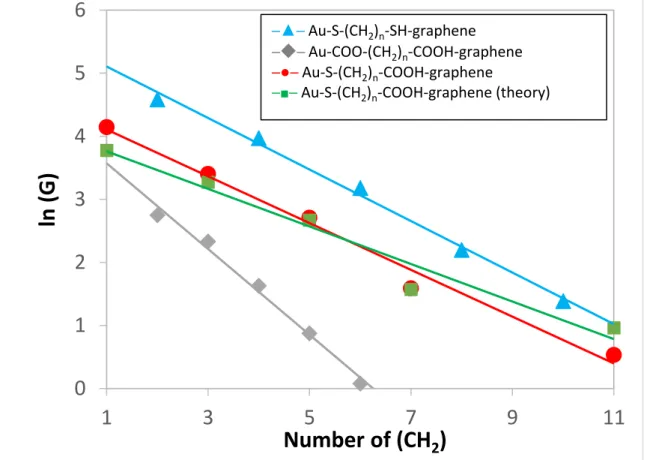
is the number of phenyl groups and A is a constant related to the contact resistance between the molecular target and the electrode. The slope of the plot of ln (G) versus N gives the 𝛽𝑛 value. Figure 5 shows the natural logarithmic plots of the conductance as a function of the number of methylene groups for Au-S-(CH2)n-SH-graphene(blue),
Au-COO-(CH2)n-COOH-graphene(grey), Au-S-(CH2)n-COOH-graphene(red) and
Au-S-(CH2)n-COOH-graphene(theory, green). The measured conductance decreases with the
molecular length and the linear fit yields a tunneling decay constant of around 0.37 per methylene unit for Au-S-(CH2)n-COOH-graphene junctions.
11
Figure 4 : Conductance histograms for SH-(CH2)n-COOH junctions in which n = 1 (grey), 3 (blue),
5 (red), 7 (green), and 11 (purple).
Table 1 summarizes the conductance values and tunnelling decay constants (𝛽𝑛) of the anti-symmetric MJs (SH–(CH2)n–COOH) and symmetric MJs (SH–(CH2)n–SH,
COOH–(CH2)n–COOH) with Au/Au electrodes and Au/graphene electrodes. We found
that the decay constant of Au/S-(CH2)n-COOH/graphene junctions is lower than the
Au/S-(CH2)n-COOH/Au junctions.37
Table 1 Conductance values and tunneling decay constant (𝛽) for SH–(CH2)n–COOH, SH–(CH2)n–
SH and COOH–(CH2)n–COOH
Molecular junctions Number of
CH2
Conductance (nS) Decay constant (𝛽𝑛)
12 Au/S-(CH2)n-COOH /graphene 1 63 43.6 0.37 0.30 3 30 26.4 5 15 14.4 7 4.9 4.81 11 1.7 2.62 Au/ S-(CH2)n-SH /graphene30, 32 2 98 152 0.40 0.32 4 53 46 6 24 25 8 9 18 10 4 6 Au/ COO-(CH2)n -COOH /graphene33 2 15.6 38.5 0.69 0.69 3 10.3 13 4 5.1 5.3 5 2.4 4 6 1.08 2.2 Au/ S-(CH2)n-COO /Au 26 5 2.5 0.87 7 0.88 Au/ S-(CH2)n-S /Au13, 14 6 28.2 1.08 8 3.9 10 0.2 Au/ COO-(CH2)n -COO /Au 26 6 2.48 0.78 8 0.80
Similarly to our previous results30, 32, 33 , junctions with Au/graphene electrodes yield a
lower decay constant compared to the similar MJs with symmetric gold electrodes resulting in a higher conductance for MJs with alkane backbone at longer lengths. Our experimental results show that the decay constant (0.37) of Au-S-(CH2)n
-COOH-graphene junctions is smaller than that obtained for Au-S-(CH2)n-SH-graphene
13
molecules measured between Au/Au electrodes.26 In Figure 5, we present the evolution
of the logarithm of the conductance vs. the molecular length for the different Au/graphene MJs considered in this work, as well as theoretical results. We can now classify the different MJs according to their respective conductance values from the highest to the lowest as: Au-S-(CH2)n-SH-graphene junctions, Au-S-(CH2)n
-COOH-graphene junctions, Au-COO-(CH2)n-COOH-graphene junctions.
Figure 5 : Natural logarithmic plots of the conductance as a function of the number of methylene groups for Au-S-(CH2)n-SH-graphene(blue), Au-COO-(CH2)n-COOH-graphene(grey),
Au-S-(CH2)n-COOH-graphene(red) and Au-S-(CH2)n-COOH-graphene(theory, green)
Extending the linear fits in Figure 5 to the origin, we can get the value of the contact resistance. The contact resistance of Au-S-(CH2)n-SH-graphene junctions,
Au-S-(CH2)n-COOH-graphene junctions and Au-COO-(CH2)n-COOH-graphene junctions
are 3.9 MΩ30, 11.3 MΩ and 14.2 MΩ33, respectively. This difference indicates that the
coupling is rather weak at the carboxylate group-electrode interface.
0
1
2
3
4
5
6
1
3
5
7
9
11
─▲─Au-S-(CH2)n-SH-graphene ─◆─Au-COO-(CH2)n-COOH-graphene ─●─Au-S-(CH2)n-COOH-graphene─■─Au-S-(CH2)n-COOH-graphene (theory)
Number of (CH
2)
ln (
14
In order to understand the underlying physical mechanism at the origin of this phenomenon, we have performed Density Functional Theory (DFT) calculations on these junctions. Following a now well-established procedure21,23, we have considered
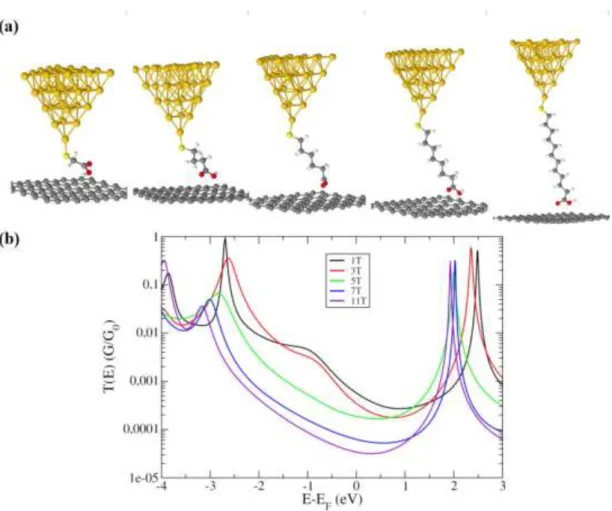
Au-S-(CH2)n-COOH-graphene junctions, for n = 1,3,5,7,11, as represented in Figure 6
(a). After structural optimization, electronic structure has been determined as well as electronic transport properties using a Keldysh-Green formalism.21 The evolution of the
electronic transmission is represented in Figure 6 (b).
Figure 6 : (a) Atomic representation of the Au-S-(CH2)n-COOH-graphene junctions calculated in
DFT. (b) Corresponding electronic transmissions.
From those transmissions, we can observe that the electronic transport in the Au-S-(CH2)n-COOH-graphene junctions lies in the non-resonant tunnelling regime, since the
Fermi level is in the gap, slightly closer to the LUMO level. Hence, the transport properties are driven by the LUMO level and its position with respect to the Fermi level represents a key parameter for the determination of the attenuation factor. Indeed, from
15
a simple barrier tunnelling model, 𝛽𝑛 can be expressed as: 𝛽𝑛=2𝑑0√(2mφ)/ℏ where
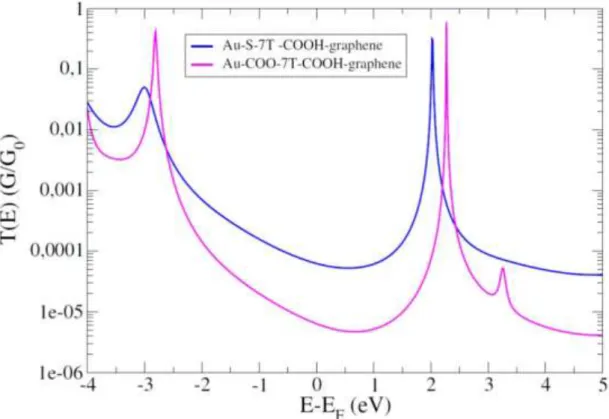
𝑑0 is the unit length between the monomers in the molecule, m is the mass of the electron, and φ is the barrier height, corresponding here to the energy difference between the LUMO and the Fermi level. In order to understand the obtained value for the attenuation factor, we have also calculated the electronic transmission of the Au-COO-(CH2)7 –COOH-graphene junction. This transmission is presented in Figure 7, in
comparison with the transmission of the Au-S-(CH2)7-COOH-graphene junction. As we
can observe, the two transmission curves are very similar in shape, with a gap of about 5 eV and an electronic conductance slightly dominated in both cases by the LUMO level. Although the shapes and gap of these two transmission curves are similar, the conductance at the Fermi level clearly differs.
Figure 7 : evolution of the calculated electronic transmissions for Au-S-7T-COOH-graphene and Au-COO-6T-COOH-graphene molecular junctions.
Referring to Figure 7, the LUMO level in the junction with –COO(H) contacting groups at both molecular ends (“full COOH junction”) is located at about 2.4 eV from the Fermi level, which is a bit farther than in the case of the S-COOH junction, where the
16
LUMO is located at about 2 eV. This latter value is due to the stronger coupling of the sulphur atom to the gold electrode26. This results in a slightly smaller electronic barrier
for the anti-symmetric junction. Hence, by referring to the expression for 𝛽𝑛, we can deduce that the attenuation factor will be reduced for the Au-S-(CH2)n
-COOH-graphene junctions with respect to the full COOH junctions, in a similar manner to the observation for the Au-S-(CH2)n-SH-graphene junctions. Another way of interpreting
this value is to consider that the electrons choose the less resistive conductance channel offered by the coupling of the sulphur group to the electrode, as observed in macroscopic electronic circuits. In the case of Au/Au electrodes, Martín et al.26 also
measured the conductance of X–bridge–X, X–bridge–Y and Y–bridge–Y (X=thiol terminus and Y=COOH) molecular bridges and their results showed that the anti-symmetric configuration (Au-S-(CH2)n-COO-Au) produces the lowest conductance. In
this respect, our present results show an unexpected trend in Figure 5 with a rather high conductance for the Au-S-(CH2)n-COOH-graphene configuration with respect to the
Au-COO-(CH2)n-COOH-graphene configuration. To elucidate this peculiar behaviour,
we analyse these two junctions within the frame of a single level model39. Here, the
LUMO level determines the conductance and therefore, the electronic transmission at the Fermi energy can be expressed as:
T(𝐸𝐹)= 4𝛤𝐿𝛤𝑅/[(E𝐿−𝐸𝐹)2+(𝛤𝐿+𝛤𝑅)2]
with 𝛤𝐿/𝑅 the left (right) coupling to the electrodes (namely 𝛤𝑆−𝐴𝑢 or 𝛤𝐶𝑂𝑂−𝐴𝑢 for
𝛤𝐿 and 𝛤𝐶𝑂𝑂𝐻−𝑔𝑟𝑎𝑝ℎ𝑒𝑛𝑒 for 𝛤𝑅), 𝐸𝐿− 𝐸𝐹 the energy difference between the LUMO and the Fermi level, namely, the electronic barrier potential of the system. Comparing the Au-S-(CH2)n-COOH-graphene to the Au-COO-(CH2)n-COOH-graphene, it is
known from Ref [19] that 𝛤𝑆−𝐴𝑢 > 𝛤𝐶𝑂𝑂−𝐴𝑢 (respectively 0.6 and 0.4 eV). Moreover, from Figure 7, 𝐸𝐿− 𝐸𝐹 is smaller for the anti-symmetric junction than for the full COOH junction (respectively 2 and 2.4 eV). Consequently, considering these values and 𝛤𝐶𝑂𝑂𝐻−𝑔𝑟𝑎𝑝ℎ𝑒𝑛𝑒 necessarily smaller than 𝛤𝑆−𝐴𝑢 or 𝛤𝐶𝑂𝑂−𝐴𝑢 (due to the weak
17
coupling at the molecule/graphene interface), we find that 𝑇(𝐸𝐹) is higher for the anti-symmetric junction than for the full COOH junction, which confirms the experimental and theoretical results presented in Figure 5. From this analysis, we can deduce that the anti-symmetric Au-S-(CH2)n-COOH-graphene junction is more conductive than the
corresponding Au-COO-(CH2)n-COOH-graphene junction due to the stronger coupling
at the S-Au interface, which has an effect both on the coupling strength 𝛤𝑆−𝐴𝑢 and on
the reduced potential barrier 𝐸𝐿− 𝐸𝐹. Hence, the electronic and transport properties of
the anti-symmetric junction are driven by the most favourable conductance channel related to the thiol anchoring group.
Conclusions
In summary, we have studied the conductance of the anti-symmetric SH-(CH2)n-COOH
molecular junctions (n = 1, 3, 5, 7 and 11), using graphene bottom and gold top electrodes. The conductance decays exponentially with the number of methylene groups with an attenuation factor of 0.37, much lower than the value obtained with Au/Au electrodes. The obtained value is very similar to the one found for alkanedithiols, and smaller than for alkanedicarboxylic acids in the same configuration. Moreover, the conductance is also close to the one of the alkanedithiol, contrary to what is observed in Au/Au junctions. DFT-based electronic transport calculations and analysis of the relative molecule/electrode couplings and molecular level alignments confirm these features. As a result, the electronic transport properties of the anti-symmetric junctions are enhanced by the introduction of the graphene electrode, and driven by the most coupled anchoring group, namely the thiol group. In other words, the current in anti-symmetric junctions flows along the most favourable conductance channel associated to the sulphur atom, similarly to what happens in macroscopic circuits.
Author Contributions
Chunhui He carried out the main experiments and wrote the first draft of the manuscript, Li Yang, Yannick J. Dappe and Richard J. Nichols designed experiments and wrote the
18
manuscript; Qian Zhang, Yinqi Fan and Jingyao Ye conducted other complementary experiments; Cezhou Zhao and Chun Zhao analyzed experimental results. Yannick J. Dappe developed the simulation work and analyzed sequencing simulation data. All authors have given approval to the final version of the manuscript.
Acknowledgements
This work was supported by the National Natural Science Foundation of China (NSFC Grants 21503169, 21750110441), Suzhou Industrial Park Initiative Platform Development for Suzhou Municipal Key Lab for New Energy Technology (RR0140), Key Program Special Fund in XJTLU (KSF-A-04 and KSF-E-28) and the XJTLU Research Development Fund (RDF-14-02-42 and RDF-16-01-33).
References
1. A. Aviram and M. A. Ratner, Chem. Phys. Lett., 1974, 29, 277-283. 2. M. A. Reed, Science, 1997, 278, 252-254.
3. B. Q. Xu and N. J. J. Tao, Science, 2003, 301, 1221-1223.
4. X. D. Cui, A. Primak, X. Zarate, J. Tomfohr, O. F. Sankey, A. L. Moore, T. A. Moore, D. Gust, G. Harris and S. M. Lindsay, Science, 2001, 294, 571-574. 5. W. Haiss, H. van Zalinge, S. J. Higgins, D. Bethell, H. Hobenreich, D. J.
Schiffrin and R. J. Nichols, J. Am. Chem. Soc., 2003, 125, 15294-15295. 6. S. V. Aradhya and L. Venkataraman, Nat Nanotechnol, 2013, 8, 399-410. 7. F. Chen and N. J. Tao, Accounts Chem. Res., 2009, 42, 429-438.
8. S. Marques-Gonzalez and P. J. Low, Aust J Chem, 2016, 69, 244-253. 9. R. J. Nichols and S. J. Higgins, Annu Rev Anal Chem, 2015, 8, 389-417. 10. R. J. Nichols and S. J. Higgins, Curr. Opin. Electrochem., 2017, 4, 98-104. 11. K. Wang and B. Q. Xu, Topics Curr Chem, 2017, 375, 1-43.
12. D. Xiang, X. L. Wang, C. C. Jia, T. Lee and X. F. Guo, Chem Rev, 2016, 116, 4318-4440.
13. S. Y. Jang, P. Reddy, A. Majumdar and R. A. Segalman, Nano Lett., 2006, 6, 2362-2367.
14. F. Chen, X. L. Li, J. Hihath, Z. F. Huang and N. J. Tao, J. Am. Chem. Soc., 2006, 128, 15874-15881.
15. N. B. Zhitenev, H. Meng and Z. Bao, Phys Rev Lett, 2002, 88, 226801.
16. L. Venkataraman, J. E. Klare, C. Nuckolls, M. S. Hybertsen and M. L. Steigerwald, Nature, 2006, 442, 904-907.
17. Y.-H. Wang, X.-Y. Zhou, Y.-Y. Sun, D. Han, J.-F. Zheng, Z.-J. Niu and X.-S. Zhou, Electrochimica Acta, 2014, 123, 205-210.
19
Zhou and B. W. Mao, J. Phys. Chem. C, 2012, 116, 21699-21705.
19. Y. H. Wang, D. F. Li, Z. W. Hong, J. H. Liang, D. Han, J. F. Zheng, Z. J. Niu, B. W. Mao and X. S. Zhou, Electrochemistry Communications, 2014, 45, 83-86.
20. F. Chen, Z. F. Huang and N. J. Tao, Applied Physics Letters, 2007, 91, 162106. 21. A. Vezzoli, R. J. Brooke, N. Ferri, S. J. Higgins, W. Schwarzacher and R. J.
Nichols, Nano Lett., 2017, 17, 1109-1115.
22. A. C. Aragones, N. Darwish, S. Ciampi, F. Sanz, J. J. Gooding and I. Diez-Perez, Nature Communications, 2017, 8, 15056.
23. R. M. Metzger, Chem Rev, 2015, 115, 5056-5115.
24. R. M. Metzger, B. Chen, U. Hopfner, M. V. Lakshmikantham, D. Vuillaume, T. Kawai, X. L. Wu, H. Tachibana, T. V. Hughes, H. Sakurai, J. W. Baldwin, C. Hosch, M. P. Cava, L. Brehmer and G. J. Ashwell, J. Am. Chem. Soc., 1997, 119, 10455-10466.
25. E. Lortscher, Chemphyschem, 2011, 12, 2887-2889.
26. S. Martin, D. Z. Manrique, V. M. Garcia-Suarez, W. Haiss, S. J. Higgins, C. J. Lambert and R. J. Nichols, Nanotechnology, 2009, 20, 125203.
27. K. Wang, J. Zhou, J. M. Hamill and B. Xu, J Chem Phys, 2014, 141, 054712. 28. I. Diez-Perez, J. Hihath, Y. Lee, L. P. Yu, L. Adamska, M. A. Kozhushner, I.
I. Oleynik and N. J. Tao, Nature Chemistry, 2009, 1, 635-641. 29. T. Tamaki and T. Ogawa, Topics Curr Chem, 2017, 375.
30. Q. Zhang, L. Liu, S. Tao, C. Wang, C. Zhao, C. Gonzalez, Y. J. Dappe, R. J. Nichols and L. Yang, Nano Lett, 2016, 16, 6534-6540.
31. Q. Zhang, S. Tao, Y. Fan, C. Zhao, C. Zhao, W. Su, Y. J. Dappe, R. J. Nichols and L. Yang, The Journal of Physical Chemistry C, 2018, 122, 23200-23207. 32. Q. Zhang, S. Tao, R. Yi, C. He, C. Zhao, W. Su, A. Smogunov, Y. J. Dappe, R.
J. Nichols and L. Yang, J Phys Chem Lett, 2017, 8, 5987-5992.
33. L. Liu, Q. Zhang, S. Tao, C. Zhao, E. Almutib, Q. Al-Galiby, S. W. Bailey, I. Grace, C. J. Lambert, J. Du and L. Yang, Nanoscale, 2016, 8, 14507-14513. 34. B. Ren, G. Picardi and B. Pettinger, Review of Scientific Instruments, 2004,
75, 837-841.
35. T. A. Su, M. Neupane, M. L. Steigerwald, L. Venkataraman and C. Nuckolls, Nature Reviews Materials, 2016, 1, 16002.
36. C. H. He, Q. Zhang, S. H. Tao, C. Z. Zhao, C. Zhao, W. T. Su, Y. J. Dappe, R. J. Nichols and L. Yang, Phys. Chem. Chem. Phys., 2018, 20, 24553-24560. 37. S. Martin, W. Haiss, S. Higgins, P. Cea, M. C. Lopez and R. J. Nichols, J.
Phys. Chem. C, 2008, 112, 3941-3948.
38. L. L. Peng, B. Huang, Q. Zou, Z. W. Hong, J. F. Zheng, Y. Shao, Z. J. Niu, X. S. Zhou, H. J. Xie and W. Chen, Nanoscale Res Lett, 2018, 13, 121.
![[PDF] Tutoriel Arduino DS18B20 en pdf | Cours Arduino](data:image/gif;base64,R0lGODlhAQABAIAAAP///wAAACH5BAEAAAAALAAAAAABAAEAAAICRAEAOw==)