HAL Id: hal-00695753
https://hal.archives-ouvertes.fr/hal-00695753v2
Submitted on 4 Oct 2012
HAL is a multi-disciplinary open access
archive for the deposit and dissemination of
sci-entific research documents, whether they are
pub-lished or not. The documents may come from
teaching and research institutions in France or
abroad, or from public or private research centers.
L’archive ouverte pluridisciplinaire HAL, est
destinée au dépôt et à la diffusion de documents
scientifiques de niveau recherche, publiés ou non,
émanant des établissements d’enseignement et de
recherche français ou étrangers, des laboratoires
publics ou privés.
Modularity-Based Clustering for Network-Constrained
Trajectories
Mohamed Khalil El Mahrsi, Fabrice Rossi
To cite this version:
Mohamed Khalil El Mahrsi, Fabrice Rossi. Modularity-Based Clustering for Network-Constrained
Trajectories. 20-th European Symposium on Artificial Neural Networks, Computational Intelligence
and Machine Learning (ESANN 2012), Apr 2012, Bruges, Belgium. pp.471-476. �hal-00695753v2�
Modularity-Based Clustering for
Network-Constrained Trajectories
Mohamed K. El Mahrsi1 and Fabrice Rossi2
1- T´el´ecom ParisTech - D´epartement Informatique et R´eseaux 46, rue Barrault 75013 Paris - France
2- Universit´e Paris I - D´epartement SAMM 90, rue de Tolbiac 75634 Paris CEDEX 13 - France
Abstract. We present a novel clustering approach for moving object trajectories that are constrained by an underlying road network. The approach builds a similarity graph based on these trajectories then uses modularity-optimization hiearchical graph clustering to regroup trajecto-ries with similar profiles. Our experimental study shows the superiority of the proposed approach over classic hierarchical clustering and gives a brief insight to visualization of the clustering results.
1
Introduction
Traffic congestion has become a major problem affecting many human activities on a daily basis and resulting in both serious transportation delays and envi-ronmental damages. Continuously collecting information about the state of the road network (e.g. occupancy rates of the road segments) can be valuable for a better understanding of the traffic flow and a wiser planning and restructuring of the road network. Due to the high deployment and maintenance costs of dedicated traffic sensors, a more attractive approach to achieve this aim is to collect traces directly from GPS-equipped vehicles. The collected data can be map matched to corresponding road segments and can be used to deduce the state of the network in real time. It can also be stored and used later to conduct further, more complex data analysis tasks. .
The problem addressed throughout this article is how to discover clusters of network-constrained trajectories, i.e. how to group together trajectories that moved along the same parts of the road network. This post-analysis step is conducted on a considerable amount of collected data. It can lead to a better understanding of global movement patterns and tendencies that go unnoticed on the individual level as well as a better grasp of the reasons that lead to congestion situations.
Section 2 presents our formulation of the network-constrained moving object trajectories clustering problem. Our approach to solve this problem is presented in Section 3. Experimental results are exposed in Section 4 whereas related work is briefly discussed in Section 5. Finally, Section 6 concludes this paper.
2
Data Model and Problem Statement
A road network can be represented as a directed graph G = (V, E). V is the set of nodes (or vertices) representing the road intersections in the network whereas E is the set of edges denoting road segments that interconnect these intersections. The direction of a given edge e = (v1, v2) linking two vertices v1and v2indicates
that the corresponding road segment can be travelled from v1to v2and not the
other way around. A trajectory T traveling along this road network can be modeled as the ordered sequence of visited segments. If travel times are to be taken into account, each segment ei can be timestamped with the date ti the
trajectory T visited it: T = {(t1, e1), ..., (ti, ei), ..., (tn, en)} (n being the number
of segments contained in T ).
Given a dataset of trajectories T that travelled along a road network G, the network-constrained trajectory clustering problem consists in discovering sub-groups (or clusters) C = {C1, C2, ..., Cm} of trajectories exhibiting similar
behavior. Resemblance between trajectories of the same cluster Cishould be as
high as possible and trajectories across two different clusters Ci and Cj should
be as different as possible.
3
Clustering Approach
Our clustering approach proceeds in two steps. First, it calculates a similarity graph from T . Then, in the second step, the graph is used to conduct modularity-based graph clustering and regroup similar trajectories together.
3.1 Similarity between trajectories
We consider trajectories as bags-of-segments: comparisons between trajectories are done on a segment-basis (i.e. each segment is checked individually, without taking account of the order or the presence of other segments). This choice comes from the fact that: i. in a context of traffic analysis, congestion situations appear first on the level of individual, isolated segments then spread naturally among adjacent road segments. Inspecting each segment apart is, therefore, sufficient to detect these situations; and ii. even if the approach bag-of does not directly take into account the order of the segments, thanks to the fact that the underlying network is a directed graph the order of travel through the segments is implicitly respected.
To assess their relevance to each trajectory, we assign weights to road seg-ments based on their frequency in the data set in a TF-IDF (Term Frequency - Inverse Document Frequency) fashion: the spatial weight of a segment e in a trajectory T is defined, analogously to the TF-IDF weight, as follows:
ωe,T = length(e) P e′∈Tlength(e′) · log |T | |{T′: e ∈ T′}|
length(e) is the spatial length of the segment e, |T | is the cardinality of the dataset T and |{T′ : e ∈ T′}| the cardinality of the subset of trajectories
con-taining the segment e. The first term of the multiplication is the equivalent to the term frequency whereas the second is the equivalent to the inverse document frequency.
To compare two trajectories Ti and Tj we calculate their cosine similarity:
Similarity(Ti, Tj) =
P
e∈Eωe,Ti· ωe,Tj
q P e∈Eωe,T2 i· q P e∈Eωe,T2 j
This weighting and similarity calculation approach takes only the spatial dimension into consideration. The reason is that, for traffic monitoring and optimization purposes, decision making might involve rerouting traffic from a portion of the network to another. Thus affecting all trajectories that passed by the concerned zone whether they travelled together or at different dates. 3.2 Clustering Algorithm
As mentioned before, the first step of our clustering algorithm consists in con-structing a weighted, undirected similarity graph GSim = (T , E′, W). Each
trajectory from the dataset T corresponds to a node in GSim. An edge e ∈ E′
links two trajectories Tiand Tjif and only if Similarity(Ti, Tj) > 0 in which case
the similarity is assigned as a weight (ωe∈ W ) to the edge. The choice of graph
representation is not only natural but it also puts extra emphasis on the fact that two trajectories that have nothing in common should never be put directly into the same cluster (since no edge provides a direct link between the two).
Since we are interested in analyzing an important number of trajectories and since an edge links two trajectories together if they share at least one road seg-ment in common, GSim tends to be very large and its vertices have generally high degrees. For these reasons, modularity-based community detection algorithms are efficient for clustering such graphs [1]. Modularity measures the classifica-tion quality by inspecting the arrangement of edges within clusters (commonly called communities) of vertices. A high modularity indicates that the edges within communities are more numbered (or have more important weights) than in the case of randomly distributed edges.
We opted for an implementation of the modularity-based hierarchical graph clustering algorithm proposed in [2] for our clustering step. The algorithm per-forms modularity optimization on the nodes of the similarity graph and the structure of the discovered communities is validated by means of comparison against random graphs generated with the same set of nodes. If validated, the communities are retained and the algorithm proceeds recursively on each iso-lated community (i.e. considering only the sub-graph including the nodes of the community). The final result is a hierarchy of nested clusters that can either be explored level by level or using a greedy approach that expands, at each given step, the cluster that induces the minimal loss of modularity.
4
Experimental Results
For our experimental study, we used a synthetic dataset1 of 10000
trajecto-ries generated with the Brinkhoff generator [3] using the Oldenburg map which contains 6105 nodes and 7035 undirected edges that can be travelled in both directions.
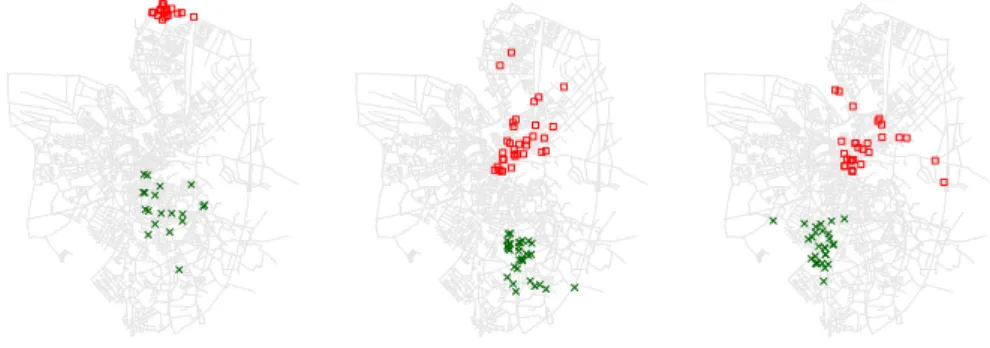
We started by comparing different similarity calculation approaches: we com-pared our cosine similarity using spatial weighting (cf. Section 3.1) with the Jaccard index and cosine similarity with classic TD-IDF weighting. The clus-tering step achieved the highest modularity optimization with spatial weighting (0.5635 vs 0.5251 for Jaccard index and only 0.4861 for classic TF-IDF). The algorithm produced a hierarchy of clusters that spans on 6 levels with 9 clusters on the top level and 648 clusters in the lowest level. Figure 1 shows examples of clusters produced by our algorithm on the third level of the clustering hierarchy (we chose to expand level by level since this approach seemed to give the most balanced clusters for this dataset). Each sub-figure shows the distribution of departure and arrival points of the trajectories, in a given cluster, that moved along the most visited road segment.
Fig. 1: Departures points (crosses) and arrival points (empty squares) of some clusters that travelled along the most occupied road segment.
Visualization of the generated clusters shows promising results as of the capa-bility of the clustering approach to divide trajectories into well separated groups. Moreover, the fact that the algorithm produces a hierarchy of nested clusters can be very useful for the understanding and visualization of traffic: one can start with a given level and locate interesting clusters (e.g. clusters that crossed a given area of interest) and see how these clusters are expanded into sub-clusters on lower levels.
We also compared our clustering approach to classic hierarchical agglomer-ative clustering. To this end, we used a distance that is complementary to our similarity measure: distance(T1, T2) = 1 − Similarity(T1, T2). We calculated an adjacency matrix based on this distance and we used it for the agglomerative
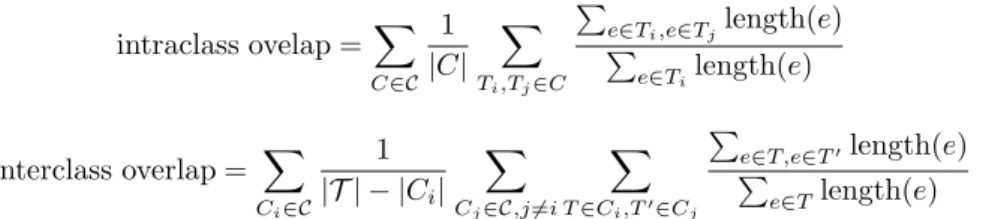
clustering (with single, average and full linkage). Comparisons were conducted for the same number of cluster: for each of the 6 hierarchy levels produced in our approach, we cut the hierarchical clustering at the same number of clusters and we compared the two. Quality measures that we used are: i. interclass and intr-aclass inertia of the start points of the trajectories; ii. interclass and intrintr-aclass inertia of the end points of the trajectories; and 3. interclass and intraclass over-lap of the trajectories. The first two are used to assess the compactness of the regrouped trajectories start/end points . Overlap measures give an appreciation of how much road segments trajectories share among and across the resulting clusters (C being the set of resulting clusters, and |C| the number of trajectories in the cluster C): intraclass ovelap =X C∈C 1 |C| X Ti,Tj∈C P
e∈Ti,e∈Tjlength(e)
P e∈Tilength(e) interclass overlap = X Ci∈C 1 |T | − |Ci| X Cj∈C,j6=i X T∈Ci,T′∈Cj P e∈T,e∈T′length(e) P e∈Tlength(e)
Due to lack of space, we only show the results of our interclass and intraclass overlap comparison (Table 1). Modularity-optimization clustering achieves the best intraclass overlap among the tested approaches. This indicates that tra-jectories within a same cluster are more similar and share more road segments than in the case of classic hierarchical clustering. The lower (at first glance bet-ter) interclass overlap achieved by single linkage hierarchical clustering comes from the fact that this approach produces very unbalanced clusters (it tends to produce a huge cluster regrouping most of the trajectories in the dataset while the other clusters are very small). This problem is also visible with average and full linkage hierarchical clustering but only when the number of clusters is small. When the number of clusters gets bigger, average and full linkage as well as modularity-optimization clustering all behave in a similar manner w.r.t. interclass overlap.
Nbr. of Intraclass overlap Interclass overlap
clusters HC(S) HC(A) HC(F) Mod. HC(S) HC(A) HC(F) Mod.
9 111 111 123 608 0.5 0.2 38.9 42.8 45 149 155 349 1768 5.1 2.9 78.4 62.2 159 270 1594 1877 3121 8.8 59.1 97.9 79.4 419 569 3073 3682 4264 22.4 69.5 87.1 87.9 621 822 3999 4419 4780 30.3 76.2 85.8 89.7 648 881 4106 4491 4823 35.4 76.5 85.8 89.8
Table 1: Interclass and intraclass overlaps achieved by modularity-optimization trajectory clustering and hierarchical agglomerative clustering (with S: single linkage, A: average linkage and F: full linkage).
5
Related Work
Clustering trajectory data attracted many research in the last few years. Ex-isting proposals include TraClus [4], convoy [5] and flock [6] patterns and many others. These are mainly density-based approaches that suppose that the mov-ing objects can move freely on an euclidean space. Therefore, these approaches are substantially different from the problem at hand where the movement is con-strained. The case of constrained trajectories started to attract attention only recently. In [7], the authors propose a density-based approach to discover dense paths in such trajectories. Like all density-based method, the approach is very sensitive to the configuration of the minP ts and ǫ parameters. Furthermore, the approach clusters sub-trajectories together and does not conserve trajectory participation on the whole dense path (i.e. a trajectory might participate only partially in the path). Our approach, on the contrary, regroups whole trajecto-ries. To our knowledge, our work is the first to apply modularity-optimization graph clustering in the context of trajectory data.
6
Conclusion
In this article, we presented a novel approach to cluster trajectories constrained by an underlying road network. The approach starts by computing a similarity graph between trajectories based on the cosine spatial similarity that we de-fined. The graph is then used to conduct hierarchical modularity-optimization clustering to discover communities of trajectories that exhibited similar behav-ior. Results on synthetic trajectory data are promising and showed that the proposed approach yields better, more relevant clusters than the classic hierar-chical clustering. For future research directions, we are mainly interested in the visual exploitation of the clustering results as well as the study of their relevance in decision making in a context of traffic rerouting and optimization.
References
[1] Santo Fortunato. Community detection in graphs. Physics Reports, 486(3-5):75–174, 2010. [2] Andreas Noack and Randolf Rotta. Multi-level algorithms for modularity clustering. In Proceedings of the 8th International Symposium on Experimental Algorithms, SEA ’09, pages 257–268, Berlin, Heidelberg, 2009. Springer-Verlag.
[3] Thomas Brinkhoff. A framework for generating network-based moving objects. Geoinfor-matica, 6:153–180, June 2002.
[4] Jae-Gil Lee, Jiawei Han, and Kyu-Young Whang. Trajectory clustering: a partition-and-group framework. In SIGMOD ’07: Proceedings of the 2007 ACM SIGMOD international conference on Management of data, pages 593–604, New York, NY, USA, 2007. ACM. [5] Hoyoung Jeung, Man Lung Yiu, Xiaofang Zhou, Christian S. Jensen, and Heng Tao Shen.
Discovery of convoys in trajectory databases. Proc. VLDB Endow., 1(1):1068–1080, 2008.
[6] Marc Benkert, Joachim Gudmundsson, Florian H¨ubner, and Thomas Wolle. Reporting
flock patterns. Comput. Geom. Theory Appl., 41(3):111–125, 2008.
[7] Ahmed Kharrat, Iulian Sandu Popa, Karine Zeitouni, and Sami Faiz. Clustering algorithm for network constraint trajectories. In Anne Ruas and Christopher M. Gold, editors, SDH, Lecture Notes in Geoinformation and Cartography, pages 631–647. Springer, 2008.