HAL Id: hal-00303834
https://hal.archives-ouvertes.fr/hal-00303834
Submitted on 2 Feb 2006HAL is a multi-disciplinary open access
archive for the deposit and dissemination of sci-entific research documents, whether they are pub-lished or not. The documents may come from teaching and research institutions in France or abroad, or from public or private research centers.
L’archive ouverte pluridisciplinaire HAL, est destinée au dépôt et à la diffusion de documents scientifiques de niveau recherche, publiés ou non, émanant des établissements d’enseignement et de recherche français ou étrangers, des laboratoires publics ou privés.
A chemical probe technique for the determination of
reactive halogen species in aqueous solution: Part 2 ?
chloride solutions and mixed bromide/chloride solutions
C. Anastasio, B. M. Matthew
To cite this version:
C. Anastasio, B. M. Matthew. A chemical probe technique for the determination of reactive halogen species in aqueous solution: Part 2 ? chloride solutions and mixed bromide/chloride solutions. At-mospheric Chemistry and Physics Discussions, European Geosciences Union, 2006, 6 (1), pp.941-979. �hal-00303834�
ACPD
6, 941–979, 2006 Technique for measuring aqueous reactive halogens: Part 2 C. Anastasio and B. M. Matthew Title Page Abstract Introduction Conclusions References Tables Figures J I J I Back CloseFull Screen / Esc
Print Version Interactive Discussion
Atmos. Chem. Phys. Discuss., 6, 941–979, 2006 www.atmos-chem-phys.org/acpd/6/941/
SRef-ID: 1680-7375/acpd/2006-6-941 European Geosciences Union
Atmospheric Chemistry and Physics Discussions
A chemical probe technique for the
determination of reactive halogen species
in aqueous solution: Part 2 – chloride
solutions and mixed bromide/chloride
solutions
C. Anastasio1and B. M. Matthew1,*
1
Atmospheric Science Program, Department of Land, Air & Water Resources, University of California, Davis, USA
*
now at: Hach Company, Loveland, Colorado, USA
Received: 16 November 2005 – Accepted: 7 December 2005 – Published: 2 February 2006 Correspondence to: C. Anastasio (canastasio@ucdavis.edu)
© 2006 Author(s). This work is licensed under a Creative Commons License.
ACPD
6, 941–979, 2006 Technique for measuring aqueous reactive halogens: Part 2 C. Anastasio and B. M. Matthew Title Page Abstract Introduction Conclusions References Tables Figures J I J I Back CloseFull Screen / Esc
Print Version Interactive Discussion
Abstract
Although reactive halogen species (X*=X•, •X−2, X2 and HOX, where X=Br, Cl, or I) are important environmental oxidants, relatively little is known about their kinetics in condensed phases such as seawater and sea-salt particles. Here we describe a new technique to determine reactive chlorine and bromine species in aqueous solutions by
5
using allyl alcohol (CH2=CHCH2OH) as a chemical probe. This probe is combined with competition kinetics in order to determine steady state concentrations of X*(aq). In some cases the technique also can be used to determine the rates of formation and lifetimes of X* in aqueous solution. In a companion paper we reported the results of our method development for aqueous solutions containing only bromide (Br−). In this
10
paper, we discuss method development for solutions containing chloride (Cl−) alone, and for solutions containing both bromide and chloride.
1. Introduction
As discussed in detail in the companion paper to this work (Matthew and Anastasio, 2006, hereafter referred to as “Part 1”), aqueous and gaseous reactive halogen species
15
(X*=X•,•X−2, XO•, X2and HOX, where X=Br, Cl, or I) play important roles in the istry of marine regions. To further our understanding of aqueous-phase halide chem-istry, and its links to the release of reactive gas-phase halogens, we have developed a chemical probe technique to detect and measure reactive halogen species in aque-ous solutions. In this technique we use allyl alcohol (AA) to trap the reactive halogens
20
(Cl*(aq) and Br*(aq)) and form stable, halogenated diols (3-chloropropanediol (3CPD) and 3-bromopropanediol (3BPD)) that are quantified.
In chloride solutions the formation of Cl*(aq) by •OH occurs through reactions that are analogous to those in bromide solutions (see Part 1):
Cl−+•OH →•ClOH− (94)
ACPD
6, 941–979, 2006 Technique for measuring aqueous reactive halogens: Part 2 C. Anastasio and B. M. Matthew Title Page Abstract Introduction Conclusions References Tables Figures J I J I Back CloseFull Screen / Esc
Print Version Interactive Discussion •ClOH−+ Cl−→•Cl− 2 + OH − (95) •ClOH−+ H+ → Cl•+ H 2O (97)
While Cl•,•Cl−2, and a number of other Cl* species can form 3CPD in chloride solutions, under our conditions•Cl−2 is the dominant source. In solutions containing both chloride and bromide,•Cl−2 is a less important source of 3CPD and the mixed halogen species
5
•
BrCl− becomes the dominant source. •BrCl−, and the molecular mixed halogen BrCl, are also significant sources of 3BPD in mixed halide solutions. These species are formed from a number of reactions, including interactions such as
•Cl−
2+ Br
− →•BrCl−+ Cl− (173)
Cl−+ HOBr + H+ → BrCl+ H2O (155)
10
(Note that these reactions are from the supplementary material (Sects. S.1–S.12, Re-actions 1–192, Eqs. S1–S41, and Tables S1–S6) that was introduced in Part 1. To avoid duplication, and because this paper refers to many of the equations from Part 1, we have also made the equation numbering continuous between Part 1 (Eqs. 1–10) and this paper (Eqs. 11–19).)
15
In Part 1 we described the overall chemical probe technique, its use with competition kinetics, and its application to solutions containing bromide. In this paper we apply the technique to chloride solutions and to “mixed halide” solutions, i.e., those containing both bromide and chloride. As in Part 1, our first step here is to perform a series of experiments under different conditions in order to build and test a kinetic model of
20
reactive halogen chemistry. The second step is to use this kinetic model to evaluate the overall chemical probe technique, and a series of three data treatments, under a range of experimental conditions.
ACPD
6, 941–979, 2006 Technique for measuring aqueous reactive halogens: Part 2 C. Anastasio and B. M. Matthew Title Page Abstract Introduction Conclusions References Tables Figures J I J I Back CloseFull Screen / Esc
Print Version Interactive Discussion
2. Experimental
The key general aspects to the chemical probe technique are discussed in detail in Part 1. In the following sections, we give a brief overview of the technique and a more detailed description of the models and procedures that are specific to using the method in solutions containing either Cl− or both Cl−and Br−.
5
2.1. Overview of experimental parameters
The reagents (including Milli-Q water) used in this work are the same as described in Part 1 with the exception of NaCl. In many of our experiments with chloride solutions the results can be affected by trace levels of Br−. Because we could find no source of NaCl that was bromide-free, we developed a technique to remove the small amounts of
10
bromide present in chloride solutions (Sect. S.7). Using this technique with high purity NaCl (Sigma Aldrich; 99.999%) we reduced Br−levels from ∼0.007% mol Br/mol Cl (in untreated chloride) to <0.0002% mol Br/mol Cl, a level that did not significantly affect our experimental results.
During experiments aqueous samples (∼23 mL) containing halide, allyl alcohol (AA),
15
and 1.0 mM hydrogen peroxide (as a photochemical source of•OH) were illuminated (313 nm light) in airtight, stirred, 5 cm quartz cells maintained at 20◦C. Aliquots of sample were removed at specified times and analyzed for 3XPD (i.e., 3-chloro-1,2-propanediol (3CPD), and/or 3-bromo-1,2-3-chloro-1,2-propanediol (3BPD)) and AA using tech-niques discussed in Part 1. When required, sample pH was adjusted using 1.0 M
20
H2SO4or a mixture of 1.0 mM sodium tetraborate and 0.30 M NaOH. For each experi-ment the actinic flux was measured using 2-nitrobenzaldehyde actinometry (Anastasio et al., 1994). Dark controls were treated the same as illuminated samples except that they were prepared in 1 cm quartz cells, placed in a dark cell chamber (20◦C, stirred), and sampled at the final illumination time point. There was no loss of AA, and no
for-25
mation of 3BPD or 3CPD, in illuminated samples that did not contain H2O2, regardless of whether bromide and/or chloride were present. In addition, illumination of solutions
ACPD
6, 941–979, 2006 Technique for measuring aqueous reactive halogens: Part 2 C. Anastasio and B. M. Matthew Title Page Abstract Introduction Conclusions References Tables Figures J I J I Back CloseFull Screen / Esc
Print Version Interactive Discussion
containing 1.0 mM H2O2, 0.80 mM Br−, 3BPD and/or 3CPD lead to no loss of 3XPD over the time scales of our experiments.
2.2. Kinetic models
Halide chemistry in the illuminated solutions was modeled with Acuchem (Braun et al., 1988). In Part 1, we developed a kinetic model (Br− Full Model) that describes
aque-5
ous bromide chemistry. Here we extend this model to include chloride and mixed halide (i.e., bromide and chloride) reactions. The model written for the chloride system (Cl− Full Model) consists of the reactions from Table S1, the reactions of •OH and •CO−3 with allyl alcohol (Table S3), aqueous chloride reactions (Table S4), and interactions of reactive chloride species (Cl*(aq)) with AA (Table S5). The chemistry occurring in
10
the mixed halide solutions is described in the “Mix Full Model”. This model consists of the “Br− Full Model” (Tables S1–S3), aqueous chloride reactions (Table S4), reac-tions of AA with Cl*(aq) and with mixed halogen species (BrCl* (aq)=•BrCl− and BrCl) (Table S5), and mixed halide reactions (Table S6).
Obtaining quantitative information (i.e., rates of formation (RFi), steady-state
con-15
centrations ([i ]), and lifetimes (τi)) for reactive halogen species i requires knowing the yields of 3BPD and 3CPD formed from the reactions of i with AA (Yi3XPD). These yields were calculated as described in Sect. 2.2.3 of Part 1, and are based on the modeled rate constants for the reactions of species i with AA (Tables S3 and S5). In our chloride experiments, dichloride radical anion (•Cl−2) is responsible for most of 3CPD formation,
20
while Cl• contributes only very little (typically <4%). Based on the modeled rate con-stants, yields of 3CPD from the reactions of•Cl−2 and Cl•with AA are 0.095 and ∼0.2, respectively.
In mixed halide solutions 3CPD can also be formed from the reaction of AA with
•
BrCl− or BrCl, with yields of 0.0031 and ∼5×10⁻⁵, respectively (Table S5). In addition
25
to Br•, Br2, and HOBr (Part 1), 3BPD can also be formed by both BrCl and •BrCl− in mixed halide solutions. Based on modeled rate constants, the yield of 3BPD from
ACPD
6, 941–979, 2006 Technique for measuring aqueous reactive halogens: Part 2 C. Anastasio and B. M. Matthew Title Page Abstract Introduction Conclusions References Tables Figures J I J I Back CloseFull Screen / Esc
Print Version Interactive Discussion
the reaction of BrCl with AA is 0.50 (Table S5). The yield from •BrCl− is pH depen-dent: 0.078 at pH≤5.5, 0 at pH≥6.5, and varying linearly between these values. We could find no rate constants for the reactions of Cl2 or BrCl with AA (Reactions 147– 149, Table S5) or other alkenes in water. Fitting the kinetic model to the experimental data produced a total rate constant of BrCl with allyl alcohol of 1.0×10⁸M−1s−1
(Reac-5
tions 147–149) and a 3BPD yield of 0.50. Based on this we estimate that the total rate constant for the reaction of Cl2 with AA is 1.1×10⁸M−1s−1 (Reactions 138 and 139, Table S5), but this value is not well constrained by our results.
2.3. Competition kinetics
There are two aspects that complicate our allyl alcohol chemical probe technique
com-10
pared to past techniques: i) the addition of the probe compound (AA) causes a de-crease in the rate of X*(aq) formation because the AA scavenges •OH, and ii) the compounds formed from the reaction of X*(aq) with allyl alcohol are not specific to an individual species (i.e., 3BPD and 3CPD are each formed by several different species). These complications require that the raw data be corrected to compensate for these
15
effects. In Part 1, the effects associated with i) and ii) were referred to as the “AA effect” and the “Fi3BPD effect”, respectively. Here we refer to the latter effect as the “Fi3XPD effect”, where Fi3XPD is the fraction of total 3BPD or 3CPD that is formed from the reaction of species i with AA.
The dynamics of the reactive halogen species are determined from competition
ki-20
netics experiments where product formation rates (3BPD and 3CPD) are measured as a function of allyl alcohol concentration. From these experiments we calculate steady-state concentrations and other parameters for X*(aq) using data from “inverse plots”, i.e., plots of the inverse of the rate of 3XPD formation (1/RF3XPD) versus 1/[AA]. Recall from Part 1 that there are two general approaches to calculate [i ], RFi, and τi from the
25
inverse plots. The first approach is only applicable for Br• in solutions containing only bromide (see Sect. 3.6.1 of Part 1) and cannot be used here.
ACPD
6, 941–979, 2006 Technique for measuring aqueous reactive halogens: Part 2 C. Anastasio and B. M. Matthew Title Page Abstract Introduction Conclusions References Tables Figures J I J I Back CloseFull Screen / Esc
Print Version Interactive Discussion
In the second, more general, approach we assume that AA has only a minor effect upon •OH (and, therefore, upon X*(aq) formation) in the linear portion of the inverse plot (where [AA] is small and the “AA effect” is minimized). By making this assumption, the kinetic derivations are simplified and can be applied to the other X*(aq) species. In this case, Eq. (S13) can be rewritten for all X*(aq) species as:
5 1 RF ,tot3XPD = a 0+ b 0 [AA] (11)
where RF ,tot3XPD is the total rate of formation of 3BPD or 3CPD and a0 and b0 are, re-spectively, the y-intercept and slope of the linear portion of the inverse plot. Using a procedure analogous to that described for Br*(aq) in Part 1, we can derive general expressions for a0and b0:
10 a0= F 3XPD i Yi3XPDRFi (12) b0= F 3XPD i Yi3XPDkiAA[i ] (13)
where Yi3XPD is the yield of 3XPD from the reaction of species i with AA (Sect. 2.2),
RFiand [i ] are the rate of formation and concentration of species i , respectively, and
Fi3XPD is the fraction of 3XPD formed from species i (Sect. S.12). (Note that these
15
equations are the more general analogs of Eqs. S25–S27 derived in Part 1.) In the mixed halide system we calculate Fi3CPD based on •Cl−2, Cl•, Cl2, HOCl, BrCl, and
•
BrCl−, while for Fi3BPD we include Br•, •Br−2, Br2, HOBr, BrCl, and •BrCl−. Other species (e.g., Br−3 and Cl−3) are insignificant sources of 3BPD or 3CPD in our experi-ments but could be important under other conditions.
20
ACPD
6, 941–979, 2006 Technique for measuring aqueous reactive halogens: Part 2 C. Anastasio and B. M. Matthew Title Page Abstract Introduction Conclusions References Tables Figures J I J I Back CloseFull Screen / Esc
Print Version Interactive Discussion
Equations (12) and (13) can be rearranged to solve for [i ], RFi , and the lifetime of i (τi): [i ]= F 3XPD i b0Yi3XPDkiAA (14) RFi = F 3XPD i a0Yi3XPD (15) τi = a 0 b0 kiAA = [i ] RFi (16) 5
As in the bromide system in Part 1 (Sect. 2.3), assuming that the AA effect is small in the linear region of the inverse plot can lead to errors in [i ], RFi and τi in the chloride and mixed halide systems, but we can generally correct for these biases using the kinetic model.
3. Results and discussion
10
3.1. Overview of experimental approach
Our first goal is to use our experimental results to construct a numerical model that describes the chemistry occurring in illuminated mixed halide solutions. We start by characterizing the rates of 3CPD formation (RF , tot3CPD) and allyl alcohol loss (RLAA) in so-lutions containing only chloride (Sect. 3.2) to make a model of chloride chemistry (Cl−
15
Full Model). This model is then combined with the Br− Full Model (Part 1), and a series of mixed halide reactions, to make the “Mix Full Model”, which describes the chemistry in mixed halide solutions. This final model is tested and constrained using
ACPD
6, 941–979, 2006 Technique for measuring aqueous reactive halogens: Part 2 C. Anastasio and B. M. Matthew Title Page Abstract Introduction Conclusions References Tables Figures J I J I Back CloseFull Screen / Esc
Print Version Interactive Discussion
several different sets of experiments under various solution conditions (Sect. 3.3) and is then used to evaluate the kinetic equations for [i ], RFi , and τi using model-derived data (Sect. 3.5). Finally, we test the ability of the probe technique to experimentally de-termine reactive halogen kinetics in solutions containing both Br−and Cl−(Sect. 3.6). 3.2. Chloride experiments
5
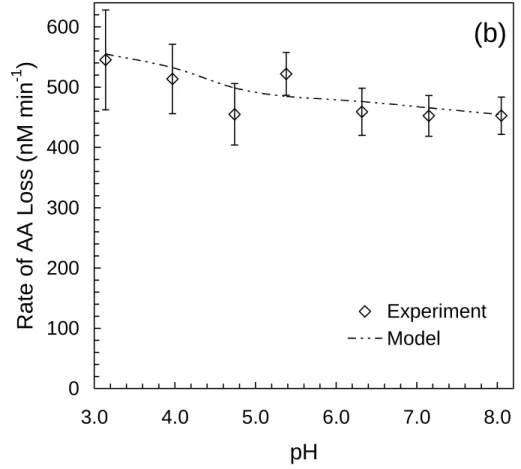
3.2.1. Rates of formation of 3CPD (RF ,tot3CPD) and loss of AA (RLAA) as a function of pH All solutions contained 1.0 mM H2O2, 75 µM AA, and seawater concentrations of chlo-ride (0.56 M NaCl, from NaCl that was treated to remove Br−; Sect. S.7). As shown in Fig. 1a, the experimental values of RF ,tot3CPD exhibit a strong dependence on pH, rising quickly at pH<5.5 as a result of the acid-dependent formation of Cl• (Reaction 97).
10
Measured values of RLAA(Fig. 1b) show a much weaker dependence on pH, increasing only slightly with decreasing pH. Also shown in Figs. 1a and 1b are results from the Cl− Full Model, which closely predicts both RF ,tot3CPDand RLAA as a function of pH. Based on model results the dichloride radical anion (•Cl−2) is responsible for ≥99% of the 3CPD formed at all pH values in these experiments, while other chlorinating species (Cl2,
15
HOCl, and Cl•) are insignificant.
3.2.2. Rates of formation of 3CPD (RF ,tot3CPD) and loss of AA (RLAA) as a function of [AA] Experiments were conducted as outlined in Sect. 3.2.1 except in this case the pH was held constant at 5.4 and [AA] was varied from 2–75 µM (Table 1). As shown in Figs. 2a and b, the Cl− Full Model does a good job of predicting both RF ,tot3CPD and RLAA, with
av-20
erage relative percent differences (RPD) between the model and experimental values of 7.5 and 22% for RF ,tot3CPD and RLAA, respectively (Table 1). As expected, RF ,tot3CPD de-creases at higher [AA] where allyl alcohol becomes the dominant sink for•OH, thereby decreasing chloride oxidation and Cl*(aq) formation (Fig. 2a). It is interesting to note that the decrease in 3CPD formation in the chloride solution occurs at much lower
25
ACPD
6, 941–979, 2006 Technique for measuring aqueous reactive halogens: Part 2 C. Anastasio and B. M. Matthew Title Page Abstract Introduction Conclusions References Tables Figures J I J I Back CloseFull Screen / Esc
Print Version Interactive Discussion
[AA] than does the decrease in 3BPD formation in the bromide system (∼15 µM versus ∼300 µM). This is because Cl− is less efficient at scavenging •OH than is Br− at pH 5.5 and so less AA is required to outcompete Cl−. Based on model results, •Cl−2 is responsible for 95–100% of the 3CPD formed between 2 and 75 µM AA, while Cl• is responsible for ≤5%.
5
3.2.3. Measurements of gaseous reactive chlorine (Cl*(g))
As was the case for the bromide system, we also conducted an experiment to measure the production and release of Cl*(g) (i.e., Cl2and HOCl) from an air-purged, illuminated solution (pH 3.9) containing 3.5 M NaCl and 0.10 M NaNO3(as a photochemical source of•OH), but no allyl alcohol. The experiment was conducted as described in Matthew
10
et al. (2003) except that nitrate was used instead of H2O2as a source of•OH and gases were collected in a bubbler containing 10 mL of 0.50 M Na2SO3 and 34.0 mM Na2CO3 instead of a carbonate-coated denuder. The low apparent rate of Cl*(g) collection in the experiment (8.8 nmol h−1) is less than the equivalent average rate from a series of blanks (16±22 nmol h−1). While the blank value is high, it appears that no significant
15
amounts of Cl*(g) were produced in the bubbling experiment, which is consistent with our model results (<4×10⁻⁴nmol Cl*(g) h−1 at any pH value between 3 and 8).
3.3. Mixed halide experiments
The experiments in the following sections were designed to constrain our mixed halide model (i.e., the Mix Full Model). This model consists of the validated Br− and Cl− Full
20
Models along with a number of mixed halide reactions (154–192, Table S6). One im-portant effect of these reactions is to convert radical chloride species (•ClOH−, •Cl−2 and Cl•) into•BrCl− (e.g., Reactions 171–173). The existence of•BrCl−has only been quantified recently (Donati, 2002; Ershov, 2004) and our experimental evidence indi-cates that it is an important species in mixed halide systems in the presence of•OH
25
ACPD
6, 941–979, 2006 Technique for measuring aqueous reactive halogens: Part 2 C. Anastasio and B. M. Matthew Title Page Abstract Introduction Conclusions References Tables Figures J I J I Back CloseFull Screen / Esc
Print Version Interactive Discussion
3.3.1. Measurements of RF ,tot3BPD, RF ,tot3CPDand RLAAas a function of [Br−]
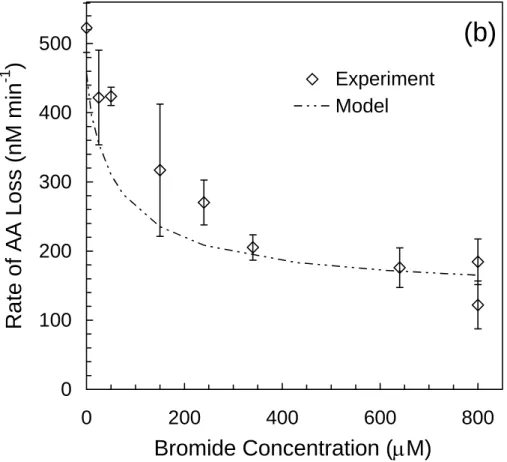
Experiments were conducted at pH 5.4 with solutions containing 0.56 M NaCl (from purified NaCl; Sect. S.7), 1.0 mM H2O2, 75 µM AA, and 0–800 µM NaBr. As shown in Fig. 3a, RF ,tot3BPD rises quickly between 0 and ∼150 µM Br− but rises only gradually at higher bromide concentrations. In contrast, RF ,tot3CPD decreases with increasing [Br−].
5
Values for RLAA (Fig. 3b) decrease with increasing [Br−] because the bromide scav-enges•OH, resulting in decreased destruction of AA by•OH. Model results for RF ,tot3BPD and RF ,tot3CPDshow that the Mix Full Model generally does a good job of predicting these two quantities, although it underpredicts 3CPD at low bromide concentrations (Fig. 3a). In addition, the model does a good job of predicting RLAA at [Br−]≥300 µM, but
under-10
estimates AA loss at lower [Br−] (Fig. 3b).
Based on model results, in these experiments •BrCl− and Br• are responsible for ∼74% and ∼23% of the 3BPD formed, respectively, at all bromide concentrations.•Cl−2 and •BrCl− are primarily responsible for 3CPD formation and their contributions vary significantly with [Br−]. For example, at 10 µM Br−,•Cl−2 and•BrCl− are responsible for
15
88% and 12%, respectively, of 3CPD, while at 800 µM Br−approximately 95% of 3CPD is from•BrCl−.
3.3.2. Measurements of RF ,tot3BPD, RF ,tot3CPDand RLAAas a function of pH
Experiments were conducted on solutions containing 0.80 mM NaBr, 0.56 M NaCl (un-treated), 1.0 mM H2O2, and 75 µM AA. As shown in Fig. 4a, the model does a good job
20
of explaining the RF ,tot3BPD measurements. The drop in RF ,tot3BPD between pH 5.5 and 6.5 is due to the decrease in the yield of 3BPD from the reaction of•BrCl− with AA (YBrCl3BPD− )
(Sect. 2.2). While the model somewhat overpredicts RF ,tot3CPDand RLAA, model values are always within the measurement error limits (Figs. 4b–c).
Under these experimental conditions 3BPD is formed primarily from•BrCl−, Br•and
25
ACPD
6, 941–979, 2006 Technique for measuring aqueous reactive halogens: Part 2 C. Anastasio and B. M. Matthew Title Page Abstract Introduction Conclusions References Tables Figures J I J I Back CloseFull Screen / Esc
Print Version Interactive Discussion
BrCl, with their relative contributions changing as a function of pH. Unlike the case in bromide solutions, where Br2 is the dominant precursor for 3BPD at pH 3.0 (see Part 1), in the mixed halide solutions BrCl is the most important source of 3BPD at low pH. For example, at pH 3.0, BrCl, •BrCl−, and Br• account for 61, 23 and 11%, respectively, of 3BPD. At pH 5.5, these contributions change to approximately 8, 67,
5
and 18%, respectively, while at pH≥6.5, Br• accounts for ≥95% of the 3BPD formed. The primary species responsible for 3CPD formation is •BrCl− although •Cl−2 is also significant at low pH. For example, at pH 3 these species account for ∼83 and ∼10% of 3CPD, respectively, while at pH≥5.5•BrCl−forms ≥94% of 3CPD. Note that all of these values are for solutions with 75 µM allyl alcohol and that the contributions depend on
10
[AA].
3.3.3. Measurements of RF ,tot3BPD, RF ,tot3CPDand RLAAas a function of [AA]
Experiments were conducted as in Sect. 3.3.2, except that the concentration of allyl alcohol was varied in solutions of pH 3.0, 5.5, and 8.0 (Experiments 2–4 in Table 1). In addition to further testing the Mix Full Model, these experiments represent the
compe-15
tition kinetics experiments for the mixed halide system (Sect. 3.6). Experimental values for RF ,tot3BPDand RF ,tot3CPDat pH 3.0 (Experiment 2, Table 1) are shown in Fig. 5a along with the corresponding model results. While measured rates of 3BPD formation are 30–600 times greater than rates of 3CPD formation at this pH, the model does a good job of matching both of these rates: average absolute RPD values between the model and
20
experiment are 10% and 15% for RF ,tot3BPD and RF ,tot3CPD, respectively. The Mix Full Model also does a reasonable job of matching experimental values of RLAA(Fig. 5b), with an average RPD between the model and experimental values of 19%.
As seen in Table 1, the Mix Full Model also does a good job of matching the experi-mental data at pH 5.5: the average RPDs between modeled and measured values for
25
RF ,tot3BPD, RF ,tot3CPD and RLAA are 25, 18, and 13%, respectively. In the pH 8.0 experiment, where the overall reactivity is lower, the agreement is not as good, with average ratios
ACPD
6, 941–979, 2006 Technique for measuring aqueous reactive halogens: Part 2 C. Anastasio and B. M. Matthew Title Page Abstract Introduction Conclusions References Tables Figures J I J I Back CloseFull Screen / Esc
Print Version Interactive Discussion
of (model value)/(experiment value) of 1.7, 1.6, and 1.0 for RF ,tot3BPD, RF ,tot3CPD and RLAA, respectively, and corresponding RPD values of 49, 45, and 22%.
3.3.4. Measurements of Br*(g)
In a separate set of experiments to test our understanding of mixed halide chemistry, we measured the formation and release of reactive gaseous bromide species (Br*(g))
5
in the absence of allyl alcohol, as done in previously reported (Matthew et al., 2003). In these experiments we illuminated (313 nm) air-purged solutions containing 0.80 mM Br−, 0.56 M Cl−, and 1.0 mM H2O2 and trapped the volatile Br*(g) on downstream denuders that were then analyzed by ion chromatography. By adding reactions for the evaporation of Br2 and other volatile species, the Mix Full Model (with [AA]=0 µM)
10
accurately describes the release of Br*(aq) from these solutions as a function of pH. These experiments provide further evidence that this model correctly describes mixed halide chemistry in our experimental solutions. Furthermore, because these results were generated with experimental and analytical methods different from our chemical probe methods, they represent an independent check on the model.
15
Taken together, our Br*(g) and 3XPD results demonstrate that the Mix Full Model adequately describes mixed halide chemistry over a wide range of experimental con-ditions, which gives us confidence that the model can be used to evaluate the kinetic equations and performance of the chemical probe technique in mixed halide systems. 3.4. Competition kinetics: overview and expected values
20
As described in Part 1, we use the competition kinetics experiments to calculate the steady-state concentration ([i ]), rate of formation (RFi), and lifetime (τi) for each reactive halogen species i . Here we apply these techniques for four experiments conducted with the chloride and mixed halide systems. Below we discuss how we use model “data” to test our kinetic equations (and associated data treatments) for determining
25
[i ], RFi, and τi, and how we use experimental data to test the overall probe method. 953
ACPD
6, 941–979, 2006 Technique for measuring aqueous reactive halogens: Part 2 C. Anastasio and B. M. Matthew Title Page Abstract Introduction Conclusions References Tables Figures J I J I Back CloseFull Screen / Esc
Print Version Interactive Discussion
In order to evaluate the validity of our kinetic Eqs. (14–16) with model “data”, we need to first determine the “expected” values of [i ], RFi , and τi for each reactive halogen species in our competition kinetics experiments (Table 1). We obtain expected values for [i ] directly from the Mix Full Model using the same conditions (e.g., pH, [Br−], [Cl−]) as the corresponding experiment except that [AA] is set to zero.
5
As in Part 1, expected values of RFi in the chloride and mixed halide experiments are based on kinetic equations derived from the reactions responsible for the formation of
i (S.8 and S.9). For example, the rates of formation of•Cl−2 and Cl•in the chloride and
mixed halide systems are calculated using
RCl − 2 F = k ClOH− Cl− [Cl −][•ClOH−]+ kClOH− H+ [ •ClOH−][H+] (S36) 10 RFCl= kOHCl−[•OH][Cl−]YOHCl (S37)
In the case of BrCl− the formation rate is calculated using
RFBrCl− = kBrOHCl− −[•BrOH
−][Cl−]+ kBr−
ClOH−[•ClOH
−][Br−] (S38)
Instead of directly calculating rates of formation of Br•, Br2, Cl2, and BrCl in the mixed halide system, we use their overall rates of destruction with the major sinks (H2O2,
15
HO•2, and O−2). This approach works since these species are all at steady state (thus, for a given species, the formation and destruction rates are equivalent) and is simpler since the formation rates are difficult to determine (Matthew, 2002). However, because of the complexity of the mixed halide system and the fact that a number of the mixed halide species undergo rapid interconversions, the expected values for the rates of
20
formation should be considered estimates. Finally, the expected value for the lifetime of each reactive halogen species is calculated from
τi = [i ]
RFi
ACPD
6, 941–979, 2006 Technique for measuring aqueous reactive halogens: Part 2 C. Anastasio and B. M. Matthew Title Page Abstract Introduction Conclusions References Tables Figures J I J I Back CloseFull Screen / Esc
Print Version Interactive Discussion
3.5. Competition kinetics: model experiments and data treatments
In Part 1 we evaluated our kinetic equations and three data treatments (A, B, and C) for their ability to provide accurate results for [i ], RFi, and τi in bromide solutions. Treatment A is not used here because it is only applicable for Br•in solutions containing only bromide (Part 1). Data treatments B and C are first evaluated here by applying
5
the treatments to “data” generated from model simulations (i.e., model “experiments”) performed under the same conditions as the actual competition kinetics experiments (Table 1). We evaluate these data treatments by comparing the results obtained from the model “data” after data treatment (i.e., MVDT values; Table 2) with the expected values described above. Because•BrCl− can form both 3BPD and 3CPD (Table S5),
10
MVDT values of [i ], RFi , and τi for •BrCl− can be obtained from both the 3BPD and 3CPD inverse plots. Note that species that are insignificant sources of 3XPD (e.g., Cl• in the mixed halide solutions) are not evaluated.
3.5.1. Evaluation of data treatment B using data generated from model experiments As discussed in Part 1 (Sect. 3.6.2), data treatment B involves fitting a line to the linear
15
portion of the inverse plot and using the resulting slope and y-intercept (i.e., b0and a0) in Eqs. 14–16 to calculate [i ], RFi , and τi. This treatment includes a rough adjustment for the “Fi3XPD effect” by including Fi3XPD in these equations, but no correction for the “AA effect”. Values for Fi3XPDare obtained from the model runs (see Sect. 2.3) and are averages over the linear ranges (Table 2).
20
In the chloride solution (experiment #1; Table 1), •Cl−2 dominates the formation of 3CPD. The value for [•Cl−2] obtained from treatment B is within 20% of the expected value, while values for RCl
− 2
F and τCl2−are within a factor of 2.5 of their expected values
(Table 2). Treatment B does a poor job for the Cl• kinetics, but this is not surprising since Cl• accounts for a very small (and highly variable) portion of 3CPD formation
25
(Fi3XPD=0.03, RSD=37%; Table 2).
ACPD
6, 941–979, 2006 Technique for measuring aqueous reactive halogens: Part 2 C. Anastasio and B. M. Matthew Title Page Abstract Introduction Conclusions References Tables Figures J I J I Back CloseFull Screen / Esc
Print Version Interactive Discussion
Using treatment B on output from models run using the conditions in the mixed halide solutions yields values of [i ] that are within 20% of the expected values for species that are significant sources of 3XPD (i.e., Fi3XPD≥0.15; Experiments 2–4, Table 2). When Fi3XPD values are less than 0.15, differences in [i] are generally larger, although there are several exceptions (e.g.,•Cl−2). Under conditions where Fi3XPD≥0.95, MVDT
5
(model output with data treatment) results for [i ] are within 5% of the expected values. In contrast to these steady-state concentration results, model derived formation rates and lifetimes with Treatment B are generally poor. One exception is•BrCl−, which is generally within a factor of two of expected values. In part this overall poor agreement might be due to the difficulty of calculating expected values for RFi in mixed halide
10
solutions (Sect. 3.4).
3.5.2. Evaluation of data treatment C using data generated from model experiments While treatment C also involves fitting a line to the linear portion of the inverse plot (like treatment B), it is different in that it includes considerable effort to correct for both the AA and Fi3XPD effects. As shown in Table 2, treatment C gives very good results for
15
•
Cl−2 in the chloride experiment, with MVDT values for [i ], RFi , and τi that are within 16%, 10%, and 24%, respectively, of the expected values. Treatment C could not be used for Cl• because the linear portion of the inverse plot of RF , Cl3CPD (the rate of 3CPD formation due to Cl•) had a negative slope, due to the fact that Cl•contributed very little to 3CPD formation.
20
For all species in the mixed halide system, treatment C produces MVDT values of [i ] that are always within 30% (and often within 10%) of the expected values, regardless of the size of Fi3XPD. Although treatment C provides good results for [i ] for all species, it does a poor job of determining RFi and τi. The exception is •BrCl− at pH 5.5 and 8.0, where MVDT values are within 20% of expected values (Table 2). Overall, MVDT
25
results for [i ], RFi, and τi from treatment C are almost always better than those from data treatment B, but in general only the steady-state concentrations are reliably close
ACPD
6, 941–979, 2006 Technique for measuring aqueous reactive halogens: Part 2 C. Anastasio and B. M. Matthew Title Page Abstract Introduction Conclusions References Tables Figures J I J I Back CloseFull Screen / Esc
Print Version Interactive Discussion
to the expected values. Given the complexity of the mixed halide system, it is possible that the large differences between the expected and modeled (MVDT) results for RFi (and τi) obtained with treatment C might be because of errors in the expected values. 3.6. Competition kinetics: experimental data
In this section we use the experimental data generated in the competition kinetics
5
experiments (i.e., RF3XPD as a function of [AA]; Sects. 3.2.2 and 3.3.3) to evaluate the overall chemical probe technique. We do this by comparing the experimentally derived results for [i ], RFi, and τi (i.e., EVDT results; Table 2) with the model-derived expected values (Sect. 3.4). The conditions for the four experiments are listed in Table 1. As described in Part 1, it should be kept in mind that the model experiments establish an
10
upper limit of method performance that cannot be exceeded by experimental results. The few cases where EVDT values are closer to the expected values than MVDT values are probably due to experimental error.
3.6.1. Kinetic results from the chloride experiment (Experiment 1)
The inverse plot for the chloride competition kinetics experiment (Sect. 3.2.2) is shown
15
in Fig. 6, along with the corresponding results from the Cl− Full Model. Based on the model results,•Cl−2 represents nearly all (97%) of 3CPD formation over the linear range of the inverse plot (Table 2). Data treatment C produces the best results from the exper-imental values, in agreement with the model results. With this treatment experexper-imentally derived values of [i ], RFi and τi for•Cl−2 are within 20%, 35%, and 46%, respectively,
20
of the expected values (Table 2). When treatment B is used, the experimental value for [•Cl−2] is within 10% of the expected value, but RFi and τi are off by a factor of 3–4 (Table 2). Because Cl• accounts for an average of only 3% of the 3CPD formed, treat-ment B with the experitreat-mental data yields Cl•kinetic values that are very poor (as with the MVDT results), while treatment C could not be used.
25
ACPD
6, 941–979, 2006 Technique for measuring aqueous reactive halogens: Part 2 C. Anastasio and B. M. Matthew Title Page Abstract Introduction Conclusions References Tables Figures J I J I Back CloseFull Screen / Esc
Print Version Interactive Discussion
3.6.2. Kinetic results for the mixed halide experiments (Experiments 2–4)
Competition kinetics experiments in mixed halide solutions were conducted at pH 3.0, 5.5 and 8.0 (Table 2). As summarized in Table 1, in all three cases there is good agreement between the model and experimental results, with average RPD values for 1/RF ,tot3XPDof 10–50%. As an example of the good agreement, inverse plots for 3BPD and
5
3CPD at pH 3.0, along with the corresponding model results, are shown in Figs. 7a and b.
In agreement with results from the model data, the allyl alcohol chemical probe tech-nique with treatment B can provide good results for [i ] and works best when Fi3XPD is large. Treatment C is generally better, producing fair to excellent experimental
mea-10
surements of the steady-state concentrations of X*(aq) even in a number of cases where Fi3XPD is small (Table 2). With one exception (•BrCl− from 3BPD in Experi-ment 3), experiExperi-mental values of [•BrCl−] and [•Cl−2] obtained with treatment C are within 20% of the expected values, while values for [Br•] are within a factor of two. The ac-curacy of the EVDT results for [Br2] and [BrCl] depend on the fraction of 3BPD formed
15
from each of these species. For instance, at pH 3.0 (Experiment 2), BrCl and Br2 are significant sources of 3BPD (Fi3BPD=0.76 and 0.15, respectively) and experimen-tal values of [i ] (with treatment C) are within 40% of the expected values for these two species. However, at pH 5.5 neither BrCl nor Br2are significant sources of 3BPD (FBrCl3BPD and FBr3BPD
2 =0.09 and 0.02, respectively) and the experimental values of [BrCl]
20
and [Br2] (with treatment C) are higher than the expected values by factors of 3.1 and 3.0, respectively. Note that although data treatment B appears better than treatment C for EVDT values for [BrCl] and [Br2] at pH 5.5, the model results (MVDT) indicate that data treatment C should provide better concentrations (Table 2).
As seen above for the model results, the experimental technique generally does
25
a poor job of measuring RFi (and τi) in mixed halide solutions. The exceptions are Cl2 at pH 3.0 and •BrCl− at pH 5.5 and 8.0, where experimentally derived formation rates obtained with data treatment C are within a factor of 2.5 of the expected values
ACPD
6, 941–979, 2006 Technique for measuring aqueous reactive halogens: Part 2 C. Anastasio and B. M. Matthew Title Page Abstract Introduction Conclusions References Tables Figures J I J I Back CloseFull Screen / Esc
Print Version Interactive Discussion
(Table 2).
3.6.3. Summary of competition kinetic experiments and overall technique
The results of these experiments indicate that the allyl alcohol chemical probe tech-nique, in conjunction with competition kinetics and data treatment C, can accurately measure steady-state concentrations of a number of reactive halogen species in mixed
5
halide solutions that are mostly within a factor of 2 of expected values. The simpler treatment B also generally produces good results for [i ] that are within a factor of 2.5 of expected values for those reactive halogens responsible for a significant fraction of the 3XPD measured. In contrast, both treatments produce experimentally determined rates of formation and lifetimes of reactive halogens in mixed halide solutions that are
10
generally quite different from the expected values. This is in contrast to results from so-lutions containing only bromide (Part 1) or chloride (Sect. 3.6.1), where the technique can generally measure [i ], RFi, and τi to within a factor of 2 for Br•, Br2, HOBr, and•Cl−2. 3.7. Applications and limitations of the probe technique
As discussed in Part 1, this technique was developed to investigate halide oxidation
15
by •OH, which is an important process in seawater (Zafiriou et al., 1987; Zhou and Mopper, 1990), sea-salt particles (Matthew et al., 2003), and perhaps in the snowpack (Chu and Anastasio, 2005). As with the bromide system, accurately modeling the chemistry in the chloride and mixed halide systems requires measuring•OH kinetics in the sample so that RFOH, [•OH], and τOHcan be accurately represented in the model. If
20
other oxidants are employed (e.g.,•NO3or O3) the kinetic equations and model would need to be modified and tested.
While the work described here was done on laboratory solutions, our technique is sensitive enough that it should also work on environmental samples. Concentrations of•OH in the mixed halide solutions (in the absence of AA) in the competition kinetics
25
experiments here ranged from (4–9)×10−16M. Based on the sensitive detection limits 959
ACPD
6, 941–979, 2006 Technique for measuring aqueous reactive halogens: Part 2 C. Anastasio and B. M. Matthew Title Page Abstract Introduction Conclusions References Tables Figures J I J I Back CloseFull Screen / Esc
Print Version Interactive Discussion
for 3BPD and 3CPD (approximately 1 and 7 nM, respectively; Matthew and Anastasio, 2000), the technique should work readily in illuminated sea-salt aerosols where•OH concentrations are typically 10−16–10−15M (Newberg, 2003). After some modification to improve sensitivity (e.g., by taking larger sample aliquots), the technique should also be useful in illuminated seawater samples where hydroxyl radical concentrations are
5
typically 10−18 to 10−17M (Zhou and Mopper, 1990). In addition to quantifying con-centrations of reactive halogens in environmental samples, the technique also offers the opportunity to quantitatively examine the rates and mechanisms of halogenation of organic compounds under environmental conditions.
The major limitation of the method stems from the fact that it is somewhat
non-10
specific, i.e., 3BPD and 3CPD are each formed by several different reactive halogen species. Because of this, we need to use results from a numerical model to calculate the fraction of 3XPD formed from each species (Fi3XPD). There are possible biases associated with using these model-derived values of Fi3XPD, but as discussed in Part 1, we feel these biases are generally small. In addition, there are some important
con-15
ditions (e.g., at the high pH of seawater or fresh sea-salt particles; see Experiment 4 in Table 2) where 3XPD is formed by essentially only one species and thus the lack of specificity in the technique is unimportant.
A second limitation of the technique is that a data treatment must be chosen to analyze the experimental results. In the well-defined laboratory solutions studied here
20
we can choose data treatments based on their performance in the model experiments (Sect. 3.5). Similar steps could be performed for studies of environmental samples, but this would assume that results from the laboratory solutions are generally applicable to environmental samples. A third limitation of the technique in mixed halide solutions is that it can currently only be used to quantitatively measure steady-state concentrations
25
of X*(aq), with the exception of•BrCl−in non-acidic solutions where RFi and τi can also be determined.
ACPD
6, 941–979, 2006 Technique for measuring aqueous reactive halogens: Part 2 C. Anastasio and B. M. Matthew Title Page Abstract Introduction Conclusions References Tables Figures J I J I Back CloseFull Screen / Esc
Print Version Interactive Discussion
4. Conclusions
We have developed a chemical probe technique that can quantify reactive halide species in solutions containing bromide and/or chloride. This technique is based on the reaction of aqueous-phase reactive halogens (X*(aq)) with allyl alcohol to form 3-bromo-1,2-propanediol and 3-chloro-1,2-propanediol (collectively referred to as 3XPD).
5
Using competition kinetics, the measured rates of 3XPD formation are used to deter-mine the steady-state concentrations of X*(aq) as well as their rates of formation and lifetimes under some conditions. The technique was in part validated with models that were constrained by several sets of experiments that measured 3XPD formation and Br2(g) release under a wide range of experimental conditions.
10
In bromide or chloride solutions the technique can be used to measure steady- state concentrations, rates of formation, and lifetimes of several reactive halide species, in-cluding Br•, Br2, HOBr, and •Cl−2. In mixed bromide/chloride solutions, the technique can measure steady-state concentrations of these same species as well as BrCl and
•
BrCl−. Experimentally determined results are generally within a factor of 2–3 (and
15
often much closer) of values derived from model runs. While this technique has a few limitations, it is a new and sensitive tool that can be used to investigate aqueous halide chemistry, halide oxidation mechanisms and halide radical dynamics in both laboratory solutions and environmental samples.
Acknowledgements. This work was supported by the Atmospheric Chemistry Program of the
20
National Science Foundation (ATM-9701995), a NASA Earth System Science Fellowship (to B. M. Matthew), and by a University of California, Davis Jastro-Shields Fellowship. The authors thank A. Jordan, J. Chang, J. Smith, and I. George for assistance.
References
Anastasio, C., Faust, B. C., and Allen, J. M.: Aqueous phase photochemical formation of
hy-25
drogen peroxide in authentic cloud waters, J. Geophys. Res., 99, 8231–8248, 1994. 961
ACPD
6, 941–979, 2006 Technique for measuring aqueous reactive halogens: Part 2 C. Anastasio and B. M. Matthew Title Page Abstract Introduction Conclusions References Tables Figures J I J I Back CloseFull Screen / Esc
Print Version Interactive Discussion
Braun, W., Herron, J. T., and Kahaner, D. K.: Acuchem: A computer program for modeling complex chemical reaction systems, Int. J. Chem. Kin., 20, 51–62, 1988.
Chu, L. and Anastasio, C.: Formation of hydroxyl radical from the photolysis of frozen hydrogen peroxide, J. Phys. Chem. A, 109, 6264–6271, 2005.
Donati, A.: Spectroscopic and kinetic investigations of halogen-containing radicals in the
tropo-5
spheric aqueous phase, Leipzig, Germany, University of Leipzig, 2002.
Ershov, B. G.: Kinetics, mechanism and intermediates of some radiation-induced reactions in aqueous solutions, Russian Chem. Rev., 73, 101–113, 2004.
Matthew, B. M.: Chemical probe technique for the detection of oxidized halogen species in aqueous solution, Ph.D. Dissertation, University of California – Davis, 2002.
10
Matthew, B. M. and Anastasio, C.: Determination of halogenated mono-alcohols and diols in water by gas chromatography with electron-capture detection, J. Chromatogr. A, 866, 65–77, 2000.
Matthew, B. M. and Anastasio, C.: A chemical probe technique for the determination of reac-tive halogen species in aqueous solution: Part 1 – Bromide solutions, Atmos. Chem. Phys.
15
Discuss., 6, 899–940, 2006,
SRef-ID: 1680-7375/acpd/2006-6-899.
Matthew, B. M., George, I., and Anastasio, C.: Hydroperoxyl radical (HO2) oxidizes dibromide radical anion (Br2-) to bromine (Br2) in aqueous solutions: Implications for the formation of Br2in the marine boundary layer, Geophys. Res. Lett., 30, 2297–2301, 2003.
20
Zafiriou, O. C., True, M. B., and Hayon, E.: Consequences of OH radical reaction in sea wa-ter: Formation and decay of Br2- ion radical, in: Photochemistry of Environmental Aquatic Systems, edited by: Zika, R. G. and Cooper, W. J., American Chemical Society, Washington D.C., 89–105, 1987.
Zhou, X. and Mopper, K.: Determination of photochemically produced hydroxyl radicals in
sea-25
ACPD
6, 941–979, 2006 Technique for measuring aqueous reactive halogens: Part 2 C. Anastasio and B. M. Matthew Title Page Abstract Introduction Conclusions References Tables Figures J I J I Back CloseFull Screen / Esc
Print Version Interactive Discussion
Table 1. Parameters for the competition kinetics experiments.
Exp [AA] Range Tested Linear [AA] Rangea(µM) Agreement Between Model and Experimentc(Average RPD)
# pH (µM) nb 3BPD nb 3CPD nb 3BPD 3CPD AA
Chloride Experiment ([Cl−]=0.56 M, no Br−)
1 5.4 2–75 8 – – 2–15 4 – 7.5 22
Mixed Halide Experiments ([Cl−]=0.56 M, [Br−]=0.80 mM)
2 3.0 2–150 11 2–25 7 20–150 6 10 15 19
3 5.5 10–3000 12 10–250 8 10–500 9 25 18 13
4 8.0 20–150 6 20–150 6 20–150 6 49 45 22
The concentration of H2O2for all experiments was 0.98–1.0 mM. The photolysis rate constant for H2O2(jH2O2) was 3.3×10
−6
s−1for all experiments.
a
Range of allyl alcohol concentration where the inverse plot based on the total rate of 3XPD formation is linear. Note that the linear range can change when the inverse plots are based on individual species, as is done in treatment C.
b
Number of experimental data points sampled within the specified range.
c
Agreement between the experimental data and model output, calculated as the average of the absolute values of the relative percent difference (RPD) between the model and experimental values of RF , tot3XPD(and RLAA) over the entire range of allyl alcohol concentrations. Note that the listed values for RF , tot3XPDand RLAAalso apply to 1/RF , tot3XPDand 1/RLAA, respectively.
ACPD
6, 941–979, 2006 Technique for measuring aqueous reactive halogens: Part 2 C. Anastasio and B. M. Matthew Title Page Abstract Introduction Conclusions References Tables Figures J I J I Back CloseFull Screen / Esc
Print Version Interactive Discussion
Table 2. Results from the kinetic analyses of the model and experimental data from the
com-petition kinetics experiments.
Fraction of 3XPD Model Value with Data Treatment (MVDT)d Experimental Value with Data Treatment (EVDT)e from Listed
Expected Valuesa X* Species, Rate of formation, RFi Concentration, [i ] Rate of formation, R i F Concentration, [i ] Species (i ) Ri F(M s −1 ) [i ] (M) D.T.b F3XPD i (1RSD) c Value (M s−1) nMVDT Exp o Value (M ) nMVDT Exp o Value (M s−1) nEVDT Exp o Value (M) nEVDT Exp o Experiment #1 ([Cl−]=0.56 M, pH=5.4, no Br− ) Cl• 2.7×10⁻⁹ 3.2×10⁻¹⁶ B 0.03(0.37) 2.3×10⁻¹¹ {0.01} 1.4×10⁻¹⁵ {4.3} (1.6±0.02)×10−11 {0.01} (1.8±0.03)×10−15 {5.6} • Cl−2 4.4×10 −9 1.1×10⁻¹¹ B 0.97(0.01) 1.9×10⁻⁹ {0.42} 8.5×10⁻¹² {0.80} (1.3±0.02)×10−9 {0.29} (1.1±0.02)×10−11 {1.1} C 1 4.6×10⁻⁹ {1.1} 8.8×10⁻¹² {0.84} (2.9±0.03)×10−9 {0.65} (1.2±0.02)×10−11 {1.2} Experiment #2 ([Cl−]=0.56 M, [Br−]=0.80 mM, pH=3.0) Br• 6.4×10⁻⁹ 1.6×10⁻¹⁵ B 0.02(0.57) 7.6×10⁻¹¹ {0.01} 7.5×10⁻¹⁵ {4.7} (6.5±0.62)×10−11 {0.01} (1.4±0.22)×10−14 {8.4} C 1 1.7×10⁻⁹ {0.27} 1.4×10⁻¹⁵ {0.88} (4.4±2.3)×10−10 {0.07} (1.7±0.06)×10−15 {1.1} • BrCl− 2.2×10⁻⁹ 1.5×10⁻¹² B 0.07(0.57) 4.9×10⁻¹⁰ {0.22} 6.8×10⁻¹² {4.7} (4.2±0.40)×10−10 {0.19} (1.2±0.20)×10−11 {8.4} (3BPD)f C 1 1.0×10⁻⁸ {4.5} 1.3×10⁻¹³ {0.89} (2.8±1.9)×10−9 {1.3} (1.6±0.04)×10−12 {1.1} • BrCl− 2.2×10⁻⁹ 1.5×10⁻¹² B 0.80(0.05) 3.4×10⁻⁹ {1.5} 1.7×10⁻¹² {1.2} (7.9±6.3)×10−9 {3.6} (1.4±0.11)×10−12 {0.96} (3CPD)f C 1 6.7×10⁻⁹ {3.0} 1.4×10⁻¹² {0.93} (1.1±1.3)×10−8 {5.0} (1.3±0.14)×10−12 {0.91} • Cl−2 3.4×10 −9 2.0×10⁻¹⁵ B 0.09(0.16) 9.8×10⁻¹² {0.003} 2.8×10⁻¹⁵ {1.4} (2.3±1.8)×10−11 {0.007} (2.3±0.18)×10−15 {1.2} C 1 7.0×10⁻¹¹ {0.02} 1.9×10⁻¹⁵ {0.96} (2.5±0.01)×10−11 {0.007} (2.0±0.15)×10−15 {1.0} Br2 4.6×10 −10 5.8×10⁻¹¹ B 0.15(0.06) 8.4×10⁻¹¹ {0.18} 4.9×10⁻¹¹ {0.85} (3.1±0.30)×10−11 {0.07} (8.8±1.5)×10−11 {1.5} C 1 8.4×10⁻¹¹ {0.18} 5.5×10⁻¹¹ {0.95} (3.6±0.16)×10−11 {0.08} (4.6±0.59)×10−11 {0.79} BrCl 9.6×10⁻¹¹ 3.0×10⁻¹² B 0.76(0.06) 4.3×10⁻¹⁰ {4.5} 2.6×10⁻¹² {0.85} (3.2±0.30)×10−10 {3.3} (4.6±0.76)×10−12 {1.5} (3BPD)g C 1 3.3×10⁻¹⁰ {3.4} 2.2×10⁻¹² {0.73} (3.6±0.15)×10−10 {3.8} (1.8±0.22)×10−12 {0.61} Cl2 8.8×10⁻¹³ 1.9×10⁻¹⁴ B 0.09(0.58) 1.2×10⁻¹² {1.4} 1.3×10⁻¹⁵ {0.07} (2.8±2.2)×10−12 {3.2} (1.1±0.08)×10−15 {0.06} C 1 5.4×10⁻¹³ {0.61} 1.9×10⁻¹⁴ {1.04} (4.6±1.4)×10−13 {0.52} (1.7±0.62)×10−14 {0.89} Experiment #3 ([Cl−]=0.56 M, [Br−]=0.80 mM, pH=5.5) Br• 6.3×10⁻⁹ 1.6×10⁻¹⁵ B 0.22(0.08) 6.3×10⁻¹⁰ {0.10} 1.9×10⁻¹⁵ {1.1} (3.5±0.51)×10−10 {0.06} (3.8±0.26)×10−15 {2.3} C 1 1.1×10⁻⁹ {0.17} 1.6×10⁻¹⁵ {1.0} (5.3±0.93)×10−10 {0.08} (3.2±0.17)×10−15 {1.9} • BrCl− 6.2×10⁻⁹ 1.5×10⁻¹² B 0.66(0.08) 4.1×10⁻⁹ {0.66} 1.7×10⁻¹² {1.1} (2.3±0.33)×10−9 {0.37} (3.5±0.24)×10−12 {2.3} (3BPD)f C 1 7.4×10⁻⁹ {1.2} 1.5×10⁻¹² {1.0} (3.5±0.62)×10−9 {0.56} (2.9±0.18)×10−12 {2.0} • BrCl− 6.2×10⁻⁹ 1.5×10⁻¹² B 0.95(<0.01) 5.2×10⁻⁹ {0.84} 1.4×10⁻¹² {0.95} (3.2±2.0)×10−9 {0.52} (1.2±0.08)×10−12 {0.83} (3CPD)f C 1 7.0×10⁻⁹ {1.1} 1.4×10⁻¹² {0.96} (4.2±3.0)×10−9 {0.68} (1.3±0.11)×10−12 {0.84} • Cl−2 4.4×10 −11 9.2×10⁻¹⁶ B 0.04(0.02) 5.8×10⁻¹² {0.13} 8.9×10⁻¹⁶ {0.96} (3.6±2.2)×10−12 {0.08} (7.8±0.50)×10−16 {0.84} C 1 8.0×10⁻¹² {0.18} 8.9×10⁻¹⁶ {0.96} (4.5±3.4)×10−12 {0.10} (7.8±0.70)×10−16 {0.85} Br2 2.6×10 −11 3.6×10⁻¹³ B 0.02(0.58) 8.7×10⁻¹² {0.33} 1.5×10⁻¹³ {0.42} (4.9±0.71)×10−12 {0.18} (3.1±0.21)×10−13 {0.86} C 1 4.7×10⁻¹² {0.39} 3.9×10⁻¹³ {1.1} (4.4±0.67)×10−12 {0.17} (1.1±0.81)×10−12 {3.0} BrCl 1.2×10⁻¹² 1.9×10⁻¹⁴ B 0.09(0.59) 4.5×10⁻¹¹ {38} 7.9×10⁻¹⁵ {0.42} (2.5±0.36)×10−11 {21} (1.6±0.11)×10−14 {0.86} (3BPD)g C 1 2.4×10⁻¹¹ {20} 2.0×10⁻¹⁴ {1.1} (2.2±0.34)×10−11 {18} (5.8±4.3)×10−14 {3.1} Experiment #4 ([Cl−]=0.56 M, [Br−]=0.80 mM, pH=8.0) Br• 4.5×10⁻⁹ 1.2×10⁻¹⁵ B 0.998(<0.01) 7.7×10⁻¹⁰ {0.17} 1.2×10⁻¹⁵ {1.0} (5.4±0.64)×10−10 {0.12} (6.7±0.11)×10−16 {0.59} C 1 1.0×10⁻⁹ {0.22} 1.2×10⁻¹⁵ {1.0} (7.3±0.86)×10−10 {0.16} (6.7±0.11)×10−16 {0.58} • BrCl− 6.3×10⁻⁹ 1.1×10⁻¹² B 0.95(<0.01) 4.9×10⁻⁹ {0.78} 1.0×10⁻¹² {0.96} (1.8±0.35)×10−9 {0.29} (1.0±2.1)×10−12 {0.95} (3CPD)f C 1 6.7×10⁻⁹ {1.1} 1.0×10⁻¹² {0.96} (2.5±0.48)×10−9 {0.40} (9.9±2.1)×10−13 {0.94} •Cl− 2 2.0×10 −11 6.4×10⁻¹⁶ B 0.04(<0.01) 5.3×10⁻¹² {0.27} 6.2×10⁻¹⁶ {0.97} (2.0±0.38)×10−12 {0.10} (6.1±1.3)×10−16 {0.96} C 1 7.4×10⁻¹² {0.37} 6.1×10⁻¹⁶ {0.96} (2.8±0.55)×10−12 {0.14} (6.0±1.3)×10−16 {0.94}
ACPD
6, 941–979, 2006 Technique for measuring aqueous reactive halogens: Part 2 C. Anastasio and B. M. Matthew Title Page Abstract Introduction Conclusions References Tables Figures J I J I Back CloseFull Screen / Esc
Print Version Interactive Discussion
Table 2. Continued.
Lifetimes (τi) were not included in the table but can be calculated as τi=[i]
.
RFi. Values of (MVDT/Exp) for τi are calculated by dividing the (MVDT/Exp) value for [i ] by the (MVDT/Exp)
value for RFi. The values for (EVDT/Exp) for τi are calculated in an analogous manner.
a
Expected values are model-derived best estimates of the actual values for [i ] and RFi in the experimental solutions in the absence of AA (Sect. 3.4).
b
Data treatments (D.T.) are discussed in Sect. 3.5. Data treatment B makes a rough correc-tion for the Fi3XPD effect, while data treatment C makes corrections for both the AA and Fi3XPD effects.
c
Values in parentheses are the relative standard deviations of the average Fi3XPDvalues cal-culated for the linear AA ranges (Table 1). Treatments B and C rely on the inverse plot defined by the linear AA range.
d
Calculated by taking the model-derived “data” through the data treatment steps (Sect. 3.5).
e
Calculated by taking the experimental results through the data treatment steps (Sect. 3.6). Er-rors are ±1 standard error calculated based on the standard erEr-rors of the slope and y-intercept from the inverse plots.
f
Kinetic information for•BrCl− can be determined using the inverse plot generated with either the 3BPD or 3CPD data. The analyte listed in parentheses is the one used for a given set of kinetic information.
g
Kinetic information for BrCl is determined using inverse plots generated from 3BPD data since BrCl is not a significant source of 3CPD.
ACPD
6, 941–979, 2006 Technique for measuring aqueous reactive halogens: Part 2 C. Anastasio and B. M. Matthew Title Page Abstract Introduction Conclusions References Tables Figures J I J I Back CloseFull Screen / Esc
Print Version Interactive Discussion
0
10
20
30
40
3.0
4.0
5.0
6.0
7.0
8.0
pH
Ra
te
of
3CP
D
Fo
rma
tio
n
(n
M
mi
n
-1)
Experiment
Model
(a)
Fig. 1. (a) Rate of 3-chloro-1,2-propanediol (3CPD) formation (RF , tot3CPD) as a function of pH in
illuminated (313 nm) aqueous chloride solutions ([Cl−]=0.56 M) containing 1.0 mM H2O2 and 75 µM AA. The triangles are experimental values of RF , tot3CPD, with error bars representing 90% confidence intervals (CI). CI were calculated from the standard errors of the slopes from plots of 3CPD concentration versus illumination time at each pH. The dashed lines are model results from the Cl−Full Model.
ACPD
6, 941–979, 2006 Technique for measuring aqueous reactive halogens: Part 2 C. Anastasio and B. M. Matthew Title Page Abstract Introduction Conclusions References Tables Figures J I J I Back CloseFull Screen / Esc
Print Version Interactive Discussion
0
100
200
300
400
500
600
3.0
4.0
5.0
6.0
7.0
8.0
pH
Rate o
f
AA Loss
(nM min
-1)
Experiment
Model
(b)
Fig. 1. (b) Rate of allyl alcohol loss (RLAA) under conditions described in Fig. 1a. The
dia-monds are experimental values of RLAA, with error bars representing 90% confidence intervals (CI), calculated from the standard errors of the slopes from plots of AA concentration versus illumination time. The dot-dashed lines are model results from the Cl− Full Model.
ACPD
6, 941–979, 2006 Technique for measuring aqueous reactive halogens: Part 2 C. Anastasio and B. M. Matthew Title Page Abstract Introduction Conclusions References Tables Figures J I J I Back CloseFull Screen / Esc
Print Version Interactive Discussion
0.0
2.0
4.0
6.0
8.0
0
20
40
60
80
Concentration of Allyl Alcohol (μM)
Rat
e
of
3
C
P
D
F
o
rm
at
ion
(
n
M
mi
n
-1)
Experiment
Model
(a)
Fig. 2. (a) Rate of 3-chloro-1,2-propanediol (3CPD) formation (RF , tot3CPD) as a function of [AA]
in illuminated (313 nm) aqueous chloride solutions ([Cl−]=0.56 M, pH=5.4) containing 1.0 mM H2O2. Symbols, error bars, and lines are the same as described in Fig. 1a.
ACPD
6, 941–979, 2006 Technique for measuring aqueous reactive halogens: Part 2 C. Anastasio and B. M. Matthew Title Page Abstract Introduction Conclusions References Tables Figures J I J I Back CloseFull Screen / Esc
Print Version Interactive Discussion
0
100
200
300
400
500
0
20
40
60
80
Concentration of Allyl Alcohol (μM)
Ra
te
o
f
A
A
L
o
ss (n
M min
-1)
Experiment
Model
(b)
Fig. 2. (b) Rate of allyl alcohol loss (RLAA) as a function of [AA] in the illuminated solutions
described in Fig. 2a. Symbols, error bars, and lines are the same as in Fig. 1b.
ACPD
6, 941–979, 2006 Technique for measuring aqueous reactive halogens: Part 2 C. Anastasio and B. M. Matthew Title Page Abstract Introduction Conclusions References Tables Figures J I J I Back CloseFull Screen / Esc
Print Version Interactive Discussion
0
2
4
6
8
10
12
0
200
400
600
800
Bromide Concentration (μM)
R
a
te o
f 3
XPD
Fo
rma
tio
n (
n
M
mi
n
-1)
Experiment: 3BPD
Experiment: 3CPD
Model: 3BPD
Model: 3CPD
(a)
Fig. 3. (a) Rates of 3-bromo-1,2-propane-diol (3BPD) and 3-chloro-1,2-propanediol (3CPD)
formation (RF , tot3BPDand RF , tot3CPD, respectively) as a function of [Br−] in illuminated (313 nm) aqueous chloride solutions ([Cl−]=0.56 M, pH=5.4) containing 1.0 mM H2O2and 75 µM AA. The squares and triangles are the experimental values of RF , tot3BPD and RF , tot3CPD, respectively, while the solid and dashed lines are the Mix Full Model values for RF , tot3BPD and RF , tot3CPD, respectively. Error bars are
ACPD
6, 941–979, 2006 Technique for measuring aqueous reactive halogens: Part 2 C. Anastasio and B. M. Matthew Title Page Abstract Introduction Conclusions References Tables Figures J I J I Back CloseFull Screen / Esc
Print Version Interactive Discussion
0
100
200
300
400
500
0
200
400
600
800
Bromide Concentration (μM)
Ra
te of AA Loss
(nM m
in
-1)
Experiment
Model
(b)
Fig. 3. (b) Rate of allyl alcohol loss (RLAA) in the experiments described in Fig. 3a. The
dia-monds are the experimental values of RLAA, while the dot-dashed lines are the Mix Full Model
values. The error bars are the same as in Fig. 1b.
ACPD
6, 941–979, 2006 Technique for measuring aqueous reactive halogens: Part 2 C. Anastasio and B. M. Matthew Title Page Abstract Introduction Conclusions References Tables Figures J I J I Back CloseFull Screen / Esc
Print Version Interactive Discussion
0
5
10
15
20
25
3.0
4.0
5.0
6.0
7.0
8.0
pH
Rat
e
of
3BPD F
o
rm
at
ion (
n
M min
-1)
Experiment
Model
(a)
Fig. 4. (a) Rate of 3-bromo-1,2-propane-diol (3BPD) formation (RF , tot3BPD) as a function of pH in
illuminated (313 nm) aqueous mixed halide solutions ([Cl−]=0.56 M, [Br−]=0.80 mM) containing 1.0 mM H2O2and 75 µM AA. The symbols, lines, and error bars are the same as described in Fig. 3a.


![Fig. 1. (a) Rate of 3-chloro-1,2-propanediol (3CPD) formation (R F , 3CPD tot ) as a function of pH in illuminated (313 nm) aqueous chloride solutions ([Cl − ] = 0.56 M) containing 1.0 mM H 2 O 2 and 75 µM AA](https://thumb-eu.123doks.com/thumbv2/123doknet/14785725.598711/27.918.101.606.41.510/propanediol-formation-function-illuminated-aqueous-chloride-solutions-containing.webp)
![Fig. 2. (b) Rate of allyl alcohol loss (R L AA ) as a function of [AA] in the illuminated solutions described in Fig](https://thumb-eu.123doks.com/thumbv2/123doknet/14785725.598711/30.918.102.601.43.522/fig-rate-allyl-alcohol-function-illuminated-solutions-described.webp)
![Fig. 3. (a) Rates of 3-bromo-1,2-propane-diol (3BPD) and 3-chloro-1,2-propanediol (3CPD) formation (R F , 3BPD tot and R F , 3CPDtot , respectively) as a function of [Br − ] in illuminated (313 nm) aqueous chloride solutions ([Cl − ] = 0.56 M, pH = 5.4) co](https://thumb-eu.123doks.com/thumbv2/123doknet/14785725.598711/31.918.104.609.45.520/propane-propanediol-formation-respectively-function-illuminated-chloride-solutions.webp)
![Fig. 4. (a) Rate of 3-bromo-1,2-propane-diol (3BPD) formation (R F , 3BPD tot ) as a function of pH in illuminated (313 nm) aqueous mixed halide solutions ([Cl − ]=0.56 M, [Br − ]=0.80 mM) containing 1.0 mM H 2 O 2 and 75 µM AA](https://thumb-eu.123doks.com/thumbv2/123doknet/14785725.598711/33.918.103.603.50.525/propane-formation-function-illuminated-aqueous-halide-solutions-containing.webp)

