HAL Id: insu-03132098
https://hal-insu.archives-ouvertes.fr/insu-03132098
Submitted on 5 Feb 2021
HAL is a multi-disciplinary open access
archive for the deposit and dissemination of
sci-entific research documents, whether they are
pub-lished or not. The documents may come from
teaching and research institutions in France or
abroad, or from public or private research centers.
L’archive ouverte pluridisciplinaire HAL, est
destinée au dépôt et à la diffusion de documents
scientifiques de niveau recherche, publiés ou non,
émanant des établissements d’enseignement et de
recherche français ou étrangers, des laboratoires
publics ou privés.
Mesospheric temperature inversions as seen by ISAMS
in December 1991
Thierry Leblanc, Alain Hauchecorne, Marie-Lise Chanin, Clive Rodgers, Fred
Taylor, Nathaniel Livesey
To cite this version:
Thierry Leblanc, Alain Hauchecorne, Marie-Lise Chanin, Clive Rodgers, Fred Taylor, et al..
Meso-spheric temperature inversions as seen by ISAMS in December 1991. Geophysical Research Letters,
American Geophysical Union, 1995, 22 (12), pp.1485-1488. �10.1029/94GL03274�. �insu-03132098�
GEOPHYSICAL RESEARCH LETTERS, VOL. 22, NO. 12, PAGES 1485-1488, JUNE 15, 1995
Mesospheric temperature inversions
December
1991
as seen by
ISAMS
in
Thierry Leblanc, Alain Hauchecorne and Marie-Lise Chartin
Service d'A6ronomie du CNRS, Verri•res-le-Buisson, France
Clive Rodgers, Fred Taylor and Nathaniel Livesey
Clarendon Laboratory, University of Oxford, United Kingdom
Abstract. A large number of mesospheric temperature
inversion layers have been observed locally in recent decades, notably by the network of French lidars. It is shown in this paper that the Improved Stratospheric and Mesospheric Sounder on board the Upper Atmosphere Research Satellite is able to detect the presence of temperature inversions, and thus allows the study of their occurrence and characteristics on a global scale. During December 1991, inversions of large amplitude (greater than 20 K) are seen almost every day, especially in mid latitudes, with extent varying typically from
105 to 106
km
2. Several
particularly
large
inversions
were
observed at the end of the month. Their correlation with
assimilated stratospheric winds is consistent with the interpretation that gravity waves propagate unfiltered through the stratosphere in the regions of strong winds, and break in the mesosphere.
The combination of high resolution lidar measurements and global satellite coverage is expected to lead to a better understanding of this significant feature of the winter
mesosphere at middle latitudes.
Introduction.
Significant inversions of the vertical temperature gradient, from negative to positive, are often observed in the
mesosphere around 70 kin. This feature was first measured by
rocketsondes and reported by Schmidlin [1976]. Since 1981,
when inversion layers were clearly observed by lidar, many such inversions have been seen between 65 and 80 kin, using
lidar measurements above two sites in France. An initial
statistical analysis of the occurrence of inversions was carried out by Hauchecorne et al. [1987] and showed that at least over
these sites (44øN, 1 øW-6øE), they are very frequent (about one
day on two in winter). The authors interpreted the mesospheric
temperature inversions as due to gravity waves breaking in the
mesosphere, and were able to reproduce their formation with a
2D model [Hauchecorne and Maillard, 1990].
To date, very little is known about the global distribution of mesospheric inversions: monthly averaged temperature profiles obtained by the Solar Mesosphere Explorer (SME) during the 1982-1986 period indicated their presence in January at 45øN latitude [Clancy and Rusch, 1989]. However, until recently, it was impossible to describe their global distribution, and compare it with the output of models.
Copyright 1995 by the American Geophysical
Union.
Paper number 94GL03274
0094-8534/95/94GL-03 274503.00
After the launch of the Upper Atmosphere Research Satellite (UARS) by NASA in September 1991, temperature
measurements were performed by the Improved Stratospheric
and Mesospheric Sounder [Taylor et al., 1993] from 30 to 80
km until July 1992. The comparison with simultaneous and co-located French lidar data helped to improve the retrieval algorithm and provided confidence in the validity of the
profiles up to at least 70 km [Dudhia et a1.,1993]. This
triggered the search for inversion layers on a global scale
between 65 and 80 kin.
The present study was performed for the Northern
Hemisphere during the winter period from 0øN to 76øN for
December 1991 where the occurrence of the inversions,
according to lidar observations, is most frequent. First, a brief description is given of the data validation, then the method of
data analysis is summarised, and finally, we present the results
obtained, and their interpretation.
Data validation: Comparison between the ISAMS
and the OHP !idar temperature measurements.
The satellite data used in this work is ISAMS Level 3AL
temperature profiles, processing versions 5 and 7. It consists of temperature measurements interpolated onto a grid of 4
degrees of latitude along the track of the observation point seen from the satellite. The data is presented on the standard UARS vertical grid, which is uniformly spaced in
log(pressure),with 6 points in each decade:
p(k) = P0* 10
-k/6
where P0 is 1000 hPa, and the index k runs from 6 to typically
35 (100 hPa to 0.00147 hPa) for ISAMS temperature retrievals
at level 3AL.
The characteristics of the ISAMS V0007 temperature retrieval are shown in figure 1. This indicates that the random
error on the retrieved temperatures has a minimum of about 4 K
at 50 km increasing to an error of 12 K at about 80 kin. The widths of the averaging kernels indicate the vertical resolution
of the measurements, and the integrated response indicates the
fraction of the information in the retrieval which comes from
the measurements. The remainder comes from climatology. The combination of the measurements and the climatology allows to miniraise the final data error[ Rodgers, 1990]. Above about 80 kin, the retrieval contains a significant fraction of climatology.
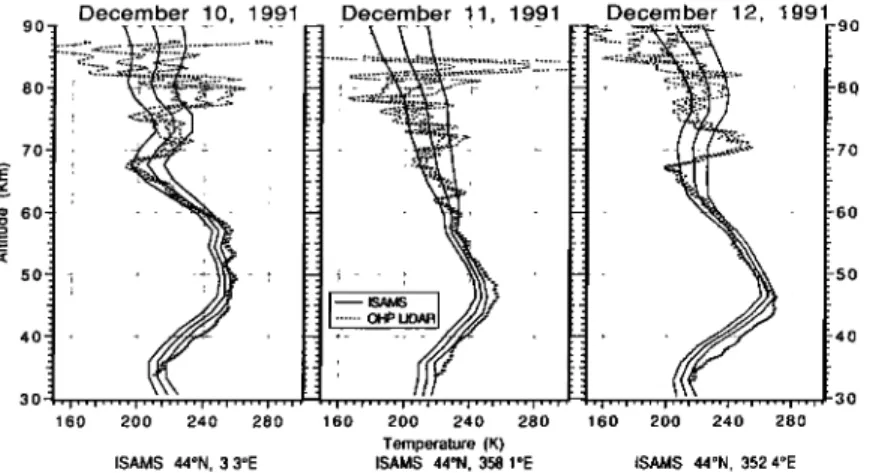
Figure 2 illustrates typical comparisons between the lidar
and ISAMS profiles. The lidar is located at Observatoire de
Haute-Provence (44øN, 6øE) and the ISAMS data is interpolated
along the measurement track to 44øN. The lidar and ISAMS
1486 LEBLANC ET AL.' MESOSPHERIC TEMPERATURE INVERSIONS •espon• .•o• 90 .•:"• ', 70 • 20 '•' 00'• ' • 40 10 • 5 '. • 20 •.2 0.0 0.2 0A 0.6 0.8 1.0 1.2 R•e [dTJdT•
Figure 1. Ch•acteristics of the ISAMS V0007 temperathe retrieval. The solid lines •e the "averaging kernels" which indicate the response of the retrieved profile to unit
pert•bations at •e indicated levels of the "true" profile. •e
do•ed line represents the s•aation of this response over all
the levels. The dashed l•e indicates the ratio of the relieved
e•or to the cl•atological error (20 K), as produced by the e•or analysis, while the dashed-dot Hne indicates the ratio as
t•en from a typical day of V•07 data.
profiles were obtained on the nights of December 10/11th,
11/12th and 12/13th, 1991.
These comparisons show a general good agreement. They also indicate that the finer structure is not seen by ISAMS.
However, ISAMS is able to detect inversion layers as observed by the Rayleigh lidar around 70-75 km (December 10th and
12th: 0.04-0.012 hPa), but with smaller amplitude, due to its
vertical resolution of 3-4 km at that height, to the horizontal smoothing of 200-400 km due to the limb observation and to the horizontal interpolation in the 3AL grid. It is thus
possible to study the global extent of inversion layers of this
size.
Data analysis.
The initial data was interpolated, for each day of December, onto a grid of 5 ø of longitude for the whole Northern
Hemisphere, between 0øN and 76øN. The method used is similar to the 2-D Shepard's method, [Shepard, 1968] giving
to each data point a weight inversely proportional to the square of the distance from the grid location. This method was
chosen because of the strong spatial heterogeneity of the
measurements on the track of the satellite.
Moreover, to homogenise the data field, a smoothing over five points (25 ø of longitude, corresponding approximately to
the distance between two northward tracks or two southward
tracks) was carried out. This somewhat reduces the effects of the atmospheric tides [Dudhia et al., 1993], as between the
southward and northward tracks the local solar time differs at
low latitudes by more than 9 hours. Though this smoothing does not completely remove the tidal effects on the temperature field, particularly in the mesosphere, it can be considered as adequate for the study of inversion layers whose
amplitude should not be much affected by tides.
The interpolated data now comprises one 3-D temperature field per day from December 5th to 31st, 1991, on a grid of 73x20x24 points from 0 ø to 360 ø longitude, 0 ø to 76 ø latitude, and level 12 (10 hPa, about 32 km) to level 35 (0.00147 hPa, about 94 km), in altitude.
An algorithm was developed to identify the presence of an inversion in the vertical temperature gradient between the stratopause and level 30 (0.01 hPa). Higher levels are not used, as the inclusion of a significant fraction of climatology in the retrieved profile can sometimes generate spurious inversions. At each 2-D latitude-longitude grid point, the temperature difference Tmax-Tmin between the top and the base of the strongest inversion layer of each profile was calculated. Considering the various sources of uncertainties on the temperature, only inversions with amplitude greater than 12 K are considered significant.
Results and discussion
An examination of the inversion layers seen by ISAMS in the Northern Hemisphere each day of December 1991 shows
that:
1. Inversion layers are present almost every day somewhere in
the hemisphere.
2. Inversion regions seem to exist mostly in a mid-latitude
belt.
3. The amplitude of the inversions often reaches more than 20
K.
4. The horizontal extent of the regions of inversion is
variable,
from 105 to 106 km
2.
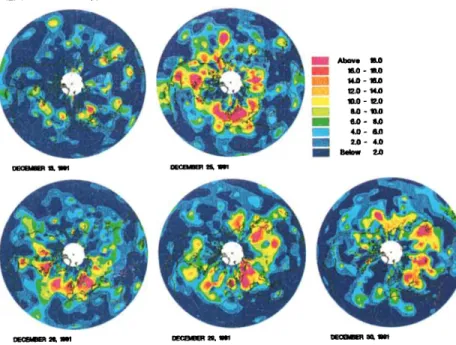
The polar maps of figure 3 show the existence, the position
and amplitude of the inversions during 5 selected days in December. Few inversions are observed the 13th, but many
December 10, 1991 December 11, 1991 December 12, 1991
9 0 "• ... ? ... -.. ... ? ... ..' ... • ... • ... -;::',• ... _.-t.:- '-'z•r ' ":::::" •- 9 0
70
'-..i-'
...
.---•
...
;-?•.es.-..i--
' .•-.
...
-i
.
....
:½.':,.,:!::i
' '.;
.•
i
...
'2.:.}•i-•:,,
i 70
•'60 ---i. -i
...
; ...
•
-, "' -i- - i
i-- .:.
.... • .--i.- i- 60
160 200 240 280 160 200 240 280 160 200 240 280
Temperature (K)
ISAMS: 44øN, 3.3øE ISAMS: 44øN, 358.1øE ISAMS: 44øN, 352.4øE
Figure 2. Comparison between ISAMS profiles and
lidar profiles (Observatoire de Haute Provence, 44øN, 6øE).
LEBLANC ET AL.' MESOSPHERIC
TEMPERATURE
INVERSIONS
1487
Above 18.0 16.0 - 18.0 12.0 - •.0 •.o- •.o 4.0- 6.0 2.0- 4.0 Be•w 2.0Figure 3. Daily mean amplitude
of
mesospheric
temperature
inversions
seen
by ISAMS for five days of
December 1991 (K).
occur
during
the other
days presented.
These
maps
show
the
strong
day to day variability
of the temperature
inversions.
This variability could be due either to the data analysis (existence of a "criteria" which can generate a "threshold
effect" in the research of the inversions), or to physical
processes (strong variability of the gravity waves forcing for
example).
Looking at the last three days of December, we can observe the generation and then the eastward motion of large
inversions. This motion is likely to be due to the eastward advection of the inversions by the mesospheric mean flow, as
we will see later.
The observed scales of the inversions seem to be consistent
with the possible role of gravity waves and their breaking in the mesosphere. This led us to investigate the meteorological situation in the troposphere and stratosphere, where the mean flow can play a very important role for filtering gravity
waves.
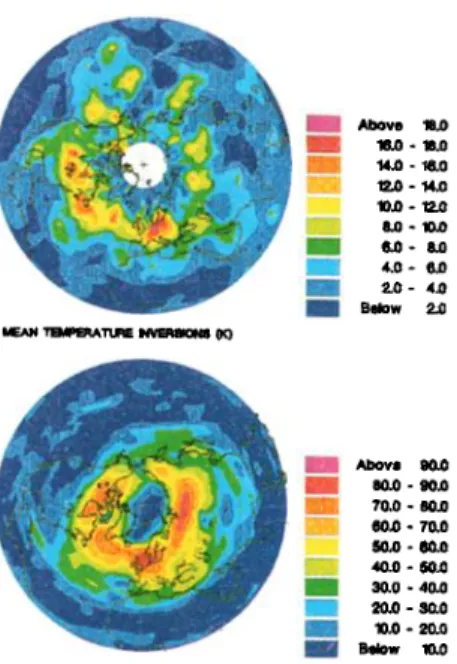
We used the UKMO assimilated winds for the same period,
for the first 22 UARS pressure levels (from the ground to 0.316 hPa). The two maps shown in figure 4 give the monthly mean amplitude of mesospheric inversions and the monthly mean strength of the zonal wind at 1 hPa. The similarity
observed between them seems to confirm the relationship to
the propagation and breaking of gravity waves. A strong westerly jet at this altitude is favourable to the propagation of gravity waves, because there will be no critical level, and
favourable to the efficiency of their breaking just above,
because
friction
on a zonal
mean
flow proportional
is to IU-cl
3
[Lindzen
et al., 1981],
with
lcl<10
ms
-1 for most
orographic
waves.
However, this similarity is not systematic on a day-to-day basis, notably for the smallest inversions. This may be due to the complex role of sources, filtering and breaking of gravity
waves, which cannot be resolved by examination of a simple
assimilated zonal wind field. Moreover, the smallest scales
involved in the theory of gravity wave propagation are not resolved in this global study.
While good
correlation
is observed
between
the inversions
and the 1 hPa wind on the 29th, the data shows less correlation
on the 30th and 31st, in particular the set of inversions above China. This can be explained by the eastward advection of the inversions generated three days before above Central Asia and
not yet eroded
by radiative
transfer
(damping
rate of less than
0.3 day
-1 for perturbations
with vertical
wavelength
of about
20 km at 75 km altitude) [Andrews et al., 1987]. The inversion
layers of smaller amplitude may have shorter life-time due to either shorter damping rates or to the variability of gravity
waves activity.
Finally, inversion
layers can be observed
South of the jet.
We recently developed a 2-D mesoscale (20øN-70øN)
mechanistic model to try to produce inversion layers in mid- latitudes. In this model, a localised drag (about 48øN, 70 km
altitude)
generates
a local 2-D circulation
cell, with adiabatic
Figure 4. Monthly
Mean (December
5th-31st)
amplitude
of
mesospheric
temperature
inversions
seen by ISAMS ans
Conclusion.
MEAN TEMPERATE Ft'VERSlON8
o.o-.o.o
60.0
- 70.0
50.0 - 60.0•.o- •o.o
30.0 - 40.0 •.0 - 30.0 •.0 - 20.0 B•ow 10.0 MEAN PROPAGA• •Figure S. Mean amplitude of temperature inversions seen by ISAMS and propagation index of gravity waves calculated from UKMO winds (December 24th-27th).
heating (respectively cooling) in the southern descending (respectively ascending) branch of the cell. This combined heating and cooling leads to the generation of an inversion layer South of the jet which could explain the occurrence of temperature inversions in mid-latitudes.
These first results, while not explaining the mechanism of generation of mesospheric temperature inversions, show nevertheless that gravity waves may play a role in their characteristics. More investigations, particularly concerning the sources and the upward propagation of gravity waves are necessary. To this end we calculated several very simplified normalised indexes of vertical transmission of orographic waves, to take account of the filtering in the low winds layers, generally at the surface and about 50 hPa. One of these indexes is given, for each day and each point of the longitude-latitude grid, by:
I - Umin.
U•. 100.
Umin U•
where Umi n is the minimum intensity of the wind in the profile, U] the intensity of the wind at 1 hPa, and the asterisk
represents the maximum of these intensifies in the hemisphere
during the given day. Thus, for low minimum winds and low winds at I hPa, the index is near to 0 (total filtering), but for high minimum winds and strong jets at 1 hPa, the index is near to 100 (total transmission and efficiency). Figure 5 shows a good correlation between the amplitude of inversions and the index of transmission during the period of 24th-27th of December. It shows that both the strong jet of the lower
mesosphere and weak winds in the lower stratosphere may
generate a favourable pattern for the propagation of the
gravity waves with a minimum of dissipation, but shows that a
more sophisticated index is necessary to take into account of
all the processes involving gravity waves.
Moreover, the planetary waves, their breaking or their interaction with gravity waves may play an important role in the generation of inversion layers. This question has to be developed in the future.
It is shown in this paper that temperature data provided by
ISAMS aboard UARS are able to provide a global distribution of inversion layers with a quite high degree of confidence. The
temperature
inversions
seem
to occur
frequently,
with variable
amplitude and extent. The limited number of data which have
been treated so far does not allow the complete explanation of
the observed phenomena, but indicates nevertheless that the occurrence of such inversions relates to the circulation pattern in the stratosphere, confirming a possible role of gravity wave filtering. More cases need to be studied using both ground based lidar data and data from ISAMS or other
instruments on board UARS to confirm this relationship and
to find a possible way of predicting the presence of inversions
in the mesosphere.
References:
Andrews, D.G., J.R. Holton, C.B. Leovy, Middle Atmosphere Dynamics, pp70-72, Academic Press, Inc., Orlando, 1987.
Clancy, R.T. and D.W. Rusch, Climatology and trends of mesospheric (58-90 km) temperatures based upon 1982-1986 SME limb scattering profiles, J. Geophys. Res.,94, 3377-3393, 1989.
Dudhia, A., N.J. Livesey and F.W.Taylor, Validation of ISAMS retrievals of atmospheric temperature and pressure, Adv. in Space Res., 14, (9)237-(9)241, 1993.
Dudhia A., S.E. Smith, A.R. Woodand F.W Taylor, Diurnal and semi- diurnal temperature variability of the middle atmosphere, as observed by ISAMS, Geophys. Res. Letters, 20, 1251-1254, 1993. Hauchecorne, A., M.L. Chanin, R. Wilson, Mesospheric temperature
inversion and gravity wave breaking, Geophys. Res. Letters, 14, 933-
936, 1987
Hauchecorne, A., A. Maillard, A 2-D dynamical model of mesospheric temperature inversions in winter, Geophys. Res. Letters, 17, 2197-
2200, 1990
Lindzen, R.S.., Turbulence and stress owing to gravity wave and tidal breakdown, J. Geophys. Res., 86, 9707-9714, 1981.
Rodgers, C.D., Characterization and Error Analysis of profiles Retrieved From Remote Sounding Measurements, J. Geophys. Res.,
95, 5587, 1990.
Schmidlin, F.J., Temperature inversions near 75 km, Geophys. Res.
Letters, 3, 173-176, 1976.
Shepard, D., A two dimensional interpolation function for irregulary spaced data, Proc. 23rd Nat. Conf. ACM, Brandon/Systems Press
Inc., Princeton, 517-523, 1968.
Taylor, F.W., C.D. Rodgers, J.G.Whitney, S.T. Werrett, J.J. Barnett, G.D. Peskett, P. Venters, J. Ballard,C.W.P. Palmer, R.J. Knight, P.J. Morris and T.J. Nightingale, Remote sensing of atmospheric structure and composition by pressure modulator radiometry from space: the ISAMS experiment on UARS,J. Geophys. Res., 98, 10799-10814,
1993.
M. L. Chanin, Service d'Atronomie du CNRS, BP3, 91371 Verfi•res-
le-Buisson Cedex, France. (e-mail: [email protected])
A. Hauchecorne, Service d'Atronomie du CNRS, BP3, 91371
Verfi•res-le-Buisson Cedex, France. (e-mail: [email protected]) Thierry Leblanc, Service d'Atronomie du CNRS, B P3, 91371 Verfi•res-le-Buisson Cedex, France. (e-mail: [email protected])
N., J. Livesey, Atmospheric Oceanic and Planetary Physics, Oxford University, Parks Road, Oxford OX1 3PU, U.K.
C. D. Rodgers, Atmospheric Oceanic and Planetary Physics, Oxford University, Parks Road, Oxford OX1 3PU, U.K.
F. W. Taylor, Atmospheric Oceanic and Planetary Physics, Oxford
University, Parks Road, Oxford OX1 3PU, U.K.
(Received: August 12, 1994; revised October 17, 1994; Accepted