HAL Id: hal-00304238
https://hal.archives-ouvertes.fr/hal-00304238
Submitted on 6 Jun 2008HAL is a multi-disciplinary open access
archive for the deposit and dissemination of sci-entific research documents, whether they are pub-lished or not. The documents may come from teaching and research institutions in France or abroad, or from public or private research centers.
L’archive ouverte pluridisciplinaire HAL, est destinée au dépôt et à la diffusion de documents scientifiques de niveau recherche, publiés ou non, émanant des établissements d’enseignement et de recherche français ou étrangers, des laboratoires publics ou privés.
Attribution of aerosol light absorption to black carbon,
brown carbon, and dust in China ? interpretations of
atmospheric measurements during EAST-AIRE
M. Yang, S. G. Howell, J. Zhuang, B. J. Huebert
To cite this version:
M. Yang, S. G. Howell, J. Zhuang, B. J. Huebert. Attribution of aerosol light absorption to black carbon, brown carbon, and dust in China ? interpretations of atmospheric measurements during EAST-AIRE. Atmospheric Chemistry and Physics Discussions, European Geosciences Union, 2008, 8 (3), pp.10913-10954. �hal-00304238�
ACPD
8, 10913–10954, 2008 Separation and attribution of aerosol absorption M. Yang et al. Title Page Abstract Introduction Conclusions References Tables Figures ◭ ◮ ◭ ◮ Back CloseFull Screen / Esc
Printer-friendly Version Interactive Discussion
Atmos. Chem. Phys. Discuss., 8, 10913–10954, 2008 www.atmos-chem-phys-discuss.net/8/10913/2008/ © Author(s) 2008. This work is distributed under the Creative Commons Attribution 3.0 License.
Atmospheric Chemistry and Physics Discussions
Attribution of aerosol light absorption to
black carbon, brown carbon, and dust in
China – interpretations of atmospheric
measurements during EAST-AIRE
M. Yang, S. G. Howell, J. Zhuang, and B. J. Huebert
Department of Oceanography, University of Hawaii, Honolulu, Hawaii, USA Received: 4 March 2008 – Accepted: 9 May 2008 – Published: 6 June 2008 Correspondence to: M. Yang ([email protected])
ACPD
8, 10913–10954, 2008 Separation and attribution of aerosol absorption M. Yang et al. Title Page Abstract Introduction Conclusions References Tables Figures ◭ ◮ ◭ ◮ Back CloseFull Screen / Esc
Printer-friendly Version Interactive Discussion
Abstract
Black carbon, brown carbon, and mineral dust are three of the most important light absorbing aerosols. Their optical properties differ greatly and are distinctive functions of the wavelength of light. Most optical instruments that quantify light absorption, how-ever, are unable to distinguish one type of absorbing aerosol from another. It is thus
5
instructive to separate total absorption from these different light absorbers to gain a better understanding of the optical characteristics of each aerosol type. During the EAST-AIRE (East Asian Study of Tropospheric Aerosols: an International Regional Ex-periment) campaign near Beijing, we measured light scattering using a nephelometer, and light absorption using an aethalometer and a particulate soot absorption
photome-10
ter. We also measured the total mass concentrations of carbonaceous (elemental and organic carbon) and inorganic particulates, as well as aerosol number and mass distri-butions. We were able to identify periods during the campaign that were dominated by dust, biomass burning, fresh (industrial) chimney plumes, other coal burning pollution, and relatively clean (background) air for Northern China. Each of these air masses
15
possessed distinct intensive optical properties, including the single scatter albedo and ˚
Angstrom exponents. Based on the wavelength-dependence and particle size distri-bution, we apportioned total light absorption to black carbon, brown carbon, and dust; their mass absorption efficiencies at 550 nm were estimated to be 9.5, 0.5, and 0.03 m2/g, respectively. While agreeing with the common consensus that BC is the most
20
important light absorber in the mid-visible, we demonstrated that brown carbon and dust could also cause significant absorption, especially at shorter wavelengths.
1 Introduction
Aerosols scatter and absorb shortwave solar radiation, generally resulting in cooling and warming of the planet, respectively, if the two phenomena are treated
indepen-25
ACPD
8, 10913–10954, 2008 Separation and attribution of aerosol absorption M. Yang et al. Title Page Abstract Introduction Conclusions References Tables Figures ◭ ◮ ◭ ◮ Back CloseFull Screen / Esc
Printer-friendly Version Interactive Discussion
in the atmosphere (a product of fossil-fuel combustion) are believed to have a net cool-ing effect on the earth’s surface. On the other hand, strongly absorbcool-ing soot carbon aerosols lead to a warming of the planet (Solomon et al., 2007). Other important light absorbing aerosols in the atmosphere include brown carbon and mineral dust.
Aerosol absorption can be represented by the classic Beer-Lambert Law, which
re-5
lates the intensity of incident (I0) and outgoing (I) light by an exponential:
I = I0e−αlc (1)
where α is the absorption cross section, l is the path length, and c is the concen-tration. The product of α and c in the exponent is defined as the absorption coeffi-cient (bap), which can be measured by in-situ instruments such as the aethalometer
10
in units of inverse length. If c represents the mass concentration of absorbing par-ticles (e.g.µg/m3), α is then the mass absorption cross-section, or mass absorption efficiency (MAE), often in units of m2/g; MAE can vary greatly depending on the type of light absorbers. Analogously, the scattering coefficient (bsp) is the product of the
scat-tering cross section and the concentration of scatscat-tering particles. Since all aerosols
15
scatter light, scattering coefficient is often used as a proxy for particle concentration. The fraction of light extinction (sum of scattering and absorption) due to scattering is defined as the single scatter albedo (ω0, or SSA) – an intensive property determined by the particle composition while independent of the total aerosol concentration:
ω0= bsp/(bap+ bsp) (2)
20
The single scatter albedo is an important factor in controlling whether an aerosol layer has a cooling or warming effect. Non-absorbing particles (e.g. ammonium sulfate) have ω0of unity, whereas a lowerω0implies more absorption.
Aerosols scatter and absorb light differently depending on the particle size (Dp)
rel-ative to the wavelength of light (λ). For a given aerosol composition (which determines 25
the refractive index), the Mie scattering theory can be used to approximate the amount of scattering and absorption whenDpandλ are known, assuming the particle is spher-ical. Since most atmospheric aerosols are small, their absorption tends to be higher
ACPD
8, 10913–10954, 2008 Separation and attribution of aerosol absorption M. Yang et al. Title Page Abstract Introduction Conclusions References Tables Figures ◭ ◮ ◭ ◮ Back CloseFull Screen / Esc
Printer-friendly Version Interactive Discussion
near the ultraviolet (UV) than near the infrared (IR). Absorption is often parameterized as proportional toλ−A˚, where the exponent, ˚A, is the absorption ˚Angstrom exponent. An analogous expression can be written for the wavelength-dependence of scattering. Soot carbon, or combustion-generated carbonaceous aerosol that absorbs light strongly over the entire visible spectrum, is traditionally viewed as the most
impor-5
tant light absorber for solar radiation (Hansen et al., 1984; Penner et al. 1993). Soot is monitored either optically or chemically. The optical method relies on light absorption; the corresponding operational definition for soot is black carbon (BC). The chemical (thermal) method measures the mass concentration of total carbon, in which the por-tion that is refractory and does not volatilize below ∼400◦C in air is termed elemental
10
carbon (EC) (Birch and Cary, 1996); the volatile portion is assumed to be organic car-bon (OC). Since BC and EC refer to somewhat different fractions of absorbing carcar-bon, distinctions in these operational definitions need to be carefully considered when re-lating optical and chemical measurements of soot, such as when calcure-lating the mass absorption efficiency.
15
Freshly emitted soot particles from combustion have graphite-like sheet structures that fold among themselves to form agglomerates of primary spherules around 20 nm in diameter (Bond and Bergstrom, 2006), which shortly after emission coagulate and form loose aggregates. Because they are usually small, soot particles fit within the Rayleigh scattering regime for near-visible wavelengths. In this regime, absorption
20
follows a theoretical λ−1 relationship, implying a wavelength-independent imaginary component of the refractive index; this for soot is supported by the Band-gap theory (Bond and Bergstrom, 2006). Many laboratory observations have shown that soot has an absorption ˚Angstrom exponent of one in the solar spectrum (Bergstrom et al., 2002; Schnaiter et al., 2003; Kirchstetter et al., 2004). Previous experiments from
25
our group also demonstrated that within the range measured by the seven-wavelength aethalometer (370 to 950 nm), ˚A≈1 was obtained when fitting absorption with a power law for air masses dominated by soot carbon (Kline et al., 2004).
ACPD
8, 10913–10954, 2008 Separation and attribution of aerosol absorption M. Yang et al. Title Page Abstract Introduction Conclusions References Tables Figures ◭ ◮ ◭ ◮ Back CloseFull Screen / Esc
Printer-friendly Version Interactive Discussion
∼30% as a result of aggregation from singular primary spherules (Fuller et al., 1999), possibly due to the effect of multiple scattering. Bond and Bergstrom (2006) amassed literature results and recommended a mass absorption efficiency of 7.5±1.2 m2/g for fresh soot aggregates at 550 nm. Other aerosols can also be externally or internally mixed with soot. Fuller et al. (1999) and Bond et al. (2006) have shown that a
com-5
plete encapsulation of a soot core with non-absorbing organic or inorganic conden-sates might result in an absorption enhancement of up to 30∼50%.
More recently, carbonaceous particles that are optically in between the strongly ab-sorbing soot carbon and non-abab-sorbing organic carbon have also been shown to be significant, and they are operationally defined as brown carbon. Formed by inefficient
10
combustion of hydrocarbons (e.g. smoldering) and also by photo-oxidation of biogenic particles, brown carbon encompasses a large and variable group of organic com-pounds, and may include humic substances, polyaromatic hydrocarbons, and lignin (Andreae and Gelencser, 2006). Due to the presence of resonant ring structures, most absorption by brown carbon takes place in the UV, though the lowered bond energy
15
of the conjugated bonds causes a tail of absorption in the short visible wavelengths. Consequently, the absorption ˚Angstrom exponent of brown carbon is larger than that of soot.
Thus far, published absorption efficiencies and ˚Angstrom exponents for “brown car-bon” have been inconsistent. Hoffer et al. (2006) extracted humic-like substances
20
(HULIS) with water from the fine fraction of biomass burning aerosols and found an absorption ˚Angstrom exponent of 6∼7 and a mass absorption efficiency of ∼0.03 m2/g at 532 nm. Kirchstetter and Novakov (2004) isolated organic carbon with acetone and found mass absorption efficiencies of 0.9 m2/g at 500 nm and 0.6 m2/g at 550 nm for the extract ( ˚A>4 over this short range of wavelengths). Clarke et al. (2007) isolated 25
“refractory organic carbon” from biomass burning aerosols with a thermal method and approximated brown carbon absorption as the difference between total and extrapo-lated BC absorption; from these estimates they obtained mass absorption efficiencies of 0.52 m2/g at 470 nm and 0.19 m2/g at 530 nm ( ˚A>8 over this short range of
wave-ACPD
8, 10913–10954, 2008 Separation and attribution of aerosol absorption M. Yang et al. Title Page Abstract Introduction Conclusions References Tables Figures ◭ ◮ ◭ ◮ Back CloseFull Screen / Esc
Printer-friendly Version Interactive Discussion
lengths). It is unsurprising to see such discrepancies in literature results because a variety of aerosols were measured using several different techniques, with each de-rived concentration and light absorption corresponding to a different fraction of car-bonaceous particles.
Optical properties of eolian dust aerosols are determined by their mineralogical
5
origins as well as physical modifications once airborne. Ferric iron oxides such as hematite and goethite, when internally mixed with clay minerals, result in significant dust absorption in the UV/visible (Sokolik and Toon, 1999). As with brown carbon, dust absorption in the solar spectrum decreases rapidly with increasing wavelength. Alfaro et al. (2004) found that for Gobi (China), Sahara (Tunisia), and Sahel (Niger)
10
dust, the mass absorption efficiencies ranged from 0.01∼0.02 m2/g at 660 nm and 0.06∼0.12 m2/g at 325 nm ( ˚A≈3 over this range), while an absorption ˚Angstrom ex-ponent of 2.6 can be calculated from the report of Fialho et al. (2006).
Particles generated from diesel combustion are conventionally used as the labora-tory surrogate for black carbon. Much less is known about coal-burning aerosols, even
15
though coal combustion accounts for roughly half of the BC in the atmosphere (Bond et al., 2002). The EAST-AIRE campaign in 2005 provided us an opportunity to study the optical and chemical properties of, among others, coal-derived aerosols, which are ubiquitous in much of China and other developing countries. Since coal generally con-tains more impurities and water than diesel fuel does, we expect the combustion of
20
coal, particularly in residential usage, to be less efficient and more incomplete than the combustion of higher-grade fossil fuels. Consequently, a significant amount of brown carbon might be generated, which is less absorbing than BC per unit mass but has a greater absorption ˚Angstrom exponent. A high wavelength-dependence in absorption might also indicate the presence of dust. The broad spectrum of our aethalometer (370
25
to 950 nm) enables us to closely examine these wavelength dependences.
Ambient aerosol absorption is often normalized by the concentration of EC to approx-imate the EC mass absorption efficiency. While this approach might be valid in areas dominated by fresh soot emission, dividing total absorption by the soot concentration
ACPD
8, 10913–10954, 2008 Separation and attribution of aerosol absorption M. Yang et al. Title Page Abstract Introduction Conclusions References Tables Figures ◭ ◮ ◭ ◮ Back CloseFull Screen / Esc
Printer-friendly Version Interactive Discussion
is misleading when other light-absorbers are also present. In those more complex en-vironments, if we can separate and attribute total light absorption to different absorbing aerosols, given their respective mass concentrations, we can calculate MAE specific to each aerosol type present.
2 Experimental
5
EAST-AIRE took place in part between 2 March and 26 March 2005 at the Institute of Atmospheric Physics (IAP) research facility ∼2 km east of Xianghe, China (Li et al., 2007). About 70 km east of Beijing, our site was heavily polluted due to both local and distant sources of fossil fuel combustion, vehicular and industrial emissions, and also occasional dust and biomass fires. While coal burning was technically forbidden in the
10
town of Xianghe, nearby residences and a number of small factories neighboring the IAP facility used coal. The boiler of the IAP facility itself burned coal also; a cyclone was installed to remove large particles – an implementation that most other boilers lacked. We could see over 20 active chimneys in all directions from our sampling site. Direct plumes from these chimneys almost always contained particle number concentrations
15
over 104cm−3. Given the density and proximity of sources, back-trajectories to identify specific emissions were not attempted.
The ambient temperature was around 0◦C at the start of the campaign and warmed up to ∼20◦C towards the end. The air was very dry, with a campaign average relative humidity below 40%. Due to its inland geographical location, there was no observable
20
marine influence. Brisk winds (∼10 m/s) usually came from the west/northwest (the direction of Beijing and distant mountain ranges), which brought along relatively clean air and occasionally mineral dust particles. In contrast, much gentler winds from the southeast (the direction of Xianghe town) carried the highest levels of air pollutants. The air was often particularly dirty in the morning when the winds were weak and the
25
inversion layer was low, as emissions from anthropogenic activities including morning traffic, cooking, and heating were trapped near the ground. Sometimes a second (and
ACPD
8, 10913–10954, 2008 Separation and attribution of aerosol absorption M. Yang et al. Title Page Abstract Introduction Conclusions References Tables Figures ◭ ◮ ◭ ◮ Back CloseFull Screen / Esc
Printer-friendly Version Interactive Discussion
somewhat smaller) peak in atmospheric pollutants was also observed in the evening traffic and cooking hours.
A number of different aerosol types are generated from coal combustion, including BC, fly ash (condensed silicates), and unburned coal ash. Brown carbon can also be produced as a result of incomplete combustion (Bond et al., 2002) – a likelihood that
5
was supported by our observation of yellowish smoke from some nearby chimneys. The production of brown carbon might have been enhanced since in many households, furnaces are partially choked on purpose to moderate temperature and prolong burning time (personal experience). While large heating systems usually employ chunks of coal that are unmodified, for residential cooking and heating, honeycomb coal briquettes are
10
preferred because they burn more predictably and produce less smoke. Coal briquettes are made by first binding powdered coal with clay when wet; the mixture is then molded into cylinders with many cylindrical cavities, resembling a honeycomb. After the coal is burned off, briquettes retain their structural integrity and appear orange in color, suggesting that the clay binder contains ferric oxides. Filter from our OCEC carbon
15
aerosol analyzer that were exposed to coal-dominated pollution for ∼12 h appeared to have the same orange color after thermal analysis as burned coal briquettes. It is possible that such iron-rich clay materials can be liberated from the briquette matrix as coarse, light absorbing aerosols. The emission of light absorbing particles other than BC might be the cause for the wide range of absorption ˚Angstrom exponents observed
20
for coal-derived aerosols (1–2.9, Bond et al., 2002). 2.1 Absorption and scattering measurements
We used a Radiance Research (Seattle, WA) Particle Soot Absorption Photometer (PSAP) that recorded absorption at a single wavelength (567 nm) every 5 s and a TSI (St. Paul, MN) Model 3563 integrating nephelometer that recorded scattering at
25
450, 550, and 700 nm every second. The PSAP and the nephelometer shared an impactor that switched from submicron particle sampling to total particle sampling ev-ery 10 min. We adjusted raw scattering coefficients from the nephelometer for angular
ACPD
8, 10913–10954, 2008 Separation and attribution of aerosol absorption M. Yang et al. Title Page Abstract Introduction Conclusions References Tables Figures ◭ ◮ ◭ ◮ Back CloseFull Screen / Esc
Printer-friendly Version Interactive Discussion
truncation according to Anderson and Ogren (1998). Due to the high particle concen-tration, changing the PSAP filter every time the transmission dropped below 70% (as recommended by Bond et al., 1999) was often not possible. Instead, we opted for a filter change whenever the transmission was near 50%; absorption measurements when the corresponding transmission levels dropped below 50% were later discarded.
5
We corrected our raw absorption coefficients from the PSAP to 550 nm for loading, apparent absorption, and multiple scattering artifacts according to Bond et al. (1999).
By alternating between total and submicron sampling with an impactor, we were able to look at PSAP absorption and nephelometer scattering for fine and coarse (total - fine) particles separately. To generate a continuous time-series of total scattering, the
10
ratio of total to submicron scattering determined from adjacent segments was applied to each submicron scattering segment. Complete times-series of submicron scattering and total/submicron PSAP absorption were generated analogously.
To cover a greater range of wavelengths than the PSAP, we used a Magee Scientific (Berkley, CA) AE31 aethalometer to record absorption sequentially at 370, 470, 520,
15
590, 660, 880, and 950 nm in 2-min cycles. The aethalometer was operating in an automated mode, under which the filter tape advances when the attenuation at 370 nm reaches 75. The flow rate of the aethalometer was kept near the lower limit required by the instrument (∼1.2 LPM) due to the high concentration of particles.
Following calibration schemes from Bond et al. (1999), Weingartner et al. (2003),
20
and Arnott et al. (2005), we corrected absorption coefficient from the aethalometer for the loading artifact of absorbing particles, apparent absorption by purely scattering particles, and multiple scattering by the filter matrix using the following equation:
bap(t, λ) = (baeth(t, λ) − Faa(λ) · bsp(t, λ))
Fload(t, λ)
Fms(λ)
(3)
At a given time (t) and wavelength (λ), the corrected absorption coefficient (bap) is
25
related to raw absorption coefficient from the aethalometer (baeth) by three wavelength-dependent correction factors. Faais the apparent absorption correction factor adopted
ACPD
8, 10913–10954, 2008 Separation and attribution of aerosol absorption M. Yang et al. Title Page Abstract Introduction Conclusions References Tables Figures ◭ ◮ ◭ ◮ Back CloseFull Screen / Esc
Printer-friendly Version Interactive Discussion
from Arnott et al. (2005). Fms is the multiple scattering correction factor taken from Weingartner et al. (2003) for coated soot.
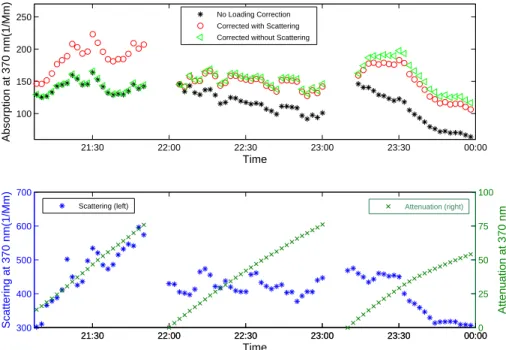
To developFload, the loading correction factor, we first followed the parameterization from Weingartner et al. (2003) and assumed that raw absorption coefficient from the aethalometer is linearly related to the log of attenuation (ATN). When the filter tape gets
5
heavily loaded, ATN correspondingly increases while baeth artificially decreases until the next tape advancement, resulting in discontinuities across filter changes usually observed when the aerosols are relatively constant (e.g. at ∼23:00 in Fig. 1). On time-scales of minutes, variability in ambient absorption is mostly due to concentration change (driven by atmospheric dynamics) rather than composition change (driven by
10
chemistry) in the aerosols. We can remove much of the variability in absorption by taking into account the change in concurrent scattering from the nepheometer (bsp). By assuming that the remaining variability in absorption (due to aerosol composition change) is negligible (i.e. constant ω0) on short time-scales, we can then apply the proportionality betweenbaeth and Ln(ATN):
15
Fload(t, λ) = (Rf(λ) − 1)Ln(AT N(t, λ))−Ln(AT N(A, λ))
Ln(AT N(B, λ))−Ln(AT N(A, λ)) (4)
Here A and B designate the first point after an aethalometer tape advancement and the last point before that advancement, respectively. At a given wavelength,Rf is
de-fined asRa/Rs, whereRa=baeth(A)/baeth(B) and Rs=bsp(A)/bsp(B). Scattering from the
nephelometer was fitted to the seven wavelengths of the aethalometer using the
scat-20
tering ˚Angstrom exponent, which was determined from the slope of log(bsp) vs. log(λ). A loading correction without taking scattering into account (i.e. forcing baeth(A) and baeth(B) to be the same) is only valid when the aerosols are completely non-changing and should not be applied to ambient measurements (e.g. at ∼22:00 in Fig. 1). The quality of Eq. (4) was assessed by plotting the respectivebap/bap(A) against Ln(ATN),
25
which resulted in a largely ATN-independent ratio of unity on a campaign average. Please refer to Yang (2007) for a much more detailed description of the aethalometer correction and also a comparison of this correction scheme to ones previously
pub-ACPD
8, 10913–10954, 2008 Separation and attribution of aerosol absorption M. Yang et al. Title Page Abstract Introduction Conclusions References Tables Figures ◭ ◮ ◭ ◮ Back CloseFull Screen / Esc
Printer-friendly Version Interactive Discussion
lished. Corrected absorption from the aethalometer adjusted to 550 nm by the absorp-tion ˚Angstrom exponent showed excellent agreement with absorption from the PSAP (within 5%).
2.2 Elemental and organic carbon measurements
We measured elemental carbon and organic carbon using a Sunset Laboratory Inc.
5
(Forest Grove, OR) Semi-continuous OCEC Carbon Aerosol Analyzer. Samples were collected and analyzed hourly, except 07:00—08:00 and 19:00—20:00, when filters were changed and calibrations were run. They started on the hour and lasted 40 min, allowing 20 min for analysis. A passive diffusion denuder was placed before the OCEC instrument to remove any vapor-phase organic carbon. The instrument volatilizes
par-10
ticulate carbon thermally and oxidizes it to carbon dioxide (CO2), which is monitored by a non-dispersive infrared (NDIR) detector. Since a portion of OC is charred to an absorbing EC-like material instead being directly oxidized to CO2, the instrument relies on the change in transmission of a laser through the filter to account for the pyroly-sis of (originally) non-absorbing OC. The split-point between EC and OC is defined
15
as the time when the laser transmission returns to its initial level (after the charred material is burnt off). This determination of the split-point is based on the assumption that non-native and native EC have the same thermal stability and optical properties, which might not be true if any liquid-like brown carbon was present (Subramanian et al., 2007). Interested readers may refer to Huebert et al. (2004) and Kline et al. (2004) for
20
more discussions on combustion stages, blanking procedures, and the determination of the split-point.
We also obtained size-segregated concentrations of EC and OC from an MSP (Min-neapolis, MN) Micro-orifice Uniform Deposit Impactor (MOUDI) during selected twelve-hour intervals. The MOUDI was set to collect particles at a flow rate of 30 L/min on nine
25
successive impactor stages. Those nine stages consisted of aluminum substrates, while a backup quartz filter in the collected the smallest particles. The aerodynamic size-cuts were 18, 10, 6.2, 3.1, 1.8, 1.0, 0.56, 0.30, 0.17, and 0.05 um, where the
ACPD
8, 10913–10954, 2008 Separation and attribution of aerosol absorption M. Yang et al. Title Page Abstract Introduction Conclusions References Tables Figures ◭ ◮ ◭ ◮ Back CloseFull Screen / Esc
Printer-friendly Version Interactive Discussion
first is a crude approximation for the inlet size, and the last is an arbitrary number for the backup filter. Particles collected on each stage were then analyzed by a similar Sunset Lab OCEC procedure, as batch samples. Because the aluminum substrate is not transparent to the OCEC laser, the split-point between OC and EC from the laser transmission could not be obtained directly for the first nine stages; instead only total
5
carbon (EC + OC) was outputted. The final quartz filter is transparent to the laser; from that we determined the split-point between OC and EC as above and assigned it to the preceding aluminum stages, assuming that carbonaceous particles of different sizes evolve under the same temperatures. We also checked split-points obtained di-rectly from the Sunset lab semi-continuous OCEC analyzer at concurrent times as the
10
MOUDI; the semi-continuous instrument generally yielded comparable splits. 2.3 Inorganic particulate measurements
Every three hours, we collected particles on a 47 mm diameter Savilex Teflon filter at a flow rate of ∼20 SLPM for the first two hours and 40 min (except the 05:00 to 06:40 and 17:00 to 18:40 samples that were over an hour and 40 min). After drying and
15
weighing for the gravimetric mass, filters were extracted with water and concentrations of sodium (Na+), potassium (K+), chloride (Cl−), sulfate (SO2−4 ), nitrate (NO−3), oxalate ((COO)2−2 ), calcium (Ca2+), magnesium (Mg2+), and ammonium (NH+4) were measured by ion chromatography. Analytical details can be found in Kline et al. (2004).
2.4 Particle number measurements
20
We measured the size-distributed particle number concentration with a TSI Aerody-namic Particle Sizer (APS) every 20 s. The APS separates aerosols according to their aerodynamic (flow) diameters between ∼0.5 and ∼20 um (Ananth and Wilson, 1988). However, the sizing and detecting efficiencies are relatively poor below ∼0.7 um, while significant particle loss from the inlet to the detector limits its sampling efficiency for
25
den-ACPD
8, 10913–10954, 2008 Separation and attribution of aerosol absorption M. Yang et al. Title Page Abstract Introduction Conclusions References Tables Figures ◭ ◮ ◭ ◮ Back CloseFull Screen / Esc
Printer-friendly Version Interactive Discussion
sity) particles, we first applied an empirical Stokes correction according to the APS manual, and then converted aerodynamic diameters to (equivalent) geometric diam-eters by dividing by the square root of an estimated effective density. We used an effective density of 2.0 g cm−3, which is lower than the likely actual dust density of 2.6 g cm−3. Size-distributed aerosol number concentrations were converted to volume
5
concentrations using these derived geometric diameters; mass concentrations were then calculated from volume using the likely density.
The total particle number concentration was measured by a TSI Condensation Par-ticle Counter 7610 (CPC) every second.
2.5 Other available measurements
10
Basic meteorological measurements were made at a tower ∼75 m away from the IAP building every 10 min at five levels (2, 4, 8, 16, and 32 m above ground). Our inlets on the roof of the IAP building corresponded to a height between 16 and 32 m.
Russell Dickerson’s group from the University of Maryland measured gas concen-trations of carbon monoxide (CO), nitric oxide (NO), reactive odd nitrogen (NOy), and
15
sulfur dioxide (SO2) on 10-min intervals.
3 Results
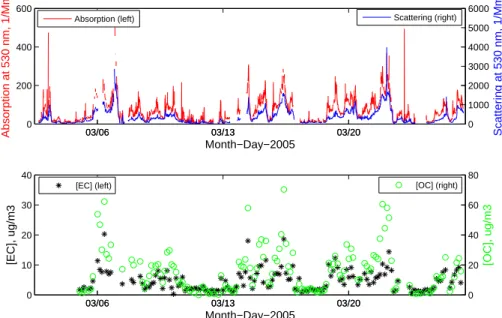
In general, atmospheric dynamics can account for most of the observed variability in aerosol concentrations. Correlation coefficients calculated between any pairs of gaseous and/or particulate species were almost always greater than 0.6. For species
20
closely related in origin, such as between OC and EC, the correlation was close to 0.9. Figure 2 shows the time-series of aethalometer absorption coefficients and neph-elometer scattering coefficients at 520 nm (10-min averages, top panel) and EC and OC concentrations (3-h averages, bottom panel).
To examine aerosols in Xianghe over the course of an average day, we binned our
ACPD
8, 10913–10954, 2008 Separation and attribution of aerosol absorption M. Yang et al. Title Page Abstract Introduction Conclusions References Tables Figures ◭ ◮ ◭ ◮ Back CloseFull Screen / Esc
Printer-friendly Version Interactive Discussion
measurements to the 24 h of a day (Fig. 3). We saw a bimodal distribution for most extensive variables, including absorption, scattering, and concentrations of OC and EC. The single scatter albedo was the lowest and the absorption ˚Angstrom was the closest to one at times when extensive properties peaked, confirming that soot carbon was one of the principal aerosols emitted from morning and evening cooking and traffic
5
emissions.
3.1 Identification of end-member air masses
During our three weeks of sampling in Xianghe, we encountered air dominated by fresh chimney plumes, other coal-burning emissions, and occasional biomass burning and dust aerosols, often at separate times. Based on chemical, optical, and particle size
10
measurements, we identified periods when each type of air mass was prevalent. A series of criteria was developed to classify each of these air mass types. Most criteria were of intensive or intrinsic characteristics of the aerosols and do not depend on abso-lute concentrations. The concentration of carbon monoxide (CO), a relatively long-lived gas (lifetime of months, Novelli et al., 1992), was usually used to normalize the
con-15
centration of the species of interest to minimize the influence of atmosphere dynamics and dilution. To stay consistent with our impactor for the PSAP and nephelometer, we defined one micron as the cut-off diameter between fine and coarse particles for the APS. Whenever possible, we tried not to use the ˚Angstrom exponent and single scatter albedo in our air mass identification scheme, since our goal was to determine ˚A and 20
ω0(λ) for each air mass type. In general for each criterion, to exclude mixed air masses, we looked for maxima or minima one standard deviation or more away from the me-dian. The median was preferred over the mean here, because the latter tended to be influenced more by sudden and extreme variations. For each type of air mass, multiple criteria needed to be met at the same time in order for the identification to be valid; if
25
one or more of the exclusions were violated, the air mass was no longer deemed an end-member. The classification scheme is summarized in Table 1.
ACPD
8, 10913–10954, 2008 Separation and attribution of aerosol absorption M. Yang et al. Title Page Abstract Introduction Conclusions References Tables Figures ◭ ◮ ◭ ◮ Back CloseFull Screen / Esc
Printer-friendly Version Interactive Discussion
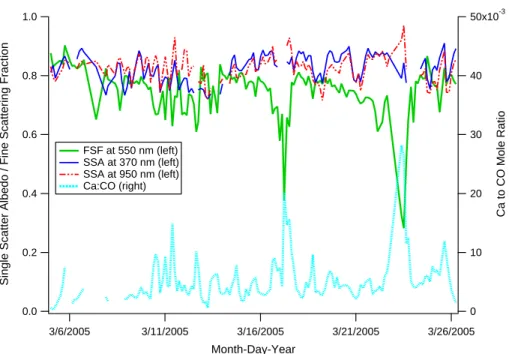
of the major components of these coarse particles (Arimoto et al., 2004). High Ca:CO ratios corresponded nicely with low fine scattering fraction (FSF, or the fraction of total scattering due to submicron particles from the nephelometer), as shown in Fig. 4. Low coarse number fraction (total supermicron particle number from the APS divided by the CPC count) andω0 were excluded since both imply a combustion source for the
5
aerosols.
A widely used proxy for biomass burning aerosols is soluble potassium. Yet our potassium peaks did not correspond to any observed biomass burning events, possibly because sporadic agricultural fires reached our site for usually only a few minutes at a time. Those relatively weak and short-lived signals could easily be obscured in the
10
3-h filter samples. Instead, we looked for high single scatter albedo at 550 nm around occasions when we observed field fires upwind, which tended to give out whitish smoke and raiseω0when reaching our inlets. Previous studies also suggested that aerosols from biomass burning are characterized by relatively high single scatter albedo in the mid-visible (Kaufmann et al., 1992; Penner et al., 2001). Since mineral dust could also
15
have highω0at 550 nm, periods already classified as dust were not double-counted as biomass burning.
Rapidly varying chimney plumes from nearby sources were of interest because fresh emissions from these industrial boilers (likely burning diesel oil or coal) are expected to resemble “pure” soot the most. While NO and CO are both byproducts of fossil fuel
20
combustion, NO has a very short life time in the atmosphere (hours) and its concen-tration is expected to fall off more quickly away from the source of combustion than the more stable CO. Classification based on this criterion was consistent with our visual and olfactory observations of chimney plumes, especially at low wind speeds.
In addition to fresh chimney plumes, there were very often long-lasting periods with
25
constantly high levels of coal burning pollution, which likely originated from residen-tial heating and cooking and distant smokestacks. Under stagnant conditions, these highly absorbing pollutants accumulated to very high levels. We looked for a very high SO2:CO2 ratio because SO2 is one of the principal gases emitted from coal burning
ACPD
8, 10913–10954, 2008 Separation and attribution of aerosol absorption M. Yang et al. Title Page Abstract Introduction Conclusions References Tables Figures ◭ ◮ ◭ ◮ Back CloseFull Screen / Esc
Printer-friendly Version Interactive Discussion
and has a much shorter lifetime than CO. Coal-derived emissions from this project generally had a relatively lowω0 and an abundance of large particles, though neither was used as a criterion.
To identify background air, we decided to simply look for times that were low in scat-tering instead of using intensive properties. A high wind speed was chosen because
5
strong winds often dissipated local pollution. We discarded times when the coarse volume fraction (fraction of total aerosol volume due to supermicron particles from the APS) was greater than 0.94 as a way to avoid double counting with mineral dust, which had already been categorized.
3.2 Optical characteristics of end-member air masses
10
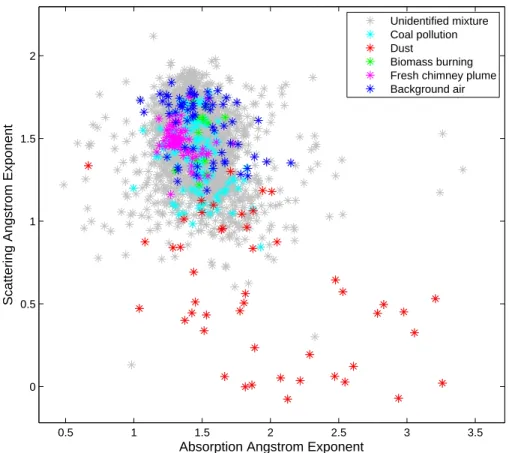
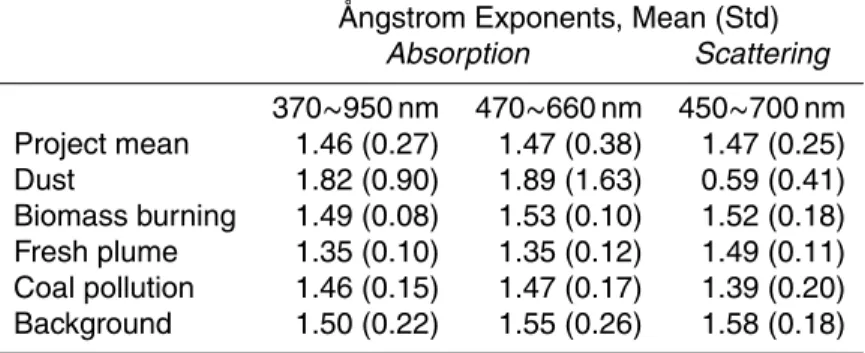
Figure 5 shows the distinct ˚Angstrom exponents in absorption and scattering for these identified end-member air masses. The scattering ˚Angstrom is usually inversely corre-lated with particle size, while a high absorption ˚Angstrom exponent implies the pres-ence of light absorbing aerosols other than BC, such as dust and brown carbon.
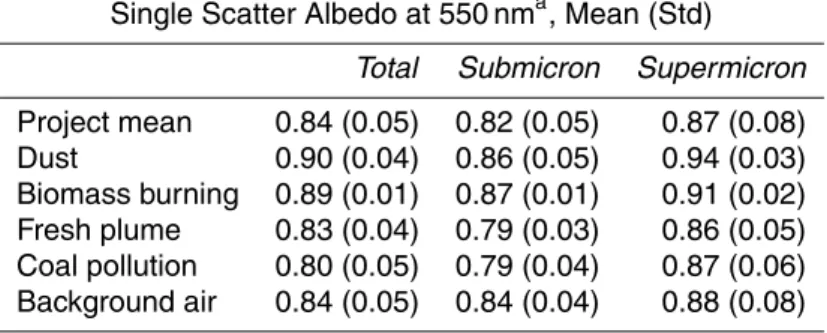
The means and standard deviations (in parenthesis when appropriate) of the single
15
scatter albedo for the entire project and also for end-member air masses are sum-marized in Table 2. Total absorption from the aethalometer and scattering from the nephelometer were used in the calculations in 2a, whereas absorption from the PSAP and scattering from the nephelometer were separated into fine and coarse modes in 2b. The submicron and supermicronω0averaged to 0.82 and 0.87 at 550 nm,
bracket-20
ing that of total aerosols. As expected, submicronω0 was lower than supermicronω0 because most of the absorption was due to fine mode carbonaceous aerosols. From uncertainties in the nephelometer scattering (∼7%, mostly due to the truncation correc-tion) and in the aethalometer absorption (19∼26% from 370 to 950 nm, mostly due to the multiple scattering correction), we estimated the uncertainties of the single scatter
25
albedo to be about 0.03. This uncertainty is relatively consistent and systematic at all wavelengths, so we have more confidence in the spectral shapes than their absolute magnitudes.
ACPD
8, 10913–10954, 2008 Separation and attribution of aerosol absorption M. Yang et al. Title Page Abstract Introduction Conclusions References Tables Figures ◭ ◮ ◭ ◮ Back CloseFull Screen / Esc
Printer-friendly Version Interactive Discussion
Table 3 shows the absorption and scattering ˚Angstrom exponents for the entire project and for identified air masses. The wavelength-dependence in absorption was calculated over the entire aethalometer wavelength range and also over the visible spectrum only, leading to almost identical results. The wavelength-dependence in scat-tering was calculated over the more limited nephelometer wavelengths. Both
absorp-5
tion and scattering ˚Angstrom exponents averaged to ∼1.5. The fine absorption fraction (the fraction of total absorption due to submicron particles from the PSAP) and fine scattering fraction averaged to 0.83 and 0.76, respectively, at 550 nm (Table 4).
The observed single scatter albedo was at its highest in the entire project during dust events at 0.90 (550 nm) and it increased from the UV to the IR. During EAST-AIRE,ω0 10
was much lower than the 0.97 seen during ACE-Asia (Anderson et al., 2003). One possible explanation is that the Xianghe dust had included some light absorbing car-bon (from interactions in the coal boiler and atmosphere, or from re-suspension of soot deposited on the ground), whereas the free tropospheric dust observed during ACE-Asia did not have much contact with urban pollutants. Submicron and
super-15
micronω0 at dust-dominated times were 0.86 and 0.94 at 550 nm; both were higher than their respective project means. If only looking at total absorption and scattering, a high absorption ˚Angstrom exponent (1.89) and a low scattering ˚Angstrom exponent (0.59) were also observed at these times. The wavelength-dependence in total ab-sorption during dust events is not as high as what was previously reported for dust
20
only ( ˚A≈3), presumably due to the aforementioned BC that follows a lower wavelength-dependence. The low wavelength-dependence in scattering is characteristic of coarse particles that scatter in the geometric regime. The fine absorption and scattering frac-tions were 0.69 and 0.46 for dust-dominated times, respectively; both were much lower than their project averages, again indicating the presence of coarse particles.
25
The single scatter albedo was much lower in fresh chimney plumes. Overall,ω0was 0.83 at 550 nm, while submicron and supermicronω0were 0.79 and 0.86, respectively. The wavelength-dependence in total absorption reached its project minimum in chim-ney plumes at ˚A=1.35, implying that these aerosols were similar to fresh soot. The fine
ACPD
8, 10913–10954, 2008 Separation and attribution of aerosol absorption M. Yang et al. Title Page Abstract Introduction Conclusions References Tables Figures ◭ ◮ ◭ ◮ Back CloseFull Screen / Esc
Printer-friendly Version Interactive Discussion
absorption and scattering fractions were 0.85 and 0.79, respectively; both were higher than the project means, confirming that there was a large fraction of fine absorbing particles. However, this absorption ˚Angstrom exponent is still ∼30% higher than what is expected for soot only (unity), which indicates the ubiquitous presence of other light absorbing aerosols near Xianghe.
5
Residential combustion of coal briquettes seemed to result in emissions of large particles, presumably either from the clay binder or directly from the coal, in addition to soot. The lowestω0during the entire project was found in coal-derived aerosols, with an average of 0.80 at 550 nm. Unlike in fresh chimney plumes whereω0 decreased with wavelength, ω0 for these coal-derived aerosols showed no obvious
wavelength-10
dependence. Compared to chimney plumes, the higher absorption ˚Angstrom (1.47) and lower scattering ˚Angstrom (1.39) in these coal-derived aerosols indicate more coarse (absorbing) particles.
The background air, which was identified by low scattering, closely resembled the typical atmosphere in Xianghe in terms of the single scatter albedo. The low ω0 in
15
northern China even when the atmosphere was relatively clean underlines the impor-tance of coal burning emissions.
4 Discussion
As a first order approximation for the EC mass absorption efficiency, we can normal-ize total absorption by the mass concentration of EC. The resultant “apparent” EC
20
MAE (project mean of 11.3 m2/g at 550 nm), however, would be ∼40% higher than that recommended by Bond and Bergstrom (2006) for fresh soot carbon at this wave-length (7.5±1.2 m2/g). This suggests that total light absorption cannot be explained by soot carbon alone, a likelihood reinforced by the strong wavelength-dependence ( ˚A≈1.5). Rather, other light absorbing materials were present also and absorbed a 25
lot more at shorter wavelengths than at longer wavelengths. Brown carbon and dust are two potentially significant light absorbers that are known to have high absorption
ACPD
8, 10913–10954, 2008 Separation and attribution of aerosol absorption M. Yang et al. Title Page Abstract Introduction Conclusions References Tables Figures ◭ ◮ ◭ ◮ Back CloseFull Screen / Esc
Printer-friendly Version Interactive Discussion
˚
Angstrom exponents in the visible spectrum. It is worth mentioning here that if brown carbon causes an artifact in thermal-optical methods, as suggested by Subramanian et al. (2007), some of the EC values might be erroneously low, leading to high “apparent” EC MAE.
We also considered the effect of coating of soot by transparent condensates.
Re-5
cent modeling studies (Fuller et al., 1999; Schnaiter et al., 2003; Bond et al., 2006) suggested that external mixing of BC with weakly-absorbing materials does not signifi-cantly increase absorption, but a complete encapsulation of a BC core by condensates could result in an absorption enhancement of about 30∼50%. While such an increase would be large enough to explain our high “apparent” EC MAE, we have no reason
10
to attribute the high absorption ˚Angstrom exponent of ∼1.5 to this encapsulation ef-fect. Modeling and laboratory studies have not indicated any consistent increase in the wavelength-dependence of BC absorption due to coating. On the contrary, Schnaiter et al. (2005) reported a slightly decreasing absorption ˚Angstrom exponent with increasing internal mixing of black carbon with secondary organic aerosols.
15
Soot, being in the Rayleigh regime, is expected to have a greater wavelength-dependence in scattering than in absorption. Thus, its single scatter albedo should decrease with increasing wavelength. Both dust and brown carbon, however, can have greater wavelength-dependences in absorption than in scattering. The single scat-ter albedo for these two types of aerosols should therefore increase with wavelength.
20
During EAST-AIRE, the project average single scatter albedo was low in IR and UV and peaked in the mid-visible, again suggesting a mixture of BC with other absorbing aerosols.
4.1 BC Absorption
Accepting that BC follows the inverse-wavelength relationship from 370 to 950 nm, we
25
can approximate BC absorption at any wavelength within this spectrum if we know its absorption at one wavelength. We can further assume that BC is the only signifi-cant light absorber at 950 nm, since both brown carbon and dust absorb weakly in the
ACPD
8, 10913–10954, 2008 Separation and attribution of aerosol absorption M. Yang et al. Title Page Abstract Introduction Conclusions References Tables Figures ◭ ◮ ◭ ◮ Back CloseFull Screen / Esc
Printer-friendly Version Interactive Discussion
near-IR. Then we can use the absorption ˚Angstrom exponent of one to extrapolate BC absorption from 950 nm to shorter wavelengths. A similar argument was used in Clarke et al. (2007), but based on negligible non-soot absorption at 670 nm.
We define the difference between total absorption and extrapolated BC absorption as residual absorption. The residual absorption was zero at 950 nm by definition and
5
increased to over 30% of total absorption at 370 nm. In the mid-visible, the contribution to total absorption by aerosols other than BC was ∼15%. The residual absorption had an absorption ˚Angstrom exponent of ∼3.5 in the visible spectrum, which is close to those of brown carbon and dust. The very high correlation coefficient between residual absorption and OC concentration (0.95) suggested that most of the residual absorption
10
was due to brown carbon.
We can now normalize the extrapolated BC absorption to the elemental carbon con-centration to obtain the EC mass absorption efficiency. The resultant “true” EC MAE (project mean of 9.5 m2/g at 550 nm) represents a ∼20% reduction from the “apparent” EC MAE, and is much closer to the recommendation by Bond and Bergstrom (2006)
15
and well within the range of enhancements likely to be caused by encapsulation. 4.2 Dust absorption
While the absorption of mineral dust depends on its content of ferric oxides (Sokolik and Toon, 1999; Alfaro et al., 2004), in urban environments, volatile materials such as OC, sulfates, and nitrates from combustion can be adsorbed onto dust surfaces
20
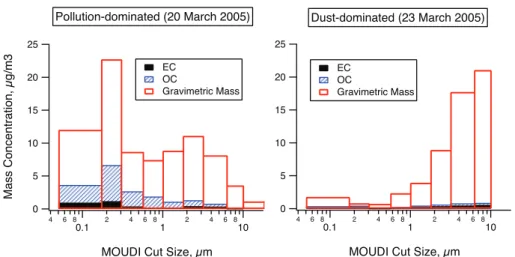
(Falkovich et al., 2004; Zhang and Carmichael, 1999), possibly modifying the dust op-tical properties. From size-segregated mass concentrations sampled by the MOUDI, we see that unlike pollution times when most mass was concentrated in the fine mode, dust events were characterized by a high fraction of mass, including that of carbona-ceous particles, in the coarse mode (Fig. 6). Dust particles sampled in polluted places
25
like Xianghe, therefore, should not be considered pure mineral aerosols. During EAST-AIRE, dust events usually coincided with high winds which re-suspended local coarse particles; it is unclear whether long-distance transport of desert aerosols was
impor-ACPD
8, 10913–10954, 2008 Separation and attribution of aerosol absorption M. Yang et al. Title Page Abstract Introduction Conclusions References Tables Figures ◭ ◮ ◭ ◮ Back CloseFull Screen / Esc
Printer-friendly Version Interactive Discussion
tant. As mentioned before, some of these coarse particles might be generated during the combustion of coal (briquettes). This scenario is more plausible in bringing light absorbing carbon into the coarse mode than natural coagulation.
Since we could not directly measure the mass concentration and light absorption of dust, we estimated these two quantities from the size-distributed number
concentra-5
tions from the APS using Mie scattering theory. Knowing that pollution aerosols tend to dominate in the fine mode, we only used the supermicron portion of the size-distributed number concentrations for this Mie calculation. Even though the dust number distribu-tion might have a tail in the fine mode, (which we could not constrain due to a lack of size-distributed chemical concentration measurement and particle number count below
10
∼0.7 um) mass, scattering, and absorption due to dust are all dominated by coarse par-ticles, as shown by Clarke et al. (2004) in their measurements during ACE-Asia. This Mie calculation also required a reasonable refractive index for dust aerosols. How-ever, the imaginary component of the refractive index of dust varies over an order of magnitude among literature values, from 0.0006i to 0.0015i to 0.008i in the mid-visible
15
(Clarke et al., 2004; Haywood et al., 2003; World Meteorological Organization, 1986). To determine the refractive index of dust appropriate for Xianghe, we first focused on identified end-member dust events during EAST-AIRE and assumed that absorption due to brown carbon was negligible at those times (i.e. residual absorption, or the difference between total absorption and BC absorption, was solely due to dust). This
20
assumption was supported by the fact that correlation between coarse volume and residual absorption at 370 nm was ∼0.9 during dust events, much higher than ∼0.5 for the project average. At each aethalometer wavelength, we varied the imaginary component of the refractive index from 0i to 0.01i, while keeping the real component constant at 1.53 – a value commonly used to model dust (Sokolik and Toon, 1999;
25
Haywood et al., 2003; Clarke et al., 2004). Absorption predicted by Mie scattering theory was then summed over all size-bins to generate total absorption. The fitting was deemed optimal when the square of the difference between residual absorption and Mie-predicted absorption was the smallest on average at those end-member dusty
ACPD
8, 10913–10954, 2008 Separation and attribution of aerosol absorption M. Yang et al. Title Page Abstract Introduction Conclusions References Tables Figures ◭ ◮ ◭ ◮ Back CloseFull Screen / Esc
Printer-friendly Version Interactive Discussion
periods. For 370, 470, 520, 590, 660, 880, and 950 nm, our least-square-fit method yielded an imaginary component of 0.0056i, 0.0033i, 0.0026i, 0.0019i, 0.001i, 0.0001i, and 0i, respectively. By interpolation, a refractive index of 1.53–0.0023i at 550 nm was obtained, which is in the range of previously published results. Now for the entire EAST-AIRE project, using Mie theory, we applied this set of empirically-derived refractive
5
indices to all supermicron particle number concentrations to obtain a complete time-series of dust absorption. This calculation assumes that all coarse particles during EAST-AIRE had the same optical properties, whether during dust events or not, which might not be valid if some of the large aerosols were combustion-origin. Based on this estimation, absorption due to dust was usually quite minor in Xianghe except during
10
dust events.
Considering again only the supermicron particles from the APS, we calculated the mass concentration of dust from the volume concentration using a constant density of 2.6 g/cm3. We could also estimate the mass concentration of dust from soluble calcium, as previous experiments suggested that water-soluble calcium makes up ∼5–
15
8% of total dust mass (Arimoto et al., 2004); this latter approach yielded similar results. The mean dust MAE was determined to be 0.03 m2/g at 550 nm, over two orders of magnitude less than that of black carbon. Published results of the absorption ˚Angstrom exponent of dust are over the visible spectrum only, likely because a power law fit might not be suitable for dust absorption from 370 to 950 nm due to its particular spectral
20
shape, as seen in modeled spectra from Sokolik and Toon (1999). We calculated our wavelength-dependence in dust absorption from 470 to 660 nm (Table 5), resulting in an average of 3.8. A large range in the wavelength-dependence was observed, which could be due to a number of modification processes that these dust aerosols might have undergone.
25
4.3 Brown carbon absorption
We derived our absorption due to brown carbon by subtracting BC and dust absorption from total absorption at all wavelengths, assuming that nothing besides black carbon,
ACPD
8, 10913–10954, 2008 Separation and attribution of aerosol absorption M. Yang et al. Title Page Abstract Introduction Conclusions References Tables Figures ◭ ◮ ◭ ◮ Back CloseFull Screen / Esc
Printer-friendly Version Interactive Discussion
brown carbon, and dust had any significant absorption between 370 and 950 nm during EAST-AIRE. For the mass concentration of brown carbon, we decided to simply use the total particulate organic carbon concentration measured by the Sunset lab OCEC Semi-continuous analyzer. Knowing that a large fraction of organic carbon is non-absorbing, dividing brown carbon absorption by an upper-limit concentration will give
5
us a lower-limit mass absorption efficiency. The real mass absorption efficiency for brown carbon will surely be higher than the values presented here. The advantage of normalizing brown carbon absorption to organic carbon, however, is that the mass concentration of organic carbon can be measured by the same technique in different labs (Schauer et al., 2003) and is thus more reproducible than that of brown carbon.
10
The mean brown carbon MAE was determined to be 0.5 m2/g at 550 nm, less than one tenth of the EC MAE at the same wavelength. The average absorption ˚Angstrom exponent of brown carbon during EAST-AIRE was 3.5 over the visible spectrum, which is higher than what were commonly reported for biomass burning aerosols ( ˚A≈2; Clarke et al., 2006; Kirchstetter and Novakov, 2004; Kline, 2004). However, when
15
contribution from BC was removed from total absorption, those authors found similarly high absorption ˚Angstrom exponents.
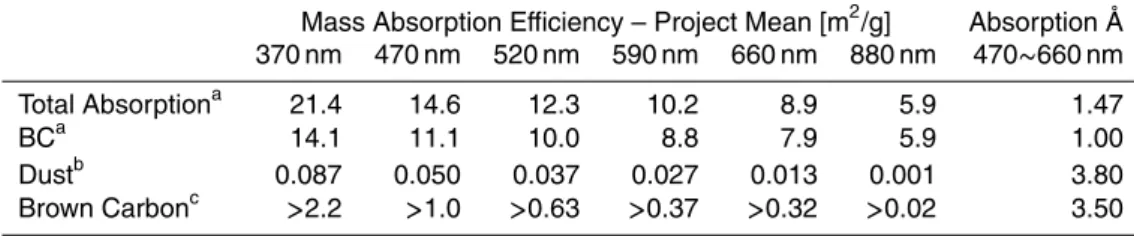
Table 5 summarizes the project mean mass absorption efficiencies (m2/g) and ab-sorption ˚Angstrom exponents of black carbon, brown carbon, and dust. Via prop-agation of errors, the uncertainty in the EC concentration from the OCEC analyzer
20
was estimated to be ∼17% (Kline, 2004). Combined with the propagated uncertain-ties in the aethalometer absorption of 19∼26%, the EC mass absorption efficiency should have uncertainties of 26∼31% (from 370 to 950 nm). Figure 7 shows the av-erage contribution to total light absorption by black carbon, brown carbon, and dust from 370 to 950 nm. Black carbon was predictably the most important light-absorbing
25
aerosol; though its importance to total absorption decreased towards shorter wave-lengths, where brown carbon and dust became more significant. Brown carbon on average could account for ∼30% of total absorption at 370 nm. Even at mid-visible wavelengths, it still contributed more than 10%, underlining the optical importance of
ACPD
8, 10913–10954, 2008 Separation and attribution of aerosol absorption M. Yang et al. Title Page Abstract Introduction Conclusions References Tables Figures ◭ ◮ ◭ ◮ Back CloseFull Screen / Esc
Printer-friendly Version Interactive Discussion
absorbing organic carbon in environments dominated by coal burning. The absorption due to dust was generally small (less than 5% at 370 nm), though its contribution to total absorption can be similar to that from BC during dust events.
5 Conclusions
A variety of in situ optical and chemical measurements were made on aerosols near
Xi-5
anghe, China during the EAST-AIRE campaign. Based on previously published meth-ods, a correction scheme incorporating concurrent scattering was developed to ad-dress the loading artifact of the aethalometer. The single scatter albedo from 370 to 950 nm was directly calculated from aethalometer absorption and nephelometer scat-tering. In general, aerosols in Xianghe were highly absorbing, as demonstrated by
10
the low ω0 at all wavelengths (project mean and standard deviation of 0.84±0.05 at 550 nm). We also quantified absorption and scattering in the coarse and fine modes separately at 550 nm; the submicronω0 was found to be lower than the supermicron ω0. On average, both absorption and scattering ˚Angstrom exponents were close to 1.5, suggesting the presence of large, absorbing particles.
15
We identified five end-member air mass types that might be characteristic of North-ern China, which are dust, biomass burning aerosols, fresh (industrial) chimney plumes, other (residential and commercial) coal-derived aerosols, and the background air. Optical properties varied significantly among these air masses as a result of their different chemical compositions. In the mid-visible, dust and biomass burning aerosols
20
had the highest single scatter albedo among identified air masses. Dust, as character-ized by high calcium and coarse scattering, had the lowest scattering ˚Angstrom expo-nent due to the large particle size and a high absorption ˚Angstrom exponent due to the presence of ferric oxides. During dust events, a higher percentage of the carbonaceous mass was found in the coarse mode than during pollution-dominated times, suggesting
25
a possible surface adsorption mechanism of light absorbing carbon onto dust particles. Biomass burning and coal burning aerosols both showed high absorption ˚Angstrom
ACPD
8, 10913–10954, 2008 Separation and attribution of aerosol absorption M. Yang et al. Title Page Abstract Introduction Conclusions References Tables Figures ◭ ◮ ◭ ◮ Back CloseFull Screen / Esc
Printer-friendly Version Interactive Discussion
exponents, likely because brown carbon was also produced. Fresh chimney plumes contained aerosols most resembling diesel soot (absorption ˚A closest to one).
We found that normalizing total absorption to the mass concentration of elemental carbon yielded an unrealistically high EC mass absorption efficiency, indicating that light absorbers other than soot were present. We were able to attribute total light
5
absorption to black carbon, brown carbon, and dust from 370 to 950 nm, resulting in mass absorption efficiencies of 9.5, 0.5, and 0.03 m2/g at 550 nm, respectively. The black carbon MAE might have been enhanced due to the coating effect. The brown carbon MAE should be viewed as a lower-limit since we normalized its absorption to the concentration of OC. The dust MAE represented those of local coarse particles
10
that had interacted with pollution rather than pure desert aerosols. The contribution to total absorption from BC decreased towards the UV, where absorption due to brown carbon and dust became increasingly significant as a result of their greater wavelength-dependences. These mass absorption efficiencies from the UV to the IR hopefully will prove useful for future modeling purposes and the apportionment of gross optical
15
properties.
Acknowledgements. We would like to acknowledge our funding agency (NASA, #
NNG04GC59G) and everyone involved in the planning and operation of this experiment. We also thank Russell Dickerson’s group of the University of Maryland for their gas measurements. Finally, we thank the staff of the Xianghe IAP facility, who were exceedingly helpful and
gener-20
ous with their time and skills.
References
Alfaro, S. C., Lafon, S., Rajot, L., Formenti, P., Gaudichet, A., and Maille, M.: Iron oxides and light absorption by pure desert dust: An experiment study, J. Geophys. Res., 109, D08208, doi:10.1029/2003JD004374, 2004.
25
Ananth, G. and Wilson, J. C.: Theoretical analysis of the performance of the TSI aerodynamic particle sizer: The effect of density on response, Aerosol Sci. Technol., 9, 189–199, 1988.
ACPD
8, 10913–10954, 2008 Separation and attribution of aerosol absorption M. Yang et al. Title Page Abstract Introduction Conclusions References Tables Figures ◭ ◮ ◭ ◮ Back CloseFull Screen / Esc
Printer-friendly Version Interactive Discussion Anderson, T. L., Masonis, S. J., Covert, D. S., Ahlquist, N. C., Howell, S. G., Clarke, A. D., and
McNaughton, C. S.: Variability of aerosol optical properties derived from in situ aircraft mea-surements during ACE-Asia, J. Geophys. Res., 108, D23, 8647, doi:10.1029/2002JD003247, 2003.
Anderson, T. L. and Ogren, J. A.: Determining aerosol radiative properties using the TSI 3563
5
integrating nephelometer, Aerosol Sci. Technol., 29, 57–69, 1998.
Andreae, M. O and Gelencser, A.: Black carbon or brown carbon? The nature of light-absorbing carbonaceous aerosols, Atmos. Chem. Phys. Discuss., 6, 3419–3463, 2006,
http://www.atmos-chem-phys-discuss.net/6/3419/2006/.
Arimoto, R., Zhang, X. Y., Huebert, B. J., Kang, C. H., Savoie, D. L., Prospero, J. M., Sage, S.
10
K., Schloesslin, C. A., Khaing, H. M., and Oh, S. N.: Chemical composition of atmospheric aerosols from Zhenbeitai, China, and Gosan, South Korea, during ACE-Asia, J. Geophys. Res., 109, D19S04, doi:10.1029/2003JD004323, 2004.
Arnott, W. P., Hamasha, K., Moosmuller, H., Sheridan, P. J., and Ogren, J. A.: Towards aerosol light-absorption measurements with a 7-wavelength aethalometer: evaluation with a
photoa-15
coustic instrument and 3-wavelength nephelometer, Aerosol Sci. Technol., 39, 17–29, 2005. Bergstrom, R. W., Russell, P. B., and Hignett, P.: The wavelength dependence of black carbon
particles: predictions and results from the Tarfox experiment and implications for the aerosols single scatter albedo, J. Atmos. Sci., 59, 567–577, 2002.
Birch, M. E. and Cary, R. A.: Elemental carbon-based method for monitoring occupational
20
exposures to particulate diesel exhaust, Aerosol Sci. Technol., 25, 221–241, 1996.
Bond, T. C., Anderson, T. L., and Campbell, D.: Calibration and intercomparison of filter-based measurements of visible light absorption by aerosols, Aerosol Sci. Technol. 30, 582–600, 1999.
Bond, T. C. and Bergstrom, R. W.: Light absorption by carbonaceous particles: an investigative
25
review, Aerosol Sci. Technol., 40, 27–67, 2006.
Bond, T. C., Covert, D. S., Kramlich, J. C., Larson, T. V., and Charlson, R. J.: Primary particle emissions form residential coal burning: optical properties and size distributions. J. Geophys. Res., 107, D21, 8347, doi:10.1029/2001JD000571, 2002.
Bond, T. C., Habib, G., and Bergstrom, R. W.: Limitations in the enhancement of visible light
30
absorption due to mixing state, J. Geophys. Res., 111, D20211, doi:10.1029/2006JD007315, 2006.
Ander-ACPD
8, 10913–10954, 2008 Separation and attribution of aerosol absorption M. Yang et al. Title Page Abstract Introduction Conclusions References Tables Figures ◭ ◮ ◭ ◮ Back CloseFull Screen / Esc
Printer-friendly Version Interactive Discussion son, T., Covert, D., Anderson, J., Hua, X., Moore II, K. G., McNaughton, C., Carmichael,
G., and Weber, R.: Size distributions and mixtures of dust and black carbon aerosol in Asian outflow: Physiochemistry and optical properties, J. Geophys. Res., 109, D15S09, doi:10.1029/2003JD004378, 2004.
Clarke, A. D., McNaughton, C., Kapustin, V., Shinozuka, Y., Howell, S., Dibb, J., Zhou,
5
J., Anderson, B., Brekhovskikh, V., Turner, H., and Pinkerton, M.:. Biomass burning and pollution aerosol over North America: Organic components and their influence on spectral optical properties and humidification response, J. Geophys. Res., 112, D12S18, doi:10.1029/2006JD007777, 2007.
Falkovich, A. H., Schkolnik, G., Ganor, E., and Rudich, Y.: Adsorption of organic compounds
10
pertinent to urban environments onto mineral dust particles, J. Geophys. Res, 109, D02208, doi:10.1029/2003JD003919, 2004.
Fialho, P., Freitas, M. C., Barata, F., Vieira, B., Hansen, A. D. A., and Honrath, R. E.: The aethalometer calibration and determination of iron concentration in dust aerosols, Aerosol Sci. 37, 1497–1506, 2006.
15
Fuller, K. A., Malm, W. C., and Kreidenweis, S. M.: Effects of Mixing on Extinction By Carbona-ceous Particles, J. Geophys. Res., 014D13, 15 941–15 954, 1999.
Hansen, A. D. A., Rosen, H., and Novakov, T.: The aethalometer – an instrument for the real-time measurement of optical absorption by aerosol particles, Sci. Total Env. 36, 191–196, 1984.
20
Haywood, J., Francis, P., Osborne, S., Glew, M., Loeb, N., Highwood, El., Tanre, D., Myhre, G., Formenti, P., and Hirst, E.: Radiative properties and direct radiative effect of Saharan dust measured by the C-130 aircraft during SHADE: 1. Solar spectrum. J. Geophys. Res, 108, D18, 8577, doi:10.1029/2002JD002687, 2003.
Hoffer, A., Gelencser, A., Guyon, P., Kiss, G., Schmid, O., Frank, G. P., Artaxo, P., and Andreae,
25
M. O.: Optical properties of humic-like substances (HULIS) in biomass-burning aerosols,
Atmos. Chem. Phys., 6, 3563–3570, 2006,http://www.atmos-chem-phys.net/6/3563/2006/.
Huebert, B., Bertram, T., Kline, J., Howell, S., Eatough, D., and Blomquist, B.: Measurements of organic and elemental carbon in Asian outflow during ACE-Asia from the NSF/NCAR C-130. J. Geophys. Res., 109, D19S11, doi:10.1029/2004JD004700, 2004.
30
Kaufman, Y. J., Setzer, D., Ward, D., Tanre, D, Holben, D. N., Menzel, P., Pereira, M. C., and Rasmussen, R.: Biomass burning airborne and spaceborne experiment in the Amazons (BASE-A), J. Geophys. Res., 97, 14 581–14 599, 1992.
ACPD
8, 10913–10954, 2008 Separation and attribution of aerosol absorption M. Yang et al. Title Page Abstract Introduction Conclusions References Tables Figures ◭ ◮ ◭ ◮ Back CloseFull Screen / Esc
Printer-friendly Version Interactive Discussion Kline, J., Huebert, B., Howell, S., Blomquist, B., Zhuang, J., Bertram, T., and Carrilo, J.: Aerosol
composition and size versus altitude measured from the C-130 during ACE-Asia. J. Geophys. Res., 109, D19S08, doi:10.1029/2004JD004540, 2004.
Kirchstetter, T. W., Novakov, T., and Hobbs, P. V.: Evidence that the spectral dependence of light absorption by aerosols is affected by organic carbon, J. Geophys. Res., 109, D21208,
5
doi:10.1029/2004JD004999, 2004.
Li, Z., Chen, H., Cribb, M., et al.: Preface to special section on East Asian Studies of Tro-pospheric Aerosols: An International Regional Experiment (EAST-AIRE), J. Geophys. Res., 112, D22S00, doi:10.1029/2007JD008853, 2007.
Novelli, P. C., Steele, L. P., and Tans, P. P.: Mixing ratios of carbon monoxide in the troposphere,
10
J. Geophys. Res., 97, D18, 20 731–20 750, 1992.
Penner, J. E., Andreae, M., Annegam, H., et al.: Aerosols, their direct and indirect effects, in: Climate Change 2001: The scientific Basis: Contribution of Working Group I to the Third As-sessment Report of the Intergovernmental Panel on Climate Change, edited by: Houghton, J. T., Ding, Y., Griggs, D. J., et al., 291–348, Cambridge Univ. Press, New York, 2001.
15
Penner, J. E., Eddleman, H., and Novakov, T.: Towards the development of a global inventory for black carbon emissions, Atmos. Environ., 27, 1277–1295, 1993.
Schauer, J. J., Mader, B. T., Deminter, J. T., et al.,: ACE-Asia intercomparison of a thermal-optical method for the determination of particle-phase organic and elemental carbon, Envi-ron. Sci. Technol., 37, 5, 993–1001, 2003.
20
Schnaiter, M., Horvath, H., M ¨ohler, O., Naumann, K.-H., Saathoff, H., and Sch ¨ock, O.: UV-VIS-NIR Spectral Optical Properties of Soot and Soot-containing Aerosols, J. Aerosol Sci., 34, 10, 1421–1444, 2003.
Schnaiter, M., Linke, C., Mohler, O., Naumann, K., Saathoff, H., Wagner, R., Schurath, U., and Wehner, B.: Absorption amplification of black carbon internally mixed secondary organic
25
aerosol, J. Geophys. Res., 110, D19204, doi:10.1029/2005JD006046, 2005.
Sokolik, I. N. and Toon, O. B.: Incorporation of mineralogical composition into models of the radiative properties of mineral aerosol from UV to IR wavelengths, J. Geophys. Res., 104, D8, 9423–9444, 1999.
Solomon, S., Qin, D., Manning, M., et al.: Technical Summary, in: Climate Change 2007: The
30
Physical Science Basis. Contribution of Working Group I to the Fourth Assessment Report of the Intergovernmental Panel on Climate Change, edited by: Solomon, S., Qin, D., Manning, M., Chen, Z., Marquis, M., Averyt, K. B., Tignor, M., and Miller, H. L., Cambridge University
![Fig. 3. Absorption and scattering at 520 nm (top left panel), single scatter albedo at 370 and 950 nm (top right panel), [OC] and [EC] (bottom left panel), and absorption and scattering Angstrom exponents (bottom right panel) binned to the 24 h of a day](https://thumb-eu.123doks.com/thumbv2/123doknet/14774150.592806/39.918.104.607.89.464/absorption-scattering-single-scatter-absorption-scattering-angstrom-exponents.webp)