HAL Id: hal-01097236
https://hal.sorbonne-universite.fr/hal-01097236
Submitted on 19 Dec 2014
HAL is a multi-disciplinary open access archive for the deposit and dissemination of sci-entific research documents, whether they are pub-lished or not. The documents may come from teaching and research institutions in France or abroad, or from public or private research centers.
L’archive ouverte pluridisciplinaire HAL, est destinée au dépôt et à la diffusion de documents scientifiques de niveau recherche, publiés ou non, émanant des établissements d’enseignement et de recherche français ou étrangers, des laboratoires publics ou privés.
Relationships between biodiversity and the stability of
marine ecosystems: Comparisons at a European scale
using meta-analysis
Mathieu Cusson, Tasman P. Crowe, Rita Araújo, Francisco Arenas, Rebbecca
Aspden, Fabio Bulleri, Dominique Davoult, Kirstie Dyson, Simonetta
Fraschetti, Kristjan Herkül, et al.
To cite this version:
Mathieu Cusson, Tasman P. Crowe, Rita Araújo, Francisco Arenas, Rebbecca Aspden, et al.. Re-lationships between biodiversity and the stability of marine ecosystems: Comparisons at a Eu-ropean scale using meta-analysis. Journal of Sea Research (JSR), Elsevier, 2014, 98, pp.5-14. �10.1016/j.seares.2014.08.004�. �hal-01097236�
1
Relationships between biodiversity and the stability of marine ecosystems:
comparisons at a European scale using meta-analysis
Mathieu Cusson1,2,3, Tasman P. Crowe1†, Rita Araújo4, Francisco Arenas4, Rebbecca Aspden5,
Fabio Bulleri2, Dominique Davoult6,7, Kirstie Dyson5, Simonetta Fraschetti8, Kristjan Herkül9,
Cédric Hubas6,10, Stuart Jenkins11,12, Jonne Kotta9, Patrik Kraufvelin13,14 Aline Migné6,7,
Markus Molis15, Olwyen Mulholland1, Laure M.-L. J. Noël7,16, David M. Paterson5, James
Saunders5, Paul J. Somerfield16, Isabel Sousa-Pinto4, Nicolas Spilmont17,18, Antonio Terlizzi8,
Lisandro Benedetti-Cecchi2†
1School of Biological and Environmental Science, University College Dublin, Belfield Dublin 4 Ireland 2Dipartimento di Biologia, University of Pisa, Via Derna 1, I-56126 Pisa, Italy
3Present address: Département des sciences fondamentales, Université du Québec à Chicoutimi, 555 rue de l’Université, Chicoutimi (Québec), G7H 2B1, Canada
4Laboratory of Coastal Biodiversity, Centre of Marine and Environmental Research (CIIMAR), University of Porto, Rua dos Bragas 289, 4050-123 Porto, Portugal.
5Scottish Oceans Institute, University St. Andrews, East Sands, Scotland, KY16 8LB, United Kingdom
6Sorbonne Universités, UPMC Univ Paris 6, UMR 7144, Station Biologique de Roscoff, Place Georges Teissier BP 74, 29682 Roscoff cedex, France
7CNRS, UMR 7144, Station Biologique de Roscoff, 29682 Roscoff cedex, France
8Laboratorio Zoologia e Biologia Marina, Dipartimento di Scienze e Tecnologie Biologiche ed Ambientali, Università di Lecce, CoNISMa, 73100 Lecce, Italy
9Estonian Marine Institute, Department of Marine Biology, University of Tartu, Mäealuse 14, 12618 Tallinn, Estonia
10Present address: Muséum National d’Histoire Naturelle, UMR BOREA UPMC Univ Paris 6, CNRS 7208, IRD 207, UCBN, CP 53, 61 rue Buffon, 75231 Paris Cedex 5, France
11The Marine Biological Association of the UK, The Laboratory, Citadel Hill, Plymouth, PL1 2PB, United Kingdom
12Present address: School of Ocean Sciences, Bangor University, Menai Bridge Anglesey LL59 5AB, United Kingdom
13Environmental and Marine Biology, Department of Biosciences, Åbo Akademi University, Artillerigatan 6, 20520 Åbo, Finland
14Novia University of Applied Sciences, Raseborgsvägen 9, FI-10600 Ekenäs, Finland
15Section Functional Ecology, Biologische Anstalt Helgoland, Alfred-Wegener-Institute for Polar and Marine Research, marine station, Kurpromenade 201, 27498 Helgoland, Germany
16Present address: Centre d’Étude et de Valorisation des Algues (CEVA), Presqu’île de Pen-Lan – B.P.3, 22610 Pleubian, France
16Plymouth Marine Laboratory, Prospect Place, West Hoe, Plymouth, PL1 3DH, United Kingdom
17Université Lille Nord de France, Université Lille 1, CNRS UMR LOG 8187, Laboratoire Océanologie et Géosciences, 62930 Wimereux, France
18Present address: Environmental Futures Research Institute, Griffith University, Gold Coast Campus, QLD 4222, Australia
†Coordinators of BIOFUSE programme within MarBEF
Corresponding author: [email protected] phone: +1-418-545-5011 #5065
2
Abstract
The relationship between biodiversity and stability of marine benthic assemblages was investigated through meta-analyses using existing data sets (n = 28) covering various spatial (m-km) and temporal (1973-2006; ranging from 5 to >250 months) scales in different benthic habitats (emergent rock, rock pools and sedimentary habitats) over different European marine systems (North Atlantic and western Mediterranean). Stability was measured by a lower variability in time, and variability was estimated as temporal variance of species richness, total abundance (density or % cover) and community structure (using Bray-Curtis dissimilarities on species composition and abundance). Stability generally decreased with species richness. Temporal variability in species richness increased with the number of species at both quadrat (<1 m2) and site (100 m2) scales, while no relationship was observed
by multivariate analyses. Positive relationships were also observed at the scale of site between temporal variability in species richness and variability in community structure with evenness estimates. This implies that the relationship between species richness or evenness and species richness variability is slightly positive and depends on the scale of observation. Thus, species richness does not stabilize temporal fluctuations in species number, rather species rich assemblages are those most likely to undergo the largest fluctuations in species numbers and abundance from time to time. Changes within community assemblages in terms of structure are, however, generally independent of biodiversity. Except for sedimentary and rock pool habitats, no relationship was observed between temporal variation of total abundances and diversity at either scale. Overall, our results emphasise that the relation between species richness and species-level measures of temporal variability depend on scale of measurements, type of habitats and the marine system (North Atlantic and Mediterranean) considered.
Keywords: Biodiversity ecosystem functioning, temporal variability; diversity–stability
relationships; community variability; benthic marine coastal habitats.
Highlights
Generally, diversity increased temporal variations in species richness. Changes in community structure were independent of richness stability.
Diversity-stability relationships depend on the scale at which diversity is measured. Diversity-stability relationships vary among benthic habitats and regions.
3
1.
Introduction
For a long time, ecologists (e.g. MacArthur, 1955; Elton, 1958) have suggested that more diverse communities are more stable and diversity-stability relationships have been explored using various theoretical models (e.g. May, 1974; Raffaelli, 2004; Solan et al., 2004; Loreau and de Mazancourt, 2013), laboratory and field studies (e.g. Tilman and Downing, 1994; McGrady-Steed and Morin, 2000; Petchey et al., 2002). Interest in these relationships has resurged in recent years due to concern about the potential consequences of changing biodiversity for ecosystem functioning (e.g. Stachowicz et al., 2007; Donohue et al., 2013). Many of the theoretical and experimental studies have produced idiosyncratic results (Cottingham et al., 2001; Balvanera et al., 2006). Empirical support for relationships between biodiversity and stability across different ecological systems and spatial scales is still limited and contrasting, partly because of the practical limitations of empirical studies in encompassing long-term community dynamics. Indeed, individual studies have shown that increasing diversity may reduce (Li and Charnov, 2001; Ives and Hughes, 2002; Loreau and de Mazancourt, 2013), increase (e.g. Tilman, 1996; McCann, 2000; Isbell et al., 2009), or have little or no effect on the stability of some community attributes (e.g. McGrady-Steed and Morin, 2000). While no widespread consensus has been reached in the literature on which mechanisms are important in relating stability to biodiversity, a number of factors are known to affect the relationship. Among others, these include the scale of observation, historical effects of sites and species’ life-histories, direct and indirect effects of disturbance (e.g. Bertocci et al., 2005; including speed and asynchrony of responses: Loreau and de Mazancourt, 2013), biodiversity and productivity (Kondoh, 2001). Other factors that may prevent determining relationships are pitfalls in experimental design (e.g. Loreau et al., 2001; Hector et al., 2007), calculation method and bias in estimating temporal variability (McArdle et al., 1990; Cottingham et al., 2001) and unappreciated statistical properties of these variables (Doak et al., 1998).
Studies on diversity and stability relationships have focussed largely on community aggregated variables (i.e. total biomass, production) or population abundances (see also Mykrä et al., 2011). Conversely, the analysis of stability of diversity per se within assemblage has received less attention. Temporal stability (inversely proportional to variability) in richness is expected to decrease with increasing average in number of taxa due to a pure statistic argument (positive scaling relationship between mean and variance). On the other
4
hand, temporal variability in richness and changes in species structure within assemblages are important properties of communities. Disturbance regimes (Connell, 1978; Hughes et al., 2007) and resource availability may contribute to maintain high and relatively stable numbers of taxa at certain temporal and spatial scales. Several studies have shown that rich assemblages are locally organized in complex networks with varying interaction strengths and are prone to be generally more resistant to compositional turnover than less complex systems (Frank and McNaughton, 1991; Levine and D'Antonio, 1999; Shurin et al., 2007). If assemblage complexity begets stability via increased networks of interactions that prevent local extinctions, then rich (or more generally, diverse) assemblages should be compositionally more stable through time as compared with less diverse assemblages, despite the expected positive relationship between mean and variance. Also, intrinsic community properties such as negative covariance in species occurrence could lead to lower temporal variation at the more diverse sites offsetting the mean-variance scaling effect.
The role of evenness in diversity-stability relationships is not well understood (Hillebrand et al., 2008) and its use can provide different information not considered in the other diversity indices (Wilsey et al., 2005). Evenness within assemblages may enhance compositional stability (Frank and McNaughton, 1991) and reduce the risk of local extinction and invasion provided that no strong dominant can prevent further colonization. Polley et al. (2013) have shown that, in some circumstances, evenness in plant abundances and functional traits contributes as much as species richness to reduce temporal variability in productivity. Moreover, low dominance intensifies the stabilizing effect of richness on aggregated variables (e.g. total abundance): their variability becomes less affected by the scaling coefficient, z, determining the strength of the relationship between the mean and the variance (Doak et al., 1998; Vogt et al., 2006).
Ecological mechanisms that govern diversity, resource availability and species interactions are scale-dependent, so the prevalence of one mechanism at a given scale does not exclude the potential influence of other mechanisms at other scales (e.g. Whittaker et al., 2001; Raffaelli, 2006). This justifies the need to examine diversity-stability relationships at multiple scales. In this study, existing data sets were used to examine diversity-stability relationships and test whether they were different among habitats and between different European marine systems. This approach tests the general hypothesis that diversity measures (species richness and evenness) can be used as predictors of temporal stability within assemblages. Temporal
5
stability implies lower variability that was measured as temporal variance in total community abundance, taxa number and community structure. Our specific hypotheses are that temporal variability in univariate and multivariate measures reflecting changes in species (or higher taxa) abundance and composition within assemblages is related to biodiversity measures (i) at the scale of small patches (quadrats or grabs; ~ 0.10 m2); (ii) at the scale of shores (site; ~ 100s of m2); and (iii) relationships between temporal variability and biodiversity at either
scale varies according to the type of habitats and regions (marine systems). We are aware that the above hypotheses tested with observational data sets remain strictly correlative, not causal.
2.
Methods
2.1 Data bases description
Existing data sets of macrobenthic communities (n = 28) have been compiled (see list in Table 1). Each data set consists of multi-sites temporal series (6 minimum) of macrobenthic community abundances (densities or % cover) of algae and fauna and covered most European regions (Fig. 1). Data sets had median values of 12 sites per data set, 4 sampling dates and 6 samples per date. The data sets cover diverse marine benthic habitats (emergent rock: n = 20; rock pool: n = 3; sediment: n = 4) with the addition of one data set using subsurface artificial panels (discarded for categorical habitat analyses).
-Table 1- -Figure 1-
2.2 Estimation of temporal variation
The temporal variability in species richness (number of species/taxa within quadrats/grabs) and total abundance (as density or % cover, within quadrats/grabs) of macrobenthic algae and fauna were used as surrogate measures of the community stability (where low variability corresponds to high stability). Due to differences in sampling design among data sets, the temporal variability was estimated as follows: (i) For randomised spatial samples at each sampling date, temporal variability (σt2) in targeted variables were estimated using the Mean
Squares (MS) obtained from a one-way ANOVA with time as independent factor, as
σt2 (MStime - MSresidual)/n, where n is the number of replicate quadrats/grabs at each sampling
6
maximum likelihood method (MIXED procedure in SAS, SAS, 1999). (iii) For fixed quadrats samples (i.e. repeated measures through time), temporal variability was assessed as the variance (over time) of response variables from individual quadrats. Multivariate temporal variability was estimated from the same linear model as for the univariate case using Permutational Multivariate Analysis of Variance (PERMANOVA, Anderson, 2005). For fixed quadrats the average Bray-Curtis dissimilarity for each replicate quadrat over time was used. For analyses of variation in community structure, all abundances were square-root transformed while for variation in community composition, data was transformed to presence-absence.
2.3 Diversity estimates
In each region, organisms were identified to the lowest taxonomic level possible in the field or in the lab (usually species). Organisms were identified at the same level of taxonomic resolution across data sets. Diversity was quantified in terms of species richness (S, number of species, taxa, or morphological groups) and Pielou’s evenness (J’). Separate analyses were done using estimates from two different scales of observation: at the scale of the quadrat/grab (~ 0.10 m2) and at the scale of the site (~ 100s m2). Estimates at the scale of the quadrat refer
to the average values of variables within quadrats (i.e. all dates pooled) while estimates at scale of the site (i.e. all dates and quadrats pooled) refer to the total number of species and to the evenness of species densities averaged by site. Analyses were also performed using the rarefaction index E(Sn) in order to address the comparability of richness by standardizing abundances (see Appendix 1 for details).
2.4 Data analysis
All relationships between dependent (univariate and multivariate measures of temporal variability) and independent variables (diversity measures: S and J’) were separately investigated using linear regression. Specifically, it was examined if average species richness could be a predictor of temporal variations (as a response variable) in: a) species richness; b) community structure; and c) composition. Average evenness was also used as a predictor of temporal variation in: d) average species richness; e) community structure; and f) composition. Finally, it was tested if h) average species richness and i) average evenness were potential predictors of temporal variation in community abundance. It is worth noting that the analysis in a) represents a test for mean-variance relationship of species richness and this is discussed further in the text. The rarefaction index E(Sn) was also used as a predictor of
7
temporal variation in average species richness, community structure and composition (see supplementary results in Appendix 1). The correlation coefficient (r) and the slope parameter (), reflecting the strength and steepness of the relationship between dependent and independent variables, respectively, were used in meta-analyses (see Table A1 in supplemental material). A standard meta-analytical effect size was used to determine whether there is a significant general trend in the strength of the relationship among all the data sets (Hedges and Olkin, 1985; Gurevitch et al., 2001). Fisher Z-transformed correlation coefficients rz 0.5ln
1r /1r were used, with sampling variance νz = 1 /(N-3), where r is the correlation coefficient from the linear regression and N is the sample size. The slope parameter () along with its variance estimate SE was used as size effect (Hillebrand et al.,2001; see also Hillebrand, 2004) to test for general trends. It was also investigated with categorical meta-analyses if the results were significant when aggregated within habitats (emergent rock; rock pool; and sediment) or regions (North Atlantic and Mediterranean locations; no test for Baltic region) and to test whether categories differ from each other. Sediment habitat includes both subtidal and shore soft sediment. The analysis of heterogeneity (Q-statistic) of effect sizes for different groups was also tested (Q-statistic Hedges and Olkin, 1985). This test discriminates between the total heterogeneity (QT) into
heterogeneity between and within categories (respectively QB and QW) that are comparable to
the SS terms in a standard ANOVA. Mixed model meta-analyses were used (with MetaWin 2 Rosenberg et al., 2000) and effect sizes were considered significant if their confidence interval did not bracket zero. Bootstrap 95% confidence intervals were built using 999 iterations. Potential effects of the duration (average in month) of sampling at each study site as well as the sampling effort (composite variable of averaged number of dates and samples per date for each data set sites) on effect sizes rz and were examined by continuous model
meta-analysis (Rosenberg et al., 2000). A significance level α of 0.05 was adopted for all tests.
3.
Results
3.1 Analyses of species richness variations
3.1.1 Species richness as independent variable
Significant positive correlation coefficients were observed between temporal variation in species richness and species richness levels at both quadrat (~ 0.10 m2) and site (~ 100s m2)
8
2a,b). However, no significant trends were observed for emerged rock (ER) habitat and western Mediterranean (ME) region at both scales. At the scale of the site, the relationship strength rz values were significantly higher for rock pool (RP) than ER habitat and
significantly higher in North Atlantic (NA) than in ME region (Fig. 2b). No difference of ER effect sizes between NA (n = 4) and ME (n = 16) regions were observed in all tests (results not shown). No significant overall size effects or relationship between temporal changes in community structure and composition within assemblages with species richness was found (Fig. 2c-f). The strength and the slope of the relationships followed similar patterns for these analyses. Relationship analyses using expected species richness E(Sn) (or rarefaction index) at the scale of the site as an independent variable depicted some differences with observed species richness (see Fig. A1 in supplemental materials).
-Figure2-
3.1.2 Evenness as independent variable
Overall, positive rz effect size of the relationship between temporal variation in species
number and evenness was observed only at the scale of the site (Fig. 3a,b). Positive strength rz
values were observed for soft sediment (SD) habitats and NA region at the quadrat scale, while at the scale of the site, positive rz–values were observed for ER habitats and for both
NA and ME regions. Slope β of the relationships followed similar trends as for the strength rz,
except from the NA region where β values were not significantly different from zero (Fig. 3a,b). When considering relationships between temporal changes within assemblages with evenness values, positive overall rz was only observed with community structure analyses at
the scale of the site (Fig. 3c-f). ER habitats as well as the ME region showed positive rz for
the latter analysis (Fig. 3d) while data from SD habitats always showed positive rz values for
all multivariates analyses (both in structure and composition data at both scales; Fig. 3c-f). Inversely, temporal changes in community composition were negatively related to evenness for ER habitat and ME region (Fig. 3e). All multivariate analyses for rz and β followed same
trends (Fig. 3c-f) with an exception for SD habitats at the scale of the quadrat (Fig 3c), where
rz was positive but β not.
-Figure 3-
9
Diversity was not linked to temporal variation in total community abundance (total % cover or density). Overall strength rz and slope β effect sizes of relationships between temporal
variations in community total abundance (density or % cover) and both species richness (S) and evenness (J’) were not significant (Fig. 4a-d) at all scales. Positive strength rz and slope β
with S was however observed for SD habitat (both scales) and NA region (scale of the site only) (Fig. 4a,b). Temporal variation in total abundance was positively correlated with J’ for rock pool habitat at both scales (Fig. 4c,d) as shown by positive rz and slope β effect sizes.
-Figure 4-
3.3 Heterogeneity among data set (sampling effort and duration effect)
The duration of the studies did not affect the values of strength rz and slope β in any of the
analyses (see Supplemental material, appendix 3). The sampling effort, determined as composite variable of number of dates and samples per date, negatively affected rz from
analyses of temporal changes in community structure (quadrat: p-value = 0.0255) and composition (quadrat: p = 0.0114; site: p = 0.0049) that used species richness as an independent variable. Sampling effort did not affect effect sizes in analyses of temporal variation in richness with evenness as the independent variable and all analyses of temporal variation in total abundance. Slope β-values were not affected by sampling effort in any of the analyses (results not shown).
Diversity indices measured at the scale of the quadrat versus indices measured at that of the site were correlated (average ±SE of Pearson’s r coefficient per data set: species richness: 0.71 ± 0.04; evenness: 0.71 ± 0.07). However, richness and evenness measures were weakly positively correlated at the scale of quadrat (r = 0.36 ± 0.08) and at the scale of the site (r = 0.11 ± 0.08).
4.
Discussion
This study has highlighted that, in most cases, temporal variability in the number of taxa is positively related to diversity measures in marine benthic coastal assemblages. These results suggest that greater diversity leads to less stability (inversely related to temporal variability). Variations in species abundance and composition within communities and temporal variation in total community abundance were, however, generally not linked to species richness and
10
evenness. In addition, the diversity-stability relationships were scale dependent and varied across type of habitats and regions considered. The potential underlying mechanisms linking diversity measurements to stability are discussed below.
4.1 Temporal variation in species richness
Our results suggest that the overall stability in species richness is negatively related to diversity estimates (species richness, evenness and rarefaction index). To some extent, the observed negative relationship between species richness and stability in species richness may be explained by simple mean-variance scaling effect. However, positive relationships between other diversity indices (evenness and rarefaction index) and richness assessed at the scale of the site were consistent in our analysis. This strengthens the hypothesis that fluctuations within assemblages are closely controlled by their constituent species and their dominance structure.. Empirical and theoretical studies have generally shown that diversity levels affect variations in relative abundances, patterns of colonization and extinction rates (e.g. Inchausti and Halley, 2003; Solan et al., 2004), which, in turn, determine species richness variability. The cycle of colonization and local extinction of species, variation in species richness, are affected by processes that influence average population sizes and their temporal stability. Indeed, small or highly variable populations are more likely to become locally extinct (Shaffer, 1981; Pimm et al., 1988; Inchausti and Halley, 2003; Melbourne and Hastings, 2008).
The identity of species within communities undoubtedly plays an important role since more diverse communities are more likely to include species or functional groups (McCann, 2000) that can affect the function or properties of the whole community (i.e. sampling effect, Huston, 1997; Tilman et al., 1997). Outcomes from various studies of temporal variation in species richness have led to different results. Simulation studies have demonstrated that species variation (turnover) is reduced with increasing richness when high number of taxa may either facilitate colonization or reduce extinction of present species, or when environmental conditions are variable (Shurin, 2007). In contrast, higher temporal stability (assessed as low values of the coefficient of variation) in species richness was associated with low richness and evenness values in New Zealand sandflat sites (Thrush et al., 2008). These results were explained by strong connections between functional groups in species-poor communities.
11
4.2 Temporal variation in abundance
Stability in total abundance of community was generally not linearly linked to species richness nor evenness indices. Balvanera et al. (2006) also failed to observe significant relationships between stability (as natural variation) and diversity, although using different measure of stability and data sets that study did not exclusively represent marine habitat. Temporal variability of aggregated community (total abundance, total biomass, etc.) or population (density, biomass) properties are preferred response variables used in studies of diversity-stability relationships and most of the relationships were negative (Stachowicz et al., 2007; Valdivia and Molis, 2009). Many mechanistic approaches were identified to interpret theoretical and empirical outcomes from relationships between variability of such aggregated variable and diversity measures (e.g. Petchey et al., 2002; de Mazancourt et al., 2013). In particular, different non-exclusive mechanisms were reported to regulate the link between diversity and stability: the statistical averaging (Doak et al., 1998; "portfolio effect" Tilman et al., 1998); negative covariances among populations (Tilman et al., 1998); asynchrony in response to environmental fluctuation (Ives and Hughes, 2002) and overyielding (Tilman, 1999). These mechanisms have been considered important to shape the relationship between diversity and stability of above-ground biomass (Grman et al., 2010), total abundances in marine hard bottom communities (Benedetti-Cecchi, 2009; Bulleri et al., 2012) and production in grassland plants (Isbell et al., 2009; de Mazancourt et al., 2013). Increasing the number of taxa present in a community would reduce mean and variance in the total community abundance and, then statistically reduce community variance (see Cottingham et al., 2001). On the contrary, rich communities may also increase average strength among species favouring competitive exclusion and enhancing abundance fluctuations. Even if mean-variance scaling effects were present, intrinsic community properties such as negative covariance in species occurrence could lead to lower temporal variation at sites with higher species richness. Several empirical studies have highlighted the role of dominant species traits for the function of the whole community. For example, lower variability of dominant species than subordinate species may affect the whole community stability (Polley et al., 2007; Grman et al., 2010; Sasaki and Lauenroth, 2011; Valdivia et al., 2013).
The results of the present study also suggest that communities from different habitats exhibit different diversity-stability relationships. While data from emergent rocky habitats exhibited no relationship, richness decreased stability of sandy community abundances while evenness decreased stability in rock pool community abundances (see Fig. 4). If poor correlation
12
between richness and evenness measures at each scale may partly explain this, inherent differences exist in forces that structure communities among habitats. Strong interactions, mainly competition, among species in soft sediments are largely limited to the provision of biogenic habitat communities that are commonly maintained in early successional stages by frequent physical and biological disturbances. Competitive displacement and exclusion are generally less frequent in sediment habitats compared to hard-bottom ones (Peterson, 1979; Black and Peterson, 1988). Following the work of Danovaro et al. (2008) in deep sea sediments, Loreau (2008) suggested that infaunal species, through the reworking of sediments could generate a prevalence of positive species interactions in soft sediments (in contrast to hard-bottoms, cf Noël, 2007; Benedetti-Cecchi, 2009) leading to complementarity effects (Loreau, 2000). Positive covariance, which is observed when species fluctuate synchronously in response to environmental change, is widespread (Houlahan et al., 2007; Valone and Barber, 2008) and contributes to increase variability in total abundance. However when present, the compensatory dynamics among intertidal species that contribute to stability has a lower effect in high latitude where environmental forcing may prevail on biological interactions (Bulleri et al., 2012). While rock pools are benign environments compared to emergent rock in term of physical stress (i.e. desiccation, see Noël, 2007), they can be much more heavily grazed (e.g. Benedetti-Cecchi et al., 2005). This high grazing pressure observed in rock pools may change the nature of interactions between species from competition to facilitation (Bertness and Callaway, 1994) and increase the number of grazer resistant-species (Noël et al., 2009). If stabilizing effects of species richness on community abundances were observed in rock pool mesocosms (Romanuk and Kolasa, 2002), the effect of evenness still remains unclear.
4.3 Temporal variation within communities
Using multivariate analyses, we found that stability (measured with Bray-Curtis dissimilarities) of species abundance and composition within communities are generally not correlated with diversity indices. Our results suggest that relationships between diversity and community stability may be governed by evenness rather than the number of species (cf. Fig. 2 and 3). Moreover, contrasting results among habitats exist, with sediment communities with high evenness being less stable, perhaps from prevalence of positive species interactions in this habitat previously discussed. Theoretical studies have revealed that relationships between community variability in composition and number of taxa may increase, decrease or remain unchanged mainly due to the type of calculation of variability used but also stochastic
13
processes that alter patterns of dominance and total abundance among species (Stevens et al., 2003). Among other results, Stevens et al (2003) reported that simulated community variation in composition, given that total abundance stay equal, would show positive correlation with evenness. Our empirical observations would give only little support to these predictions (see Fig. 3e). At high dominance (or low evenness), it was observed that stability in species composition within a community may be either enhanced on emergent rocky shores or become reduced on sediment shores (see Fig 3e). Results from empirical studies have also contradictory outcomes showing that various measures of grassland diversity (including species richness and evenness) can enhance (Frank and McNaughton, 1991) or decrease stability (Rodriguez and Gomez, 1994, while no effect was recorded for J') measured by temporal variance in compositional richness. Moreover, in contrast to our study, Mykrä et al. (2011) observed that stability within assemblage in streams is promoted by species richness, although this relationship disappeared when compositional stability was related to species richness estimated with a rarefaction index that standardized abundance.
4.4 Scale of observation
Many rich benthic communities are actually composed by rare species (Gray, 2000; Gray et al., 2005; Ellingsen et al., 2007). Uncommon species are theoretically important to maintain ecosystem functions in the context of the insurance hypothesis (Yachi and Loreau, 1999) and are important to ensure community persistence and resilience (Hillebrand et al., 2008). Spatial species distributions are highly heterogeneous at various scales (e.g. Chapman et al., 2010; Kraufvelin et al., 2011). Indeed, variations in the number of taxa may be influenced by a combination of random spatial and temporal sampling errors that cause species, particularly those that are either sparse or rare, to be included or not in a patch (McArdle et al., 1990; de Juan and Hewitt, 2014). The recent work of de Juan and Hewitt (2014) illustrated how seasonality and inter annual sampling schemes may affect variability in species composition and species accumulation profiles. In our study, care was taken to select data sets with sampling dates spread among seasons or within years. There was no effect of the duration of the studies on effect sizes measured, but seasonal variations within studies may have influenced our overall results. Patterns of diversity in small patches have been identified as potential contributors to ecological stability (Frank and McNaughton, 1991), but the consistency seen in our results at both quadrat and site scales indicates that mechanisms not related to heterogeneity among patches may dominate and create the observed patterns. It has
14
been generally accepted that regional species pools may regulate the species richness seen at smaller scales (e.g. Ricklefs, 1987; Witman et al., 2004; Kotta and Witman, 2009).
When data sets were analysed separately, a large proportion of the observed relationships between stability and biodiversity were weak or not significant. For example, in the analyses shown in Fig 2a, only 5 data sets out of 28 showed significant relationships and 6 show correlation coefficients over 0.5 (Table A1). The observed significant results with combined data sets illustrate the importance of using robust meta-analytical tools to investigate such hypotheses. Nonetheless, more data from soft sediments and rock pool habitats are needed to generate more conclusive results. The available data sets in this study were to some extent over-represented in the Mediterranean region and in the emergent rock habitat. Indeed, the Mediterranean region was solely represented by studies on emergent rock. On the other hand, consistent results between Mediterranean and North Atlantic results for emergent rock were seen. Large scale comparison of diversity effects on ecosystem processes may be masked systematically by the effects of variation in environmental variables on these processes and may lead to erroneous conclusions (Loreau, 1998, 2008).
5. Concluding remarks
This study provides one of the few comprehensive assessments of large spatial scale variation in the relationship between diversity and temporal stability across different marine systems. Our results suggest that diverse assemblages enhance variability in species richness without affecting variability in species abundance and composition within community. The use of complementary diversity indices (e.g. richness and evenness) over various time series warrants the generation of robust stability-diversity analyses. Despite the caveat resulting from incomplete and unevenly distributed data, it has been highlighted that the scale of observation needs to be considered in diversity-stability studies and outcomes may also depend on the habitats and the biogeographic systems considered (e.g. North-Atlantic or western Mediterranean). Conversely, there are needs to extend the analyses shown here to more sites (and time series) in order to generate better pictures across habitats. Targeted long-term observations and experiments are undoubtedly important to unravel effects of environmental variables, species interaction strength within assemblages and potential effect of climate changes on biodiversity and the functioning of ecosystems. Nevertheless, where sufficient data sets exist, a meta-analysis like the one presented here can provide a
cost-15
effective approach to clarifying and generating further hypotheses about diversity-stability relationships.
Acknowledgments
We are gratefully indebted to Carlo Heip for his outstanding achievements in the leadership of European research into marine biodiversity. We would like to acknowledge all participating institutions in BIOFUSE project and all participants that helped in field sampling, identifying species as well as by providing data and advice and comments on the manuscript. The BIOFUSE project, led by TP Crowe and L Benedetti-Cecchi, has been carried out in the framework of the MarBEF Network of Excellence 'Marine Biodiversity and Ecosystem Functioning' which was funded by the Sustainable Development, Global Change and Ecosystems Programme of the European Community's Sixth Framework Programme (contract #GOCE-CT-2003-505446), which was coordinated by Carlo Heip. Additional funding was provided by partner institutions. During the writing, M Cusson was supported by the Natural Sciences and Engineering Research Council of Canada (NSERC; Discovery Grants).
References
Anderson, M.J., 2005. PERMANOVA: a FORTRAN computer program for permutational multivariate analysis of variance. Department of Statistics, University of Auckland, New Zealand., Auckland.
Balvanera, P., Pfisterer, A.B., Buchmann, N., He, J.S., Nakashizuka, T., Raffaelli, D., Schmid, B., 2006. Quantifying the evidence for biodiversity effects on ecosystem functioning and services. Ecol. Lett. 9, 1146-1156.
Benedetti-Cecchi, L., 2009. Mechanisms underpinning diversity-stability relationships in hard bottom assemblages, in: Wahl, M. (Ed.), Hard Bottom Communities: Patterns, Scales, Dynamics, Functions, Shifts. Springer Verlag, Berlin.
Benedetti-Cecchi, L., Vaselli, S., Maggi, E., Bertocci, I., 2005. Interactive effects of spatial variance and mean intensity of grazing on algal cover in rock pools. Ecology 86, 2212-2222.
Bertness, M.D., Callaway, R., 1994. Positive interactions in communities. Trends Ecol. Evol. 9, 191-193.
Bertocci, I., Maggi, E., Vaselli, S., Benedetti-Cecchi, L., 2005. Contrasting effects of mean intensity and temporal variation of disturbance on a rocky seashore. Ecology 86, 2061-2067.
Black, R., Peterson, C.H., 1988. Absence of preemption and interference competition for space between large suspension-feeding bivalves and smaller infaunal macroinvertebrates. J. Exp. Mar. Biol. Ecol. 120, 183-198.
Bulleri, F., Benedetti-Cecchi, L., Cusson, M., Maggi, E., Arenas, F., Aspden, R., Bertocci, I., Crowe, T.P., Davoult, D., Eriksson, B.K., Fraschetti, S., Gollety, C., Griffin, J.N., Jenkins, S.R., Kotta, J., Kraufvelin, P., Molis, M., Pinto, I.S., Terlizzi, A., Valdivia, N., Paterson,
16
D.M., 2012. Temporal stability of European rocky shore assemblages: variation across a latitudinal gradient and the role of habitat-formers. Oikos 121, 1801-1809.
Chapman, M., Tolhurst, T., Murphy, R., Underwood, A., 2010. Complex and inconsistent patterns of variation in benthos, micro-algae and sediment over multiple spatial scales. Mar. Ecol. Prog. Ser. 398, 33-47.
Connell, J.H., 1978. Diversity in tropical rain forest and coral reefs. Science 199, 1302-1310. Cottingham, K.L., Brown, B.L., Lennon, J.T., 2001. Biodiversity may regulate the temporal
variability of ecological systems. Ecol. Lett. 4, 72-85.
Danovaro, R., Gambi, C., Dell'Anno, A., Corinaidesi, C., Fraschetti, S., Vanreusel, A., Vincx, M., Gooday, A.J., 2008. Exponential decline of deep-sea ecosystem functioning linked to benthic biodiversity loss. Curr. Biol. 18, 1-8.
de Juan, S., Hewitt, J., 2014. Spatial and temporal variability in species richness in a temperate intertidal community. ECOGRAPHY 37, 183-190.
de Mazancourt, C., Isbell, F., Larocque, A., Berendse, F., De Luca, E., Grace, J.B.,
Haegeman, B., Wayne Polley, H., Roscher, C., Schmid, B., Tilman, D., van Ruijven, J., Weigelt, A., Wilsey, B.J., Loreau, M., 2013. Predicting ecosystem stability from
community composition and biodiversity. Ecol. Lett. 16, 617-625.
Doak, D.F., Bigger, D., Harding, E.K., Marvier, M.A., O'Malley, R.F., Thomson, D.H., 1998. The statistical inevitability of stability - diversity relationships in community ecology. Am. Nat. 151, 264-276.
Donohue, I., Petchey, O.L., Montoya, J.M., Jackson, A.L., McNally, L., Viana, M., Healy, K., Lurgi, M., O'Connor, N.E., Emmerson, M.C., 2013. On the dimensionality of ecological stability. Ecol. Lett. 16, 421-429.
Ellingsen, K.E., Hewitt, J.E., Thrush, S.F., 2007. Rare species, habitat diversity and functional redundancy in marine benthos. J. Sea Res. 58, 291-301.
Elton, C.S., 1958. The ecology of invasions by animals and plants. Wiley, London, U.K. Frank, D.A., McNaughton, S.J., 1991. Stability Increases with Diversity in Plant
Communities: Empirical Evidence from the 1988 Yellowstone Drought. Oikos 62, 360-362.
Gotelli, N.J., Colwell, R.K., 2001. Quantifying biodiversity: procedures and pitfalls in the measurement and comparison of species richness. Ecol. Lett. 4, 379-391.
Gray, J.S., 2000. The measurement of marine species diversity, with an application to the benthic fauna of the Norwegian continental shelf. Journal of Experimental Marine Biology and Ecology 250, 23 - 49.
Gray, J.S., Bjorgesaeter, A., Ugland, K.I., 2005. The impact of rare species on natural assemblages. J. Anim. Ecol. 74, 1131-1139.
Grman, E., Lau, J.A., Schoolmaster, D.R., Gross, K.L., 2010. Mechanisms contributing to stability in ecosystem function depend on the environmental context. Ecol. Lett. 13, 1400-1410.
Gurevitch, J., Curtis, P.S., Jones, M.H., 2001. Meta-analysis in ecology. Adv. Ecol. Res. 32, 199-247.
Hector, A., Joshi, J., Scherer-Lorenzen, M., Schmid, B., Spehn, E.M., Wacker, L.,
Weilenmann, M., Bazeley-White, E., Beiekuhnlein, C., Caldeira, M.C., Dimitrakopoulos, P.G., Finn, J.A., Huss-Danell, K., Jumpponen, A., Leadley, P.W., Loreau, M., Mulder, C.P.H., Neßhöver, C., Palmborg, C., Read, D.J., Siamantziouras, A.S.D., Terry, A.C., Troumbis, A.Y., 2007. Biodiversity and ecosystem functioning: reconciling the results of experimental and observational studies. Func. Ecol. 21, 998-1002.
Hedges, L.V., Olkin, I., 1985. Statistical methods for meta-analysis. Academic Press, Orlando.
17
Hillebrand, H., 2004. On the generality of the latitudinal diversity gradient. Am. Nat. 163, 192-211.
Hillebrand, H., Bennett, D.M., Cadotte, M.W., 2008. Consequences of dominance: A review of evenness effects on local and regional ecosystem processes. Ecology 89, 1510-1520. Hillebrand, H., Watermann, F., Karez, R., Berninger, U.G., 2001. Differences in species
richness patterns between unicellular and multicellular organisms. Oecologia 126, 114-124.
Houlahan, J.E., Currie, D.J., Cottenie, K., Cumming, G.S., Ernest, S.K.M., Findlay, C.S., Fuhlendorf, S.D., Gaedke, U., Legendre, P., Magnuson, J.J., McArdle, B.H., Muldavin, E.H., Noble, D., Russell, R., Stevens, R.D., Willis, T.J., Woiwod, I.P., Wondzell, S.M., 2007. Compensatory dynamics are rare in natural ecological communities. Proc. Natl. Acad. Sci. USA 104, 3273-3277.
Hughes, A.R., Byrnes, J.E., Kirnbro, D.L., Stachowicz, J.J., 2007. Reciprocal relationships and potential feedbacks between biodiversity and disturbance. Ecol. Lett. 10, 849-864. Hurlbert, S.H., 1971. Nonconcept of species diversity - critique and alternative parameters.
Ecology 52, 577-586.
Huston, M.A., 1997. Hidden treatments in ecological experiments: Re-evaluating the ecosystem function of biodiversity. Oecologia 110, 449-460.
Inchausti, P., Halley, J., 2003. On the relation between temporal variability and persistence time in animal populations. J. Anim. Ecol. 72, 899-908.
Isbell, F.I., Polley, H.W., Wilsey, B.J., 2009. Biodiversity, productivity and the temporal stability of productivity: patterns and processes. Ecol. Lett. 12, 443-451.
Ives, A.R., Hughes, J.B., 2002. General relationships between species diversity and stability in competitive systems. Am. Nat. 159, 388-395.
Kondoh, M., 2001. Unifying the relationships of species richness to productivity and disturbance. Proc R Soc B 268, 269-271.
Kotta, J., Witman, J.D., 2009. Diversity patterns and their causes. Regional scale patterns. , in: Wahl, M. (Ed.), Hard Bottom Communities: Patterns, Scales, Dynamics, Functions, Shifts. Springer Verlag, Berlin.
Kraufvelin, P., Perus, J., Bonsdorff, E., 2011. Scale-dependent distribution of soft-bottom infauna and possible structuring forces in low diversity systems. Mar. Ecol. Prog. Ser. 426, 13-28.
Levine, J.M., D'Antonio, C.M., 1999. Elton revisited: A review of evidence linking diversity and invasibility. Oikos 87, 15-26.
Li, B.-L., Charnov, E.L., 2001. Diversity-stability relationships revisited: scaling rules for biological communities near equilibrium. Ecological Modelling 140, 247-254.
Loreau, M., 1998. Biodiversity and ecosystem functioning: a mechanistic model. Proc. Natl. Acad. Sci. USA 95, 5632-5636.
Loreau, M., 2000. Biodiversity and ecosystem functioning: Recent theoretical advances. Oikos 91, 3-17.
Loreau, M., 2008. Biodiversity and ecosystem functioning: The mystery of the deep sea. Current Biology 18, R126-R128.
Loreau, M., de Mazancourt, C., 2013. Biodiversity and ecosystem stability: a synthesis of underlying mechanisms. Ecol. Lett. 16, 106-115.
Loreau, M., Naeem, S., Inchausti, P., Bengtsson, J., Grime, J.P., Hector, A., Hooper, D.U., Huston, M.A., Raffaelli, D., Schmid, B., Tilman, D., Wardle, D.A., 2001. Biodiversity and ecosystem functioning: current knowledge and future challenges. Science 294, 804-808. MacArthur, R., 1955. Fluctuations of animal populations and a measure of community
18
May, R.M., 1974. Stability and complexity in model ecosystems. Princeton University Press, Princeton, NJ, USA.
McArdle, B.H., Gaston, K.J., Lawton, J.H., 1990. Variation in the Size of Animal Populations - Patterns, Problems and Artifacts. J. Anim. Ecol. 59, 439-454.
McCann, K.S., 2000. The diversity–stability debate. Nature 405, 228-233.
McGrady-Steed, J., Morin, P.J., 2000. Biodiversity, density compensation, and the dynamics of populations and functional groups. Ecology 81, 361-373.
Melbourne, B.A., Hastings, A., 2008. Extinction risk depends strongly on factors contributing to stochasticity. Nature 454, 100-103.
Mykrä, H., Heino, J., Oksanen, J., Muotka, T., 2011. The stability–diversity relationship in stream macroinvertebrates: influences of sampling effects and habitat complexity. Freshwater Biology 56, 1122-1132.
Noël, L.M.-L.J., 2007. Species interactions during succession in rockpools: Role of herbivores and physical factors. University of Plymouth, p. 210.
Noël, L.M.L.J., Hawkins, S.J., Jenkins, S.R., Thompson, R.C., 2009. Grazing dynamics in intertidal rockpools: Connectivity of microhabitats. Journal of Experimental Marine Biology and Ecology 370, 9-17.
Petchey, O.L., Casey, T., Jiang, L., McPhearson, P.T., Price, J., 2002. Species richness, environmental fluctuations, and temporal change in total community biomass. Oikos 99, 231-240.
Peterson, C.H., 1979. Predation, competitive exclusion, and diversity in the soft-sediment benthic communities of estuaries and lagoons, in: Livingston, R.J. (Ed.), Ecological processes in coastal and marine systems. Plenum Press, New York, pp. 223-264.
Pimm, S.L., Jones, H.L., Diamond, J., 1988. On the risk of extinction. Am. Nat. 132, 757-785. Polley, H.W., Isbell, F.I., Wilsey, B.J., 2013. Plant functional traits improve diversity-based
predictions of temporal stability of grassland productivity. Oikos 122, 1275-1282.
Polley, H.W., Wilsey, B.J., Derner, J.D., 2007. Dominant species constrain effects of species diversity on temporal variability in biomass production of tallgrass prairie. Oikos 116, 2044-2052.
Raffaelli, D., 2004. How extinction patterns affect ecosystems. Science 306, 1141-1142. Raffaelli, D., 2006. Biodiversity and ecosystem functioning: issues of scale and trophic
complexity. Mar. Ecol. Prog. Ser. 311, 285–294.
Ricklefs, R.E., 1987. Community Diversity: Relative Roles of Local and Regional Processes. Science 235, 167-171.
Rodriguez, M.A., Gomez, S.A., 1994. Stability may decrease with diversity in grassland communities: Empirical evidence from the 1986 Cantabrian Mountains (Spain) drought. Oikos 71, 177-180.
Romanuk, T.N., Kolasa, J., 2002. Environmental variability alters the relationship between richness and variability of community abundances in aquatic rock pool microcosms. Ecoscience 9, 55-62.
Rosenberg, M.S., Adams, D.C., Gurevitch, J., 2000. MetaWin: Statistical Software for Meta-Analysis, Version 2.0 ed. Sinauer Associates, Sunderland, Massachusetts.
Sanders, H.L., 1968. Marine benthic diversity - A comparative study. Am. Nat. 102, 243-282. SAS, 1999. The SAS system for Windows. Release 8.02 Edition, Release 8.02 Edition ed.
SAS Institute Inc, Cary, NC.
Sasaki, T., Lauenroth, W.K., 2011. Dominant species, rather than diversity, regulates temporal stability of plant communities. Oecologia 166, 761-768.
Shaffer, M.L., 1981. Minimum Population Sizes for Species Conservation. BioScience 31, 131-134.
19
Shurin, J.B., 2007. How is diversity related to species turnover through time? Oikos 116, 957-965.
Shurin, J.B., Arnott, S.E., Hillebrand, H., Longmuir, A., Pinel-Alloul, B., Winder, M., Yan, N.D., 2007. Diversity–stability relationship varies with latitude in zooplankton. Ecol. Lett. 10, 127-134.
Solan, M., Cardinale, B.J., Downing, A.L., Engelhardt, K.A.M., Ruesink, J.L., Srivastava, D.S., 2004. Extinction and Ecosystem Function in the Marine Benthos. Science 306, 1177-1180.
Stachowicz, J.J., Bruno, J.F., Duffy, E., 2007. Understanding the Effects of Marine Biodiversity on Communities and Ecosystems. Ann. Rev. Ecol. Syst. 38, 739-766. Stevens, M.H.H., Petchey, O.L., Smouse, P.E., 2003. Stochastic relations between species
richness and the variability of species composition. Oikos 103, 479-488.
Thrush, S.F., Coco, G., Hewitt, J.E., 2008. Complex positive connections between functional groups are revealed by neural network analysis of ecological time series. Am. Nat. 171, 669-677.
Tilman, D., 1996. Biodiversity: Population versus ecosystem stability. Ecology 77, 350-363. Tilman, D., 1999. The ecological consequences of changes in biodiversity: A search for
general principles. Ecology 80, 1455-1474.
Tilman, D., Downing, J.A., 1994. Biodiversity and stability in grasslands. Nature 367, 363-365.
Tilman, D., Lehman, C.L., Bristow, C.E., 1998. Diversity-stability relationships: Statistical inevitability or ecological consequence? Am. Nat. 151, 277-282.
Tilman, D., Lehman, C.L., Thomson, K.T., 1997. Plant Diversity and Ecosystem
Productivity: Theoretical Considerations. Proc. Natl. Acad. Sci. USA 94, 1857-1861. Valdivia, N., González, A.E., Manzur, T., Broitman, B.R., 2013. Mesoscale Variation of
Mechanisms Contributing to Stability in Rocky Shore Communities. PLoS ONE 8, e54159.
Valdivia, N., Molis, M., 2009. Observational evidence of a negative biodiversity-stability relationship in intertidal epibenthic communities. Aquatic Biology 4, 263-271.
Valone, T.J., Barber, N.A., 2008. An empirical evaluation of the insurance hypothesis in diversity-stability models. Ecology 89, 522-531.
Vogt, R.J., Romanuk, T.N., Kolasa, J., 2006. Species richness-variability relationships in multi-trophic aquatic microcosms. Oikos 113, 55-66.
Whittaker, R.J., Willis, K.J., Field, R., 2001. Scale and species richness: towards a general, hierarchical theory of species diversity. Journal of Biogeography 28, 453-470.
Wilsey, B.J., Chalcraft, D.R., Bowles, C.M., Willig, M.R., 2005. Relationships among indices suggest that richness is an incomplete surrogate for grassland biodiversity. Ecology 86, 1178-1184.
Witman, J.D., Etter, R.J., Smith, F., 2004. The relationship between regional and local species diversity in marine benthic communities: A global perspective. Proc. Natl. Acad. Sci. USA 101, 15664-15669.
Yachi, S., Loreau, M., 1999. Biodiversity and ecosystem productivity in a fluctuating environment: The insurance hypothesis. Proc. Natl. Acad. Sci. USA 96, 1463-1468.
20
Figure captions
Figure 1. Approximate location of sampling areas (with data set number, see Table 1)
included in this study. Multiple sites were sampled in each area. Full circle: emergent rock habitat; open circle: rock pool; triangle: soft sediment; diamond: artificial substrata (PVC-panels).
Figure 2. Mean effect size (± 95% CI) for overall effect (All data: All), by habitat (Sediment:
SD; Emergent rock: ER; Rock pool: RP), and by region (North Atlantic: NA; Mediterranean: ME) of the relationship strength rz (black circle) and slope β (open circle) between temporal
variability and species richness. Effect sizes are displayed by type of analyses (species richness variability: A, B; community assemblage variability in: structure C, D and composition E, F) and scale of richness measure (average by patch scale as Quadrat: A, C, E; total by shore as Site: B, D, F). Brackets with * indicate significant (P < 0.05) heterogeneity of effect sizes among categories. Significant effects where CIs do not overlap with zero line. Note that negative values indicate a positive stability-diversity relationship while positive values do the opposite.
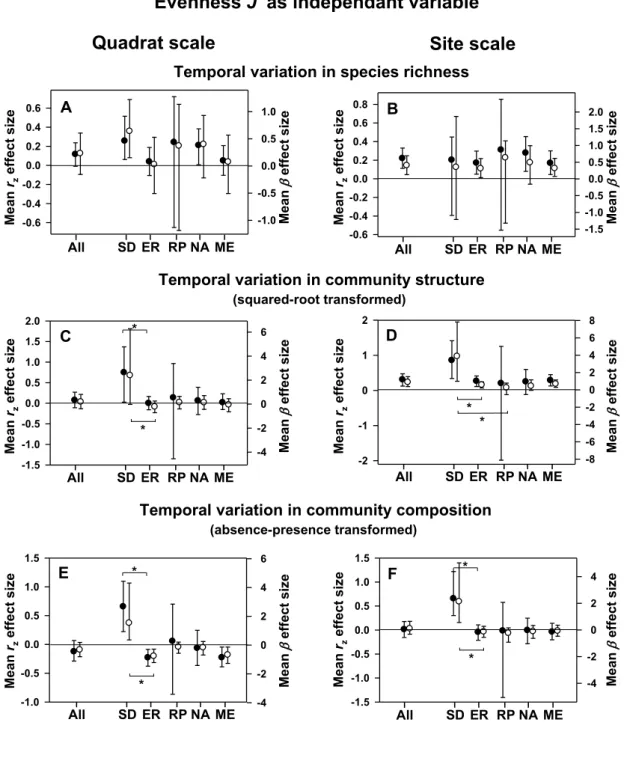
Figure 3. Mean effect size (± 95% CI) for overall effect, by habitat and by region of the
relationship strength rz (black circle) and slope β (open circle) between temporal variability
and evenness J’. Effect sizes are displayed by type of analyses (species richness variability: A, B; community assemblage variability in: structure C, D and composition E, F) and scale of evenness measure (average by patch scale as Quadrat: A, C, E; reassessed by shore as Site: B, D, F). See Figure 2 for abbreviations.
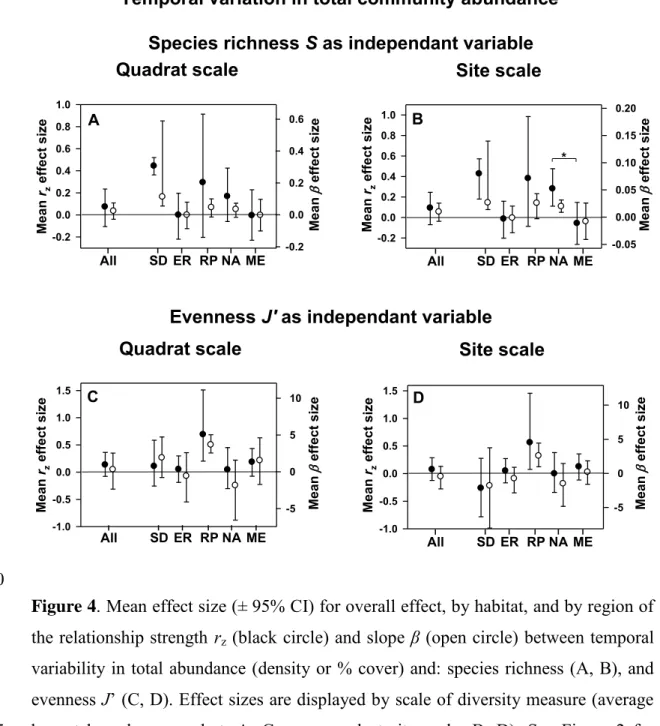
Figure 4. Mean effect size (± 95% CI) for overall effect, by habitat, and by region of the
relationship strength rz (black circle) and slope β (open circle) between temporal variability in
21
Effect sizes are displayed by scale of diversity measure (average by patch scale as quadrat: A, C; reassessed at site scale: B, D). See Figure 2 for abbreviations.
Figure A1. Mean effect size (± 95% CI) for overall effect, by habitat, and by region of the
relationship strength rz (black circle) and slope β (open circle) between temporal variability
and expected richness E(Sn) at the scale of site. Effect sizes are displayed by type of analysis (species richness variability: A; community assemblage variability in: structure: B; and composition: C). See Figure 2 for abbreviations.
22
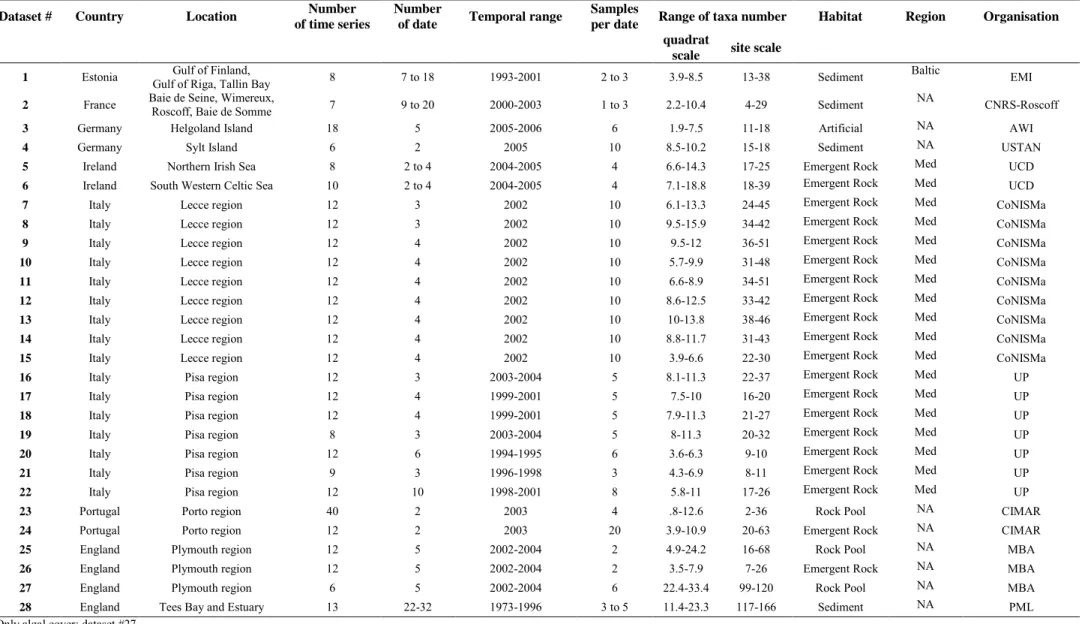
Table 1. List of data sets included in the meta-analysis. Number of time series refers to the number site for which samples were taken over many
dates. Number of date refers to number of sampling occasion. Region category: NA: North Atlantic; Med: Mediterranean.
Dataset # Country Location Number
of time series
Number
of date Temporal range
Samples
per date Range of taxa number Habitat Region Organisation
quadrat
scale site scale
1 Estonia Gulf of Riga, Tallin Bay Gulf of Finland, 8 7 to 18 1993-2001 2 to 3 3.9-8.5 13-38 Sediment Baltic EMI 2 France Baie de Seine, Wimereux, Roscoff, Baie de Somme 7 9 to 20 2000-2003 1 to 3 2.2-10.4 4-29 Sediment NA CNRS-Roscoff 3 Germany Helgoland Island 18 5 2005-2006 6 1.9-7.5 11-18 Artificial NA AWI 4 Germany Sylt Island 6 2 2005 10 8.5-10.2 15-18 Sediment NA USTAN 5 Ireland Northern Irish Sea 8 2 to 4 2004-2005 4 6.6-14.3 17-25 Emergent Rock Med UCD 6 Ireland South Western Celtic Sea 10 2 to 4 2004-2005 4 7.1-18.8 18-39 Emergent Rock Med UCD 7 Italy Lecce region 12 3 2002 10 6.1-13.3 24-45 Emergent Rock Med CoNISMa 8 Italy Lecce region 12 3 2002 10 9.5-15.9 34-42 Emergent Rock Med CoNISMa 9 Italy Lecce region 12 4 2002 10 9.5-12 36-51 Emergent Rock Med CoNISMa 10 Italy Lecce region 12 4 2002 10 5.7-9.9 31-48 Emergent Rock Med CoNISMa 11 Italy Lecce region 12 4 2002 10 6.6-8.9 34-51 Emergent Rock Med CoNISMa 12 Italy Lecce region 12 4 2002 10 8.6-12.5 33-42 Emergent Rock Med CoNISMa 13 Italy Lecce region 12 4 2002 10 10-13.8 38-46 Emergent Rock Med CoNISMa 14 Italy Lecce region 12 4 2002 10 8.8-11.7 31-43 Emergent Rock Med CoNISMa 15 Italy Lecce region 12 4 2002 10 3.9-6.6 22-30 Emergent Rock Med CoNISMa 16 Italy Pisa region 12 3 2003-2004 5 8.1-11.3 22-37 Emergent Rock Med UP 17 Italy Pisa region 12 4 1999-2001 5 7.5-10 16-20 Emergent Rock Med UP 18 Italy Pisa region 12 4 1999-2001 5 7.9-11.3 21-27 Emergent Rock Med UP 19 Italy Pisa region 8 3 2003-2004 5 8-11.3 20-32 Emergent Rock Med UP 20 Italy Pisa region 12 6 1994-1995 6 3.6-6.3 9-10 Emergent Rock Med UP 21 Italy Pisa region 9 3 1996-1998 3 4.3-6.9 8-11 Emergent Rock Med UP 22 Italy Pisa region 12 10 1998-2001 8 5.8-11 17-26 Emergent Rock Med UP 23 Portugal Porto region 40 2 2003 4 .8-12.6 2-36 Rock Pool NA CIMAR 24 Portugal Porto region 12 2 2003 20 3.9-10.9 20-63 Emergent Rock NA CIMAR 25 England Plymouth region 12 5 2002-2004 2 4.9-24.2 16-68 Rock Pool NA MBA 26 England Plymouth region 12 5 2002-2004 2 3.5-7.9 7-26 Emergent Rock NA MBA 27 England Plymouth region 6 5 2002-2004 6 22.4-33.4 99-120 Rock Pool NA MBA 28 England Tees Bay and Estuary 13 22-32 1973-1996 3 to 5 11.4-23.3 117-166 Sediment NA PML
Only algal cover: dataset #27 Intertidal zone : #2, 4-6, 17-27
23 -30° -30° 0° 0° 30° 30° 45° 60° 5 25-27 28 2 1 7-15 3 23,24 16-22 4 6
Figure 1. Approximate location of sampling areas (with data set number, see Table 1)
5
included in this study. Multiple sites were sampled in each area. Full circle: emergent rock habitat; open circle: rock pool; triangle: soft sediment; diamond: artificial substrata (PVC-panels).
24
Quadrat scale Site scale
Temporal variation in community structure
(squared-root transformed) 0.0 0.5 1.0 1.5 0.0 0.1 0.2 0.3 0.4 0.5 0.0 0.5 1.0 1.5 -0.01 0.00 0.01 0.02 0.03 0.04 0.05 A Mean rz ef fect si ze B Mean rz ef fect si ze -1.0 -0.5 0.0 0.5 1.0 1.5 -0.15 -0.10 -0.05 0.00 0.05 0.10 0.15 0.20 -1 0 1 -0.04 -0.02 0.00 0.02 0.04 0.06 C D Mean ef fect si ze Mean ef fect si ze Mean rz ef fect si ze Mean rz ef fect si ze Mean ef fect si ze Mean ef fect si ze Mean rz ef fect si ze Mean rz ef fect si ze Mean ef fect si ze Mean ef fect si ze -1.0 -0.8 -0.6 -0.4 -0.2 0.0 0.2 0.4 0.6 -0.15 -0.10 -0.05 0.00 0.05 E -1.0 -0.8 -0.6 -0.4 -0.2 0.0 0.2 0.4 0.6 -0.02 -0.01 0.00 0.01 F
Species richness S as independant variable
All SD ER RP NA ME All SD ER RP NA ME
All SD ER RP NA ME All SD ER RP NA ME
All SD ER RP NA ME All SD ER RP NA ME
Temporal variation in species richness
* *
Temporal variation in community composition
(absence-presence transformed)
10
Figure 2. Mean effect size (± 95% CI) for overall effect (All data: All), by habitat
(Sediment: SD; Emergent rock: ER; Rock pool: RP), and by region (North Atlantic: NA; Mediterranean: ME) of the relationship strength rz (black circle) and slope β
(open circle) between temporal variability and species richness. Effect sizes are displayed by type of analyses (species richness variability: A, B; community 15
assemblage variability in: structure C, D and composition E, F) and scale of richness measure (average by patch scale as Quadrat: A, C, E; total by shore as Site: B, D, F). Horizontal brackets with * indicate significant (P < 0.05) heterogeneity of effect sizes among categories. Significant effects where CIs do not overlap with zero line. Note that negative values indicate a positive stability-diversity relationship while positive 20
25 Temporal variation in community structure
(squared-root transformed)
Temporal variation in species richness
Temporal variation in community composition
(absence-presence transformed) -0.6 -0.4 -0.2 0.0 0.2 0.4 0.6
Quadrat scale Site scale
Evenness J' as independant variable
-1.0 -0.5 0.0 0.5 1.0 Mean rz ef fect si z e Mean ef fect si z e A -1.5 -1.0 -0.5 0.0 0.5 1.0 1.5 2.0 -4 -2 0 2 4 6 C -2 -1 0 1 2 -8 -6 -4 -2 0 2 4 6 8 D -1.0 -0.5 0.0 0.5 1.0 1.5 -4 -2 0 2 4 6 E -0.6 -0.4 -0.2 0.0 0.2 0.4 0.6 0.8 -1.5 -1.0 -0.5 0.0 0.5 1.0 1.5 2.0 Mean rz ef fect si z e Mean ef fect si z e Mean rz ef fect si z e Mean ef fect si z e Mean rz ef fect si z e Mean ef fect si z e Mean rz ef fect si z e Mean ef fect si z e Mean rz ef fect si z e Mean ef fect si z e B -1.5 -1.0 -0.5 0.0 0.5 1.0 1.5 -4 -2 0 2 4 * F * * * * * * * All SD ER RP NA ME All SD ER RP NA ME All SD ER RP NA ME All SD ER RP NA ME All SD ER RP NA ME All SD ER RP NA ME
Figure 3. Mean effect size (± 95% CI) for overall effect, by habitat and by region of
the relationship strength rz (black circle) and slope β (open circle) between temporal
variability and evenness J’. Effect sizes are displayed by type of analyses (species 25
richness variability: A, B; community assemblage variability in: structure C, D and composition E, F) and scale of evenness measure (average by patch scale as Quadrat: A, C, E; reassessed by shore as Site: B, D, F). See Figure 2 for abbreviations.
26 -0.2 0.0 0.2 0.4 0.6 0.8 1.0 Mean rz ef fect si ze Mean ef fect si ze All SD ER RP NA ME -0.2 0.0 0.2 0.4 0.6
Temporal variation in total community abundance
Quadrat scale Site scale
Species richness S as independant variable
A -0.2 0.0 0.2 0.4 0.6 0.8 1.0 All SD ER RP NA ME Mean rz ef fect si ze Mean ef fect si ze -0.05 0.00 0.05 0.10 0.15 0.20 B
Evenness J' as independant variable
Quadrat scale Site scale
-1.0 -0.5 0.0 0.5 1.0 1.5 -5 0 5 10 All SD ER RP NA ME Mean rz ef fect si ze Mean ef fect si ze -1.0 -0.5 0.0 0.5 1.0 1.5 -5 0 5 10 All SD ER RP NA ME Mean rz ef fect si ze Mean ef fect si ze * C D 30
Figure 4. Mean effect size (± 95% CI) for overall effect, by habitat, and by region of
the relationship strength rz (black circle) and slope β (open circle) between temporal
variability in total abundance (density or % cover) and: species richness (A, B), and evenness J’ (C, D). Effect sizes are displayed by scale of diversity measure (average by patch scale as quadrat: A, C; reassessed at site scale: B, D). See Figure 2 for 35