HAL Id: hal-00297811
https://hal.archives-ouvertes.fr/hal-00297811
Submitted on 23 Jun 2006HAL is a multi-disciplinary open access
archive for the deposit and dissemination of sci-entific research documents, whether they are pub-lished or not. The documents may come from teaching and research institutions in France or abroad, or from public or private research centers.
L’archive ouverte pluridisciplinaire HAL, est destinée au dépôt et à la diffusion de documents scientifiques de niveau recherche, publiés ou non, émanant des établissements d’enseignement et de recherche français ou étrangers, des laboratoires publics ou privés.
NirS-containing denitrifier communities in the water
column and sediment of the Baltic Sea
S. Falk, M. Hannig, G. Braker, R. Wardenga, M. Köster, K. Jürgens, C.
Gliesche
To cite this version:
S. Falk, M. Hannig, G. Braker, R. Wardenga, M. Köster, et al.. NirS-containing denitrifier communities in the water column and sediment of the Baltic Sea. Biogeosciences Discussions, European Geosciences Union, 2006, 3 (3), pp.697-727. �hal-00297811�
BGD
3, 697–727, 2006 Denitrifier communities in the Baltic Sea S. Falk et al. Title Page Abstract Introduction Conclusions References Tables Figures J I J I Back CloseFull Screen / Esc
Printer-friendly Version Interactive Discussion
Biogeosciences Discuss., 3, 697–727, 2006 www.biogeosciences-discuss.net/3/697/2006/ © Author(s) 2006. This work is licensed under a Creative Commons License.
Biogeosciences Discussions
Biogeosciences Discussions is the access reviewed discussion forum of Biogeosciences
NirS-containing denitrifier communities in
the water column and sediment of the
Baltic Sea
S. Falk1,3, M. Hannig2, G. Braker3, R. Wardenga1,4, M. K ¨oster1, K. J ¨urgens2, and C. Gliesche1
1
Institute for Ecology, Ernst-Moritz-Arndt-University Greifswald, Schwedenhagen 6, 18565 Kloster, Hiddensee, Germany
2
Baltic Sea Research Institute, Seestrasse 15, 18119 Warnem ¨unde, Germany
3
Max Planck Institute for Terrestrial Microbiology, Karl-von-Frisch-Str., 35043 Marburg, Germany
4
Institute for Chemistry and Biochemistry, Ernst-Moritz-Arndt-University, Soldmannstraße 16, 17487 Greifswald, Germany
Received: 7 April 2006 – Accepted: 19 April 2006 – Published: 23 June 2006 Correspondence to: G. Braker ([email protected])
BGD
3, 697–727, 2006 Denitrifier communities in the Baltic Sea S. Falk et al. Title Page Abstract Introduction Conclusions References Tables Figures J I J I Back CloseFull Screen / Esc
Printer-friendly Version Interactive Discussion
Abstract
The aim of this study was to compare structural differences in the denitrifying micro-bial communities along the environmental gradients observed in the water column and coastal sediments of the Baltic Sea. To link community structure and environmen-tal gradients, denitrifier communities were analyzed by terminal restriction fragment
5
length polymorphism (T-RFLP) based on nirS as a functional marker gene for deni-trification. NirS-type denitrifier community composition was further evaluated by phy-logenetic analysis of nirS sequences from clone libraries. T-RFLP analysis indicated some overlap but also major differences of communities from the water column and the sediment. Shifts in community composition along the biogeochemical gradients
10
were observed only in the water column while denitrifier communities were rather uni-form within the upper 30 mm of the sediment. Specific terminal restriction fragments (T-RFs) indicative for the sulfidic zone suggest the presence of nitrate-reducing and sulfide-oxidizing microorganisms that were previously shown to be important at the suboxic-sulfidic interface in the water column of the Baltic Sea. Phylogenetic
analy-15
sis of nirS genes from the Baltic Sea and of sequences from marine habitats all over the world indicated distinct denitrifier communities that grouped mostly according to their habitat. We suggest that these subgroups of denitrifiers had developed after se-lection through several factors, i.e. their habitats (water column or sediment), impact by prevalent environmental conditions and isolation by large geographic distances
be-20
tween habitats.
1 Introduction
The Baltic Sea is one of the largest brackish water systems in the world (Meyer-Reil et al., 2000). After the last glaciation the Baltic Sea has been connected continuously with the Atlantic Ocean over the past 8000 years via the Danish straits (Sohlenius et
25
BGD
3, 697–727, 2006 Denitrifier communities in the Baltic Sea S. Falk et al. Title Page Abstract Introduction Conclusions References Tables Figures J I J I Back CloseFull Screen / Esc
Printer-friendly Version Interactive Discussion
salt water supply from the North Sea. Water exchange with the North Sea depends on wind-induced movements (Meyer-Reil et al., 2000) and mainly affects the upper layers of the water column while water exchange in the deeper layers is quite rare and occurs approximately once in a decade (Feistel et al., 2003a, b; Nausch et al., 2003). In the Gotland Deep, one of the deepest basins (250 m depth) in the central Baltic Sea,
well-5
mixed surface water is separated from dense bottom waters by a halocline at about 70 m depth (Kotilainen et al., 2002). This barrier leads to frequent anoxic conditions in deeper waters and to accumulations of sulfide (S2−) that diffuses out of the sediment. Therefore, low oxygen (O2) and sulfidic conditions with concurrent availability of nitrate (NO−3) at the suboxic-sulfidic interface can be found in the water column (Brettar and
10
Rheinheimer, 1991; Hannig et al., 2006a).
Thus, conditions in the water column should be adequate for denitrification and it has been assumed that water column denitrification contributes significantly to the nitro-gen budget of the Baltic Sea (R ¨onner and S ¨orensen, 1985). Significant denitrification activity has indeed been proven for the suboxic-sulfidic interface, indicating
sulfide-15
driven chemoautotrophic denitrification (Brettar and Rheinheimer, 1991; Hannig et al., 2006b1).
Cultivation-independent approaches based on analysis of functional marker genes for denitrification revealed the lowest denitrifier diversity in the suboxic-sulfidic inter-face in the central Baltic (Hannig et al., 2006a). In contrast, cultivation-dependent
ap-20
proaches showed the highest diversity and density of heterotrophic denitrifying bacte-ria (Brettar et al., 2001) with a predominance of Shewanella baltica and Pseudomonas sp. (Brettar and H ¨ofle, 1993; H ¨ofle and Brettar, 1996) in that interface. Furthermore, an
ε-proteobacterium, related to Thiomicrospira denitrificans was identified as an
impor-tant chemolithoautothrophic sulfide-oxidizer and nitrate-reducer (Labrenz et al., 2004;
25
H ¨ofle et al., 2005) and suggested to be predominantly responsible for autotrophic den-1
Hannig, M., Lavik, G., Kuypers, M. M. M., Woebken, D., Martens-Habbena, W., and J ¨urgens, K.: Shift from denitrification to anammox after inflow events in the central Baltic Sea, submitted, 2006b.
BGD
3, 697–727, 2006 Denitrifier communities in the Baltic Sea S. Falk et al. Title Page Abstract Introduction Conclusions References Tables Figures J I J I Back CloseFull Screen / Esc
Printer-friendly Version Interactive Discussion
itrification in the Gotland Deep (Brettar et al., 2006).
Heterotrophic and autotrophic denitrifiers reduce oxidized nitrogen compounds NO−3 and nitrite (NO−2) to the gaseous intermediates nitric oxide and nitrous oxide and to dinitrogen gas as the end product in a dissimilatory process. Denitrifying bacteria are phylogenetically widespread, thus a 16S rRNA gene-based approach is inappropriate
5
to explore the communities of organisms belonging to this functional group. NirK and
nirS, coding for copper and cytochrome cd1-containing nitrite reductase, respectively were used as functional marker genes to target denitrifiers in PCR-based approaches (Braker et al., 1998). Both enzymes are functionally equivalent and catalyse the re-duction of NO−2 to NO, which is the key reaction in denitrification (Zumft, 1997). These
10
genes have been targeted to study denitrifier communities in a variety of habitats such as soils (Avrahami et al., 2002; Priem ´e et al., 2002), aquifers (Santoro et al., 2006) waste water treatment plants (Throb ¨ack et al., 2004) and marine habitats (Braker et al., 2000; Liu et al., 2003; Jayakumar et al., 2004; Castro-Gonz ´alez et al., 2005; Hannig et al., 2006a). Studies of these communities in marine habitats indicated that denitrifier
15
diversity and community structure in the water column and sediments of the world’s oceans were at least in part determined by environmental gradients of O2, NO−3, NO−2 and S2− (Liu et al., 2003; Castro-Gonzal ´es et al., 2005; Hannig et al., 2006a).
Although data on denitrifier diversity in different aquatic and terrestrial habitats are rapidly accumulating, the principle differences in denitrifier composition between
sed-20
iment and water column are not known. The Baltic Sea is an ideal system for this comparison of denitrifier community structure as gradients in O2, NO−3 and S2− occur both in the water column (e.g., in the central basins), at the scale of meters, and in coastal sediments (e.g. in the Bodden in the southern Baltic Sea), at scales of mm to cm. The Bodden at the “Nordr ¨ugensche Boddenkette” are formed by the accumulation
25
of sand, which separates areas of shallow water from the outer Baltic Sea (Meyer-Reil et al., 2000). The water column in these shallow water areas is mixed thoroughly, therefore anoxic conditions occur only in the sediments. There is evidence that coastal sediments are very important in removal of riverborne nitrogen by denitrification (Voss
BGD
3, 697–727, 2006 Denitrifier communities in the Baltic Sea S. Falk et al. Title Page Abstract Introduction Conclusions References Tables Figures J I J I Back CloseFull Screen / Esc
Printer-friendly Version Interactive Discussion
et al., 2005). Denitrification rates have been measured in Baltic sediments (e.g. cen-tral Gulf of Finland) using the isotope pairing method (Tuominen et al., 1998). It re-vealed that the bulk of denitrification was coupled to NO−3 production by nitrification. However, in the Bodden sediment only low amounts of NO−3 were produced by nitri-fication at the aerobic-anaerobic interface resulting in low summertime denitrinitri-fication
5
rates in this area (Dahlke, 1990). Besides denitrification, also anaerobic ammonium oxidation (anammox) contributes to nitrogen loss in coastal sediments (Thamdrup and Dalsgaard, 2002; Risgaard-Petersen et al., 2004).
Here, we studied communities of denitrifiers in the water column of the central Baltic Sea and in coastal sediments by applying the functional marker gene nirS amplified
10
from community DNA. Shifts in nirS-type denitrifier communities along biogeochemical gradients were analysed by terminal restriction fragment length polymorphism anal-ysis (T-RFLP) as a fingerprint technique. Additionally, nirS genes from the Bodden sediment were cloned, sequenced and included into a phylogenetic tree comprising all nirS sequences from marine habitats available from public databases. Analysis of
15
these sequence data suggests that the heterogeneity of nirS genes is driven by the different ecological niches that the respective marine denitrifiers occupy. These niches seem to be defined by the habitat, water column or sediment, shaped by the prevalent environmental conditions, and can be isolated by large geographic distances.
2 Material and methods
20
2.1 Study area and sampling
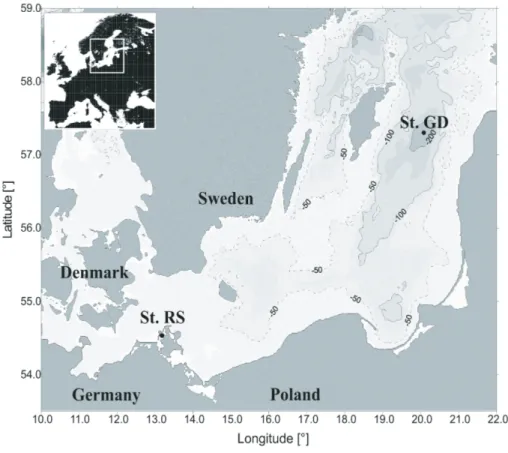
Two different sites in the Baltic Sea were studied, namely Rassower Strom which is lo-cated in the “Nordr ¨ugensche Boddengew ¨asser” (54◦330N; 13◦120E) for sediment sam-pling, and the Gotland Deep (240 m water depth) in the central Baltic Sea (Baltic Sea monitoring station 271; 57◦190N, 20◦030E) for water column sampling (Fig. 1). Water
25
BGD
3, 697–727, 2006 Denitrifier communities in the Baltic Sea S. Falk et al. Title Page Abstract Introduction Conclusions References Tables Figures J I J I Back CloseFull Screen / Esc
Printer-friendly Version Interactive Discussion
sediment samples were taken in July 2004 at the Rassower Strom, a shallow water coastal inlet of the southern Baltic Sea (4 m water depth). Since the water column in these shallow water areas is continuously mixed by wind, anoxic conditions occur only in the sediments. Sampling at the Gotland Deep was performed on board of the R/V “A. v. Humboldt” with a rosette water sampler (5 l) mounted on a Seabird CTD-system
5
measuring profiles of temperature, conductivity, O2, fluorescence and turbidity. For DNA extraction, seawater was filtered immediately after sampling through Durapore® filters (0.2 µm; Millipore, Billerica, MA, USA). The filters were snap-frozen in sterile re-action tubes in liquid nitrogen and stored at −20◦C. Sediment samples were collected on board of the ship R/V “Prof. F. Gessner” with a multicorer (Black et al., 2002). Two
10
subsets of samples were analyzed from the same core. First, subsamples from the top 3 cm according to the oxic layer (0 to 5 mm depth), the suboxic layer (5 to 12 mm depth), and the sulfidic layer (12 to 30 mm depth) were taken for PCR amplification and cloning of nirS genes. A second set of subsamples was obtained by slicing the sediment at 1, 2, 5, 7, and 10 cm depth. The corresponding layers (0 to 1, 1 to 2, 2
15
to 5, 5 to 7 and 9 to 10 cm) were homogenized and used for T-RFLP analysis of nirS genes. Measurements of chemical parameters and DNA extractions were performed within 1 h after sampling.
2.2 Determination of chemical parameters in samples from the water column and sediment from the Baltic Sea
20
Oxygen (O2), ammonium (NH+4), sulfide (S2−) concentrations and pH were determined for samples from both sampling sites. In water samples, O2 was measured by the Winkler method as described by Grasshoff (1983). Ammonium was determined in the water column with the modified indophenolblue method of Koroleff (1983), where NO−3 is reduced to NO−2 by a copper cadmium column and determined as NO−2 (Grasshoff,
25
1983). Sulfide was measured photometrically by the modified methylene blue method of Fonselius (1983).
BGD
3, 697–727, 2006 Denitrifier communities in the Baltic Sea S. Falk et al. Title Page Abstract Introduction Conclusions References Tables Figures J I J I Back CloseFull Screen / Esc
Printer-friendly Version Interactive Discussion
In the sediment samples O2and S2−concentrations and pH were measured with mi-crosensors only in the upper 3 cm, whereas NO−3 and NO−2were measured at all depths using an ion chromatograph (Sykam, F ¨urstenfeldbruck, Germany). Microsensor-based measurements of O2, S2−, and pH were performed to describe spatial small-scale vari-ations in the sediments. Measurements of dissolved O2 were done with fiber-optic
5
microsensors (type B2, tip diameter <50 µm; PreSens GmbH, Regensburg, Germany) connected to an O2-meter (Microx TX2; PreSens GmbH). Dissolved S2− was mea-sured with a potentiometric Ag/Ag2S electrode (tip diameter of 140 µm; Revsbech et al., 1983) modified according to Cypionka (1986). The S2−-sensor was connected to a mV-meter (3403 True RMS Voltmeter; Hewlett Packard, B ¨oblingen, Germany). An
10
ion-selective pH-minielectrode (tip diameter of 1 mm; Toepffer Lab System PHM-146, G ¨oppingen, Germany) was connected to a pH-meter. The microsensors were mounted together on a computer-controlled motorized micromanipulator (M ¨arzh ¨auser GmbH, Wetzlar, Germany) and inserted stepwise into the sediment. Porewater for analyses of NO−3 and NO−2 was gained by centrifugation. Nitrate and NO−2 were measured by ion
15
chromatography (Sykam) at a wavelength of 220 nm.
2.3 Nucleic acid extraction from water and sediment samples
Nucleic acid extraction for all water samples from frozen filters was performed as de-scribed by Weinbauer et al. (2002). DNA and RNA were obtained by mechanical and chemical extraction using glass beads and sodium lauryl sarcosinate-phenol. Prior to
20
PCR, DNA extracts were purified from RNA by incubation with RNase I (Roche Di-agnostics, Mannheim, Germany) for 30 min at 37◦C, and DNA concentrations were determined using a NanoDrop ND-1000 spectrophotometer (NanoDrop Technologies, Inc., Rockland, ME, USA).
From sediment samples (0.5 g), DNA was extracted adding 0.5 g glass beads,
25
900 µl extraction buffer (Kramer and Singleton, 1993) and 100 µl acid-washed polyvinylpolypyrrolidone (PVPP; Sigma-Aldrich, Deisenhofen, Germany; Ogram et al.,
BGD
3, 697–727, 2006 Denitrifier communities in the Baltic Sea S. Falk et al. Title Page Abstract Introduction Conclusions References Tables Figures J I J I Back CloseFull Screen / Esc
Printer-friendly Version Interactive Discussion
1998). First, cells were lysed by freezing (30 min, −70◦C) and thawing (65◦C, 5 min) with concurrent shaking of the suspension at 1000 rpm (Thermomixer; Eppendorf, Hamburg, Germany). In addition, cells were disrupted by bead beating twice for 30 s at 5.5 m s−1 (Fastprep Celldisrupter; Bio101, Carlsbad, CA, USA) and centrifuged at 12 000×g at 4◦C for 1 min. With the supernatant two extraction steps were performed:
5
(1) with phenol-chloroform-isoamylalcohol [24:24:1, v/v/v (volume in volume in volume)] and (2) with chloroform-isoamylalcohol (24:1, v/v). Afterwards the DNA was concen-trated by ethanol precipitation (2 volumes of 96% ethanol, 1/10 volume of sodium ac-etate, 30 min at −70◦C) and centrifuged (16 000×g, 15 min, 4◦C). The pellet was sus-pended in 50 µl sterile aqua bidest. Humic acids were removed with PVPP columns
10
(Ogram et al., 1998; Mendum et al., 1998) and the QIAqick Purification Kit (Qiagen, Hilden, Germany).
2.4 PCR amplification
Amplification of nirS genes was done with the primer pair nirS1F and nirS6R (MWG Biotech, Ebersberg, Germany) as described by Braker et al. (1998). NirS was amplified
15
in a total volume of 25 µl containing 1 µl of environmental DNA, 2.5 µl of 400 ng BSA (Roche, Mannheim, Germany) µl−1, 200 µM of each desoxyribonucleoside triphos-phate (Roche Applied Science, Mannheim, Germany) and 1.25 U Red AccuTaq DNA polymerase (Sigma, Taufkirchen, Germany). PCRs were performed in a 9700 thermal cycler (Perkin-Elmer Cetus, Norwalk, CT, USA) or in an iCycler iQ (Biorad Laboratories,
20
Inc., Hercules, CA, USA) with conditions modified according to Braker et al. (2000) and Braker et al. (2001). “Touchdown”-PCR started with 57◦C until it reached 52.5◦C in the first ten cycles. Additional 25 cycles were performed at an annealing temperature of 55◦C. For water samples the same program was used except that 26 cycles were performed with an annealing temperature of 56◦C.
25
Aliquots of 100 µl PCR products were loaded on 1.5% [w/v (weight/volume)] agarose gels (SeaKem®LE agarose; Cambrex Bio Science, Rockland, ME, USA) and
sepa-BGD
3, 697–727, 2006 Denitrifier communities in the Baltic Sea S. Falk et al. Title Page Abstract Introduction Conclusions References Tables Figures J I J I Back CloseFull Screen / Esc
Printer-friendly Version Interactive Discussion
rated by electrophoresis (120 V, 45 min). Bands were visualised by UV excitation after staining with ethidium bromide (0.5 mg l−1). Bands of the expected size were excised from the gel and purified using the QIAquick gel extraction kit (Qiagen, Hilden, Ger-many).
2.5 Terminal restriction fragment length polymorphism (T-RFLP) analysis for
sedi-5
ment and water samples
For T-RFLP analysis the primer nirS1F was 50-end labelled with 6-carboxyfluorescein (MWG Biotech, Ebersberg, Germany). The purified PCR products were digested with 0.3 U of the restriction enzyme HhaI [GCG’C] at 37◦C over night according to the manu-facturer’s instructions (Promega, Madison, WI, USA). Digested products were cleaned
10
with Autoseq G-50 columns (Amersham Biosciences, Chalfont St. Giles, UK) accord-ing to the manufacturer’s instructions. Aliquots of the digest (2 µl) were mixed with 12 µl deionised formamide (Applera, Darmstadt, Germany) and 0.2 µl of an internal DNA fragment length standard (X-Rhodamine MapMarker® 30–1000 bp; BioVentures, Murfreesboro, TN, USA). Terminal restriction fragments (T-RFs) were separated with
15
an automated DNA sequencer (ABI 310, Applied Biosystems, Darmstadt, Germany). The length of fluorescently labelled T-RFs was determined by comparison with the in-ternal standard using GeneScan 3.71 software (Applied Biosystems).
2.6 Analysis of terminal restriction fragments (T-RFs)
Peaks ≥60 units of fluorescence from different samples were normalized by an iterative
20
standardization procedure (Dunbar et al., 2001). The relative abundance of T-RFs in percent was determined by calculating the ratio between the heights of a given peak and the normalized total peak height of each sample. Richness of each sample cor-responds to the number of T-RFs. Commonly used diversity indices, namely Shannon diversity and Shannon evenness index, were calculated:
BGD
3, 697–727, 2006 Denitrifier communities in the Baltic Sea S. Falk et al. Title Page Abstract Introduction Conclusions References Tables Figures J I J I Back CloseFull Screen / Esc
Printer-friendly Version Interactive Discussion
Shannon diversity index H:
H = −Xpi · log2pi (1)
Shannon evenness index J :
J= H
Hmax =
P pi · log2pi
P ˆpi · log2pˆi (2)
where pi is the proportion (relative abundance) of T-RF i in the community and ˆpi is
5
the equally distributed relative abundance. 2.7 Cloning and sequencing
Unlabelled PCR products (50 ng) of the sediment sample from the upper three centime-ters (0 to 5 mm, 5 to 12 mm, and 12 to 30 mm depth) were cloned using the TA Cloning Kit (Invitrogen, Paisley, UK) according to the manufacturer’s instructions. Clones were
10
screened for inserts of the proper size using vector specific primers (T7, M13). The inserts were sequenced as described previously by Avrahami et al. (2002).
2.8 Phylogenetic analysis
NirS clones were aligned to sequences from the EMBL database with the
ARB fast aligner feature. Phylogenetic analyses were performed with ARB
15
(http://www.arb-home.de). Trees were reconstructed with the distance matrix-based neighbour joining method (ARB) and the overall topology was confirmed by trees calculated with PROTPARS and PROTML (PHYLIP; Felsenstein, 1993). Nucleotide sequences retrieved from the Bodden sediments have been deposited in the EMBL database under accession numbers AM238454 to AM238510.
BGD
3, 697–727, 2006 Denitrifier communities in the Baltic Sea S. Falk et al. Title Page Abstract Introduction Conclusions References Tables Figures J I J I Back CloseFull Screen / Esc
Printer-friendly Version Interactive Discussion
3 Results
3.1 Field measurements
In the water column of the Gotland Deep oxygen (O2) decreased rapidly below the halocline (at a depth of 70 m) from 300 µM in the oxic layers to low concentrations (10– 50 µM) in the suboxic zone (80 to 220 m) (Fig. 2a). Oxygen was below the detection
5
limit (1 µM) at a depth of 220 m and in the sulfidic zone (225 to 232.5 m). While nitrate (NO−3) concentration was low in the oxic layers it increased below the halocline and highest concentrations (13 µM) were measured at a depth of 220 m. Below this depth NO−3 concentration declined rapidly. Nitrite (NO−2) concentration showed two peaks at depths of 55 m and 225 m. In contrast, ammonium (NH+4) was consistently low in the
10
upper water column and increased below 225 m. Sulfide (S2−) could be detected at a depth of 230 m, reaching 3.5 µM at 232.5 m.
In the coastal sediment sample O2 concentration decreased rapidly from 300 µM to 0 within the top 2 millimetres (Fig. 2b). Nitrite was detected at two depths (0 to 2 mm and 2 to 5 mm depth) with concentrations of 0.25 µM and 0.1 µM, respectively (data
15
not shown) and was below the detection limit below 5 mm depth. Nitrate concentra-tions in the overlying water were 0.26 µM whereas NO−3 in the sediment was below the detection limit in all layers. Sulfide started to accumulate in the sediment from a depth of 7 mm and reached its highest concentration (0.5 mM) at a depth of 30 mm.
3.2 Denitrifier community profiles along biogeochemical gradients
20
The communities of nirS-type denitrifiers from water samples (Gotland Deep) and coastal sediments (southern Baltic Sea) along the biogeochemical gradients at both sampling sites were analysed by T-RFLP of HhaI-digested nirS amplicons. The restric-tion endonuclease HhaI showed the highest level of resolurestric-tion compared to TaqI and
MspI as indicated by the highest number of peaks observed (data not shown). In total,
25
BGD
3, 697–727, 2006 Denitrifier communities in the Baltic Sea S. Falk et al. Title Page Abstract Introduction Conclusions References Tables Figures J I J I Back CloseFull Screen / Esc
Printer-friendly Version Interactive Discussion
with HhaI in samples from both sampling sites. Representative T-RFLP profiles for water column and sediment are shown in Fig. 3.
In the water column of the Gotland Deep, in total 16 different nirS T-RFs were found. Diversity (H, Shannon diversity) and evenness (E, Shannon evenness) levels were lowest (H=0.48; E=0.44) in the upper oxygenated zone and highest at depths from 100
5
to 200 m in the suboxic zone (H, 1.74 to 1.86; E, 0.84 to 0.90) (data not shown). In the suboxic zone changes in nirS-type denitrifier community structure were mainly based on changes in relative abundance of T-RFs. While the T-RF of 111 bp dominated the denitrifier community profile in the water column at 70 to 85 m, the relative abundance of the 36-bp T-RF increased with water depth and it became dominant at a depth of
10
200 m. A strong shift in the community structure occurred from 200 m (suboxic zone) to 225 m (start of sulfidic layers). In contrast to the suboxic zone, the 47-bp fragment was dominant in the sulfidic zone (225–232.5 m) (Fig. 3a). Some nirS T-RFs were specific for some layers of the water column at the Gotland Deep, i.e. those of 218, 295 and 380 bp. The majority of the T-RFs occurred at several depths but were unique to the
15
water column, i.e. T-RFs of 45, 47, 118, 120, 275, 299, 341, and 537 bp.
The occurrence and relative abundance of nirS T-RFs in the coastal sediment profiles was more homogenous (H, 0.95 to 1.34; E, 0.66 to 0.76) than in the water column. However, the occurrence of the T-RFs of 346, 97 and 240 bp was restricted to the sediment layers of 0 to 1, 1 to 2 and 9 to 10 cm depth, respectively (Fig. 3b). In total,
20
11 different T-RFs were detected in five different sediment layers (0 to 10 cm). The T-RFs of 36 and 111 bp, which occurred also in several depths of the water column, were predominant at all sediment depths. Many T-RFs were detected exclusively in the sediment samples, i.e. the 72-, 97-, 240-, 346-, 347-, and 385-bp T-RF. Several T-RFs i.e. those of 36, 107, 111, 238, and 273 bp occurred both in samples from sediment
25
BGD
3, 697–727, 2006 Denitrifier communities in the Baltic Sea S. Falk et al. Title Page Abstract Introduction Conclusions References Tables Figures J I J I Back CloseFull Screen / Esc
Printer-friendly Version Interactive Discussion
3.3 Phylogenetic affiliation of nirS sequences from marine habitats
A total of 57 nirS clones from environmental DNA, which were obtained from the coastal Baltic Sea sediment sample (BSS= Baltic Sea sediment), were included into a phylo-genetic tree (Fig. 4). NirS sequences from the Gotland Deep station had been gath-ered in 2003 (Hannig et al., 2006a) and were also considgath-ered (BS). Besides sequences
5
from taxonomically described isolates, the overall tree also included all nirS sequences of unknown affiliation retrieved from other marine systems that were available in the database. These sequences were retrieved from the water column of the eastern South Pacific (ESP, Castro-Gonzal ´es et al., 2005), the Arabian Sea (ASW, Jayakumar et al., 2003), and the Northern Baltic Sea (CBBS, Tuomainen et al., 2003) and sediments of
10
the Pacific Northwest (PNW, Braker et al., 2000) and the eastern tropical North Pacific (ETNP, Liu et al., 2004).
Phylogenetic analysis revealed seven major clusters of marine nirS sequences (ma-rine Clusters I–VII). The overall topology was supported by the parsimony and max-imum likelihood algorithm and clusters were defined if sequences were consistently
15
grouped together. Sequences from Baltic Sea sediment (BSS Clusters A to F) be-longed to seven subclusters of nirS genes (Fig. 4). The majority of BSS sequences (29) belonged to BSS Clusters A to E and were placed in marine Cluster I. This clus-ter also included nirS genes from marine sediments (PNW Clusclus-ters III and IV; ETNP Cluster Ib and Ic) and water column (ASW Clusters XI and XII; ESP Cluster I) as well
20
as sequences from the water column (BS) and from a cyanobacterial bloom (CBBS) from the Baltic Sea. An in-depth analysis of Cluster I-sequences showed that nirS sequences from the oxic (0 to 5 mm depth), anoxic (5 to 12 mm depth), and sulfidic zone (12 to 30 mm depth) of the Baltic Sea sediment were not clustered according to the prevalent environmental conditions in these zones (Fig. 5). In contrast, sequences
25
from all three zones were found distributed in several shared subclusters within Cluster I.
BGD
3, 697–727, 2006 Denitrifier communities in the Baltic Sea S. Falk et al. Title Page Abstract Introduction Conclusions References Tables Figures J I J I Back CloseFull Screen / Esc
Printer-friendly Version Interactive Discussion
several clusters from the ASW (Clusters IV, VII, VIII, IX), the ESP (Clusters IIa, IIb, IIc, III), and the Baltic Sea (BS Cluster IV, V, one sequence each from the BS and the CBBS). Marine Cluster II also comprised sequences from denitrifying isolates
(Pseu-domonas spp., Thauera mechernichensis, Azoarcus tolulyticus and marine isolates
affiliated with Marinobacter spp. and Halomonas variabilis).
5
Marine sequence Clusters III, IV, V, VI, and VII harboured no sequences from the Baltic Sea sediment but sequences from the water column of the Baltic Sea and from the other marine habitats. Cluster III contained sequences from the Baltic Sea (Cluster VIII) and the ESP (Cluster IV). Cluster IV contained nirS from the ASW (Clusters I, II and III), from the ETNP (Clusters Ia and Ib), and the Baltic Sea (Clusters VIa and VIb)
10
and nirS from Ralstonia eutropha. Marine nirS sequences from the Baltic Sea (Clus-ters VIIa and VIIb) and the ETNP (Cluster Ia) were related to those from Paracoccus
denitrificans and Roseobacter denitrificans. Most sequences found in Cluster VI
orig-inate from cultivated denitrifiers e.g. Thauera spp., Azoarcus spp. and Pseudomonas
stutzeri and related marine isolates. Sequences from the ETNP (Cluster Ic) and the
15
Baltic Sea (BS Cluster IX) were also grouped in this cluster. Marine Cluster VII con-sisted exclusively of nirS genes from clones from the Baltic Sea (Cluster X), the ASW (Cluster V) and the PNW (Cluster II).
4 Discussion
A number of studies to date have explored denitrifier communities from marine habitats
20
but they all were from distinct geographic locations. Either from the water column or sediment, they were separated by large geographic distances and presumably influ-enced by distinct environmental conditions. In this study nirS-type denitrifier commu-nities were explored from water column (Gotland Deep) and sediment samples (Ras-sower Strom, Bodden) of the Baltic Sea (Fig. 1). Despite comparably close geographic
25
location (550 km distance) both locations differed in salinity (Bodden, 7 to 9 psu; Got-land Deep, 7 to 13 psu) and anthropogenic influence (H ¨ubel et al., 1998). Common to
BGD
3, 697–727, 2006 Denitrifier communities in the Baltic Sea S. Falk et al. Title Page Abstract Introduction Conclusions References Tables Figures J I J I Back CloseFull Screen / Esc
Printer-friendly Version Interactive Discussion
both habitats are the strong gradients of biogeochemical parameters (Fig. 2).
Oxygenated surface water in the Gotland Deep is separated by a stable halocline from deeper waters at 60 to 70 m. This halocline prevents vertical mixing and results in long-lasting suboxic zones and sulfidic/anoxic conditions on top of the sediment. However, recently even deep layers of the Gotland Deep were provided with oxygen
5
(O2) because of several inflows of dense North Sea from summer 2002 till summer 2003 (Feistel et al., 2003a, b; Feistel et al., 2004). After disappearance of sulfide (S2−) in 2003, a newly developed redoxcline appeared during 2004 at a depth of 230 m where the concentration of nitrate (NO−3) decreased and that of S2− increased towards the sediment. In contrast, the sediment samples of the Bodden were anoxic below the first
10
2 mm. Sulfide appeared below a depth of 7 mm and accumulated at concentrations two orders of magnitude higher than in the water column. The accumulation of S2− in the anoxic layers of both habitats suggests active sulfate reducing microbial communities. 4.1 Denitrifier communities along vertical chemical gradients in the Baltic Sea water
column and sediment
15
Terminal restriction fragment length polymorphism (T-RFLP) of nirS amplicons has been successfully used as a fingerprinting method to analyse denitrifier community structure (Braker et al., 2001; Castro-Gonz ´alez et al., 2005; Hannig et al., 2006a). We focused on nirS as a functional marker gene to detect denitrifiers since amplification of
nirK was shown to fail occasionally for marine samples (Braker et al., 2000). Whether
20
this reflects primer bias or is of ecological relevance remains unknown. Furthermore, the majority of studies on marine denitrifier communities had focused on nirS, thus making comparisons between Baltic and other marine systems based on this gene more reasonable.
T-RFLP analysis of nirS genes demonstrated partial overlaps between water and
25
sediment communities but revealed also unexpected dissimilarities between commu-nities despite comparable physico-chemical gradients in the water column and the sediment. While community profiles from the water column showed strong vertical
BGD
3, 697–727, 2006 Denitrifier communities in the Baltic Sea S. Falk et al. Title Page Abstract Introduction Conclusions References Tables Figures J I J I Back CloseFull Screen / Esc
Printer-friendly Version Interactive Discussion
shifts, particularly from suboxic to sulfidic conditions, this was not the case for the sediment community profiles (Fig. 3). Minor changes in nirS-type denitrifier, Bacteria and Archaea community composition despite strong small-scale biogeochemical gra-dients were also observed with depth in a sediment core collected at Puget Sound, WA (Braker et al., 2001). Sequence analysis of clones from the Bodden sediment core
5
showed a comparably uniform community composition for the oxic, suboxic, and anoxic zone by grouping sequences in common subclusters (BSS Cluster A to F). This also agrees with nirS sequences retrieved from three layers of the Puget Sound sediment core clustering in a common Puget Sound cluster (Braker et al., 2000). In the Bodden, the low water level together with wind induced intermixture of the top sediment layers
10
leads to a physical input of O2 into the upper sediment. Furthermore, the sediment stratification and the distribution of porewater solutes (e.g. O2) can be influenced by bioturbation through feeding and locomotion activity of marine invertebrates. Thereby, O2is inserted into the anoxic sediment layers (Forster et al., 1995). After a bioturbation event, the observed chemical gradients, which are the result of differential metabolic
15
activities of microbial communities in the sediment, are re-established much faster than gradients in bacterial community structure.
In contrast, the water column zonation of denitrifier communities is probably more stable stratified as each layer extends across a range of several meters. The high-est level of diversity of cultivable denitrifying heterotrophic bacteria was found at the
20
suboxic-sulfidic interface in the water column of the Gotland Deep (Brettar et al., 2001). This was not visible by T-RFLP analysis which revealed approximately similar numbers of T-RFs in the different layers. With a concurrent accumulation of NO−3 in the water column the community structure shifted with depth from 85 to 200 m depth (Figs. 2 and 3). However, the most pronounced shift occurred with the transition from the suboxic
25
to the sulfidic zone. At the suboxic-sulfidic interface, with the frequent concurrence of NO−3 and H2S, autotrophic denitrification has been demonstrated (Brettar and Rhein-heimer, 1991; Hannig et al., 2006b1). Our community profiles, e.g. the dominance of the 47-bp T-RF and the appearance of the 273-bp T-RF, indicate that specific planktonic
BGD
3, 697–727, 2006 Denitrifier communities in the Baltic Sea S. Falk et al. Title Page Abstract Introduction Conclusions References Tables Figures J I J I Back CloseFull Screen / Esc
Printer-friendly Version Interactive Discussion
denitrifiers are adapted to thrive under sulfidic conditions. Similar shifts in denitrifier community composition and the appearance of abundant T-RFs specific for the sulfidic zone were recently observed for the water column at one station in the vicinity of the Gotland Deep in August and October 2003 (Hannig et al., 2006a).
Two dominant T-RFs (36 and 111 bp) were found in all layers of the sediment and
5
were identical to T-RFs dominating the oxygenated and the suboxic zones in the water column. The 273-bp T-RF seems to be indicative of denitrifier communities in sul-fidic environments as it was also found in the respective zones in the water column. This T-RF may hint on a more general occurrence of organisms capable of autotrophic nitrate reduction and sulfide oxidation, such as Thiomicrospira denitrificans-like
bac-10
teria. These ε-proteobacteria were identified as some of the dominant denitrifiers at the suboxic-sulfidic interface of the water column at the Gotland Deep (Labrenz et al., 2005; Brettar et al., 2006). Unfortunately, the nirS sequences of these organisms are not known so far and therefore this information was not available to be evaluated with our data.
15
4.2 Phylogeny of nirS sequences from marine environments
Community profiles were studied by T-RFLP based on cleavage of nirS PCR prod-ucts using a single restriction enzyme. This approach is suitable to analyse shifts in denitrifier communities along environmental gradients but may be limited due to the oc-currence of identical T-RFs that correspond to sequences from different clusters within
20
the nirS tree. A better resolution can be achieved by the use of different restriction enzymes (Osborn et al., 2006) or phylogenetic analysis of sequences from clones.
The phylogenetic tree (Fig. 4), containing most of the published nirS sequences from marine environments, showed that only few nirS sequences were similar to those from denitrifying isolates (e.g. in marine Cluster II: ASW Cluster VIII, 95.6 to 100%
iden-25
tical to Pseudomonas aeruginosa; ESP Cluster III, 93.7 to 96.9% identical to
Pseu-domonas fluorescens). Whether these genes were indeed derived from PseuPseu-domonas
BGD
3, 697–727, 2006 Denitrifier communities in the Baltic Sea S. Falk et al. Title Page Abstract Introduction Conclusions References Tables Figures J I J I Back CloseFull Screen / Esc
Printer-friendly Version Interactive Discussion
transfer among phylogenetically unrelated organisms is possible (Etchebehere and Tiedje, 2005). Therefore our results confirm that the marine environment is strongly dominated by diverse and novel nirS-type denitrifiers that are not cultured yet.
Most environmental nirS sequences grouped in separate subclusters according to the site from which they were obtained. Marine Cluster II consisted almost exclusively
5
of water column sequences with four sequences from the Bodden sediment as the sister group. Furthermore, sequences of marine Cluster III were obtained from the wa-ter column of the Baltic Sea and the easwa-tern South Pacific (ESP). The habitat, wawa-ter column or sediment, obviously has a strong impact on denitrifier community composi-tion. Nonetheless, there were also some interesting overlaps of denitrifier communities.
10
Only within marine Cluster I, water column and sediment sequences grouped within the same subclusters (Fig. 5). Three of them harboured sequences from both sites of the Baltic Sea, covering sequences from all sediment depths but only from the oxygenated zone of the water column. This is not surprising since horizontal currents lead to con-stant water exchange within the upper layers of the Baltic. Further, within the shallow
15
coastal areas a continuous exchange between sediments and overlying water occurs. Interestingly, a group of sequences from all depths of the Bodden sediment, grouping in marine Cluster I, were closely related to nirS genes found in a sediment core from Puget Sound, WA. Sediments from both locations share similar features, i.e. denitrifier communities were stable with depth within the core, and electron acceptors O2 and
20
NO−3 were consumed within the first few millimetres. However, no S2− was detected at these depths in the core from Puget Sound (A. H. Devol, personal communication). Only little nirS sequence overlap in denitrifier communities was observed for sediments at Puget Sound and offshore Washington coast (Braker et al., 2000). This was at-tributed to the isolation of microbial communities by large distances and to the degree
25
of degradation of the organic matter reaching the sediment. Distinct sediment char-acteristics at large geographic distances, differences in bottom topology at the metre scale and small scale (cm) differences due to meio- and macrofaunal abundance were shown to impact marine sediment denitrifier communities to an extent ranking in the
BGD
3, 697–727, 2006 Denitrifier communities in the Baltic Sea S. Falk et al. Title Page Abstract Introduction Conclusions References Tables Figures J I J I Back CloseFull Screen / Esc
Printer-friendly Version Interactive Discussion
order km>m>cm (Scala and Kerkhof, 2000). However, we conclude that in sediments with comparable environmental conditions similar nirS-type denitrifier communities can develop despite large geographic distances. Physico-chemical parameters (e.g. O2, NO−3, NO−2, NH+4, PO−34 , dissolved organic carbon, salinity) were shown to impact the composition and distribution of denitrifier communities (Liu et al., 2003;
Taroncher-5
Oldenburg et al., 2003; Jayakumar et al., 2004; Castro-Gonzal ´es et al., 2005; Hannig et al., 2006a). The nirS tree (Fig. 4) reveals that similar environmental conditions (with respect to O2, NO−3, and NO−2) in the water column of the distantly located ESP and the ASW also seem to have triggered the development of similar communities (ESP Cluster I and ASW Cluster XI, within marine Cluster I).
10
In conclusion, from the data base obtained so far it seems that distinct marine nirS-type denitrifier communities occupy different ecological niches which are defined by the habitat, water column or sediment, shaped by the prevalent environmental conditions, and can be isolated by large geographic distances. NirS subgroups are mostly site-specific but overlap if communities are impacted by similar environmental conditions. It
15
is evident that denitrifiers are widespread, occurring also in habitats in which denitrifica-tion is not possible, e.g. due to lack of NO−3, presence of O2or high S2−concentrations. However, all the DNA-based studies focus on elucidating the genetic potential for de-nitrification but they do not reveal whether these communities are actively denitrifying or not. Most cultured denitrifiers grow preferentially as heterotrophs in the presence
20
of O2but not as denitrifiers if possible. Other metabolic pathways must be active also in denitrifiers found deep in the sulfidic zone. Thus, the ability to denitrify is probably not the factor that exclusively selects for subgroups of denitrifier communities in the different habitats. We assume that the subclusters of closely related nirS sequences belong to the same bacterial taxa. These are adapted to a specific niche due to their
25
set of genetic and phenotypic characters among which the capacity for denitrification is only one. Nothing is known yet about the phylogenetic affiliation and ecophysio-logy of the organisms from which the novel nirS sequence types from marine habitats were retrieved. Future studies should therefore aim to combine different approaches
BGD
3, 697–727, 2006 Denitrifier communities in the Baltic Sea S. Falk et al. Title Page Abstract Introduction Conclusions References Tables Figures J I J I Back CloseFull Screen / Esc
Printer-friendly Version Interactive Discussion
in order to gain further insights in the adaptation and regulation of denitrifying commu-nities; for example, species-specific activity measurements and phylogenetic analysis, metagenomic libraries and cultivation-based studies.
Acknowledgements. The authors thank the officers, the crew and the scientists of the R/V
“A. v. Humboldt” and “Prof. F. Gessner” for assistance with sampling collection. M. Labrenz
5
and H. Brockm ¨uller are thanked for the help during sampling; S. Pfeiffer, B. Hambach and S. Kolbatsch-Weremtschuk did the nutrient measurements. K. B ¨unger, S. Fleissner, and K. Schwarz are acknowledged for technical assistance. The research was founded by grants from the University of Greifswald, the Baltic Sea Research Institute Warnem ¨unde and the Max-Planck-Society.
10
References
Andr ´en, E., Andr ´en, T., and Kunzendorf, H.: Holocene history of the Baltic Sea as a background for assessing records of human impact in the sediments of the Gotland Basin, The Holocene, 10, 687–702, 2000.
Avrahami, S., Conrad, R., and Braker, G.: Effect of soil ammonium concentration on N2O
15
release and on the community structure of ammonia oxidizers and denitrifiers, Appl. Environ. Microbiol., 68, 5685–5692, 2002.
Black, H. J., Dainat, M., K ¨oster, M., and Meyer-Reil, L.-A.: A multiple corer for taking virtually undisturbed samples from shallow water sediments, Estuar. Coast. Shelf Sci., 54, 45–50, 2002.
20
Braker, G., Ayala-del-R´ıo, H. L., Devol, A. H., Fesefeldt, A., and Tiedje, J. M: Community struc-ture of denitrifiers, bacteria, and archaea along redox gradients in Pacific Northwest marine sediments by terminal restriction fragment length polymorphism analysis of amplified nitrite reductase (nirS) and 16S rRNA genes, Appl. Environ. Microbiol., 67, 1893–1901, 2001. Braker, G., Fesefeldt, A., and Witzel, K.-P.: Development of PCR primer systems for
amplifica-25
tion of nitrite reductase genes (nirK and nirS) to detect denitrifying bacteria in environmental samples, Appl. Environ. Microbiol., 64, 3769–3775, 1998.
Braker, G., Zhou, J., Wu, L., Devol, A. H., and Tiedje, J. M.: Nitrite reductase genes (nirK and
nirS) as functional markers to investigate diversity of denitrifying bacteria in Pacific Northwest
marine sediment communities, Appl. Environ. Microbiol., 66, 2096–2104, 2000.
BGD
3, 697–727, 2006 Denitrifier communities in the Baltic Sea S. Falk et al. Title Page Abstract Introduction Conclusions References Tables Figures J I J I Back CloseFull Screen / Esc
Printer-friendly Version Interactive Discussion
Brettar, I. and H ¨ofle, M. G.: Nitrous oxide producing heterotrophic bacteria from the water column of the central Baltic: Abundance and molecular identification, Mar. Ecol. Prog. Ser., 94, 253–265, 1993.
Brettar, I., Labrenz, M., Flavier, S., B ¨otel, J., Kuosa, H., Christen, R., and H ¨ofle, M. G.: Iden-tification of a Thiomicrospira denitrificans-like epsilon proteobacterium as a catalyst for
au-5
totrophic denitrification in the central Baltic Sea, Appl. Environ. Microbiol., 72, 1364–1372, 2006.
Brettar, I., Moore, E. R. B., and H ¨ofle, M. G.: Phylogeny and abundance of novel denitrifying bacteria isolated from the water column of the central Baltic Sea, Microb. Ecol., 42, 295–305, 2001.
10
Brettar, I. and Rheinheimer, G.: Denitrification in the central Baltic: Evidence for hydrogen sulfide oxidation as motor of denitrification at the oxic-anoxic interface, Mar. Ecol. Prog. Ser., 77, 157–169, 1991.
Castro-Gonz ´alez, M., Braker, G., Far´ıas, L., and Ulloa, O.: Communities of nirS-type denitrifiers in the water column of the oxygen minimum zone in the eastern South Pacific, Environ.
15
Microbiol., 7, 1298–1306, 2005.
Cypionka, H.: Sulfide-controlled continuous culture of sulfate-reducing bacteria, J. Microbiol. Meth., 5, 1–9, 1986.
Dahlke, S.: Denitrification in sediments of north rugian estuaries, preliminary communication, Limnologica, 145–148, 1990.
20
Dunbar, J., Ticknor, L. O., and Kuske, C. R.: Phylogenetic specificity and reproducibility and new method for analysis of terminal restriction fragment profiles of 16S rRNA genes from bacterial communities, Appl. Environ. Microbiol., 67, 190–197, 2001.
Etchebehere, C. and Tiedje, J. M.: Presence of two different active nirS nitrite reductase genes in a denitrifying Thauera sp. from a high-nitrate-removal-rate reactor, Appl. Environ.
Micro-25
biol., 71, 5642–5645, 2005.
Feistel, R., Nausch, G., Heene, T., Piechura, J., and Hagen, E.: Evidence for a warm water inflow into the Baltic proper in summer 2003, Oceanologia, 46, 581–598, 2004.
Feistel, R., Nausch, G., Matth ¨aus, W., and Hagen, E.: Temporal and spatial evolution of the Baltic deep water renewal in spring 2003, Oceanologia, 45, 623–642, 2003a.
30
Feistel, R., Nausch, G., Mohrholz, V.,Łysiak-Pastuszak, E., Seifert, T., Matth¨aus, W., Kr¨uger, S., and Hansen, I. S.: Warm waters of summer 2002 in the deep Baltic proper, Oceanologia, 45, 571–592, 2003b.
BGD
3, 697–727, 2006 Denitrifier communities in the Baltic Sea S. Falk et al. Title Page Abstract Introduction Conclusions References Tables Figures J I J I Back CloseFull Screen / Esc
Printer-friendly Version Interactive Discussion
Felsenstein, J.: PHYLIP: Phylogeny interference package (Ver. 3.5c). Seattle, WA, USA: De-partment of Genetics, University of Washington, 1993.
Fonselius, S.: Determination of hydrogen sulfide, in: Methods of seawater analysis, edited by: Grasshoff, K., Ehrhardt, M., and Kremling, K., pp. 73–80, Verlag Chemie, Weinheim, 1983. Forster, S., Graf, G., Kitlar, J., and Powilleit, M.: Effects of bioturbation in oxic and hypoxic
5
conditions: A microcosm experiment with a North Sea sediment community, Mar. Ecol. Prog. Ser., 116, 153–161, 1995.
Grasshoff, K.: Determination of oxygen, thiosulphate, nitrite and nitrate, in: Methods of sea-water analysis, edited by: Grasshoff, K., Ehrhardt, M., and Kremling, K., pp. 61–72, 81–84, 139–142, 143–150, Verlag Chemie, Weinheim, 1983.
10
Hannig, M., Braker, G., Dippner, J. W., and J ¨urgens, K.: Linking denitrifier community structure and prevalent biogeochemical parameters in the pelagial of the central Baltic Proper (Baltic Sea), FEMS Microbiol. Ecol., doi:10.1111/j.1574-6941.2006.00116.x, 2006a.
H ¨ofle, M. G. and Brettar, I.: Genotyping of heterotrophic bacteria from the central Baltic Sea by use of low-molecular weight RNA profiles, Appl. Environ. Microbiol., 62, 1383–1390, 1996.
15
H ¨ofle, M. G., Flavier, S., Christen, R., B ¨otel, J., Labrenz, M., and Brettar, I.: Retrieval of nearly complete 16S rRNA gene sequences from environmental DNA following 16S rRNA-based community fingerprinting, Environ. Microbiol., 7, 670–675, 2005.
H ¨ubel, H., Wolff, C., and Meyer-Reil, L.-A.: Salinity, inorganic nutrients, and primary production in a shallow coastal inlet in the southern Baltic Sea (Nordr ¨ugensche Bodden) results from
20
long-term observations (1960–1989), Internat. Rev. Hydrobiol., 83, 479–499, 1998.
Jayakumar, D. A., Francis, C. A., Naqvi, S. W. A., and Ward, B. B.: Diversity of nitrite reductase genes (nirS) in the denitrifying water column of the coastal Arabian sea, Aquat. Microbiol. Ecol., 34, 69–78, 2004.
Koroleff, F.: Determination of ammonia, in: Methods of seawater analysis, edited by: Grasshoff,
25
K., Ehrhardt, M., and Kremling, K., pp. 150–157. Verlag Chemie, Weinheim, 1983.
Kotilainen, A. T., H ¨am ¨al ¨ainen, J. M. S., and Winterhalter, B.: Reconstructing a continuous holocene composite sedimentary record for the eastern Gotland Deep, Baltic Sea, Boreal Environ. Res., 7, 1–12, 2002.
Kramer, J. and Singleton, F.: Measurement of rRNA variation in natural communities of
mi-30
croorganisms on the south-eastern U.S. Continental Shelf, Appl. Environ. Microbiol., 59, 2430–2436, 1993.
BGD
3, 697–727, 2006 Denitrifier communities in the Baltic Sea S. Falk et al. Title Page Abstract Introduction Conclusions References Tables Figures J I J I Back CloseFull Screen / Esc
Printer-friendly Version Interactive Discussion
application of real-time PCR approach for quantification of uncultured bacteria in the central Baltic Sea, Appl. Environ. Microbiol., 70, 4971–4979, 2004.
Labrenz, M., Jost, G., Pohl, C., Beckmann, S., Martens-Habbena, W., and J ¨urgens, K.: Impact of different in vitro electron donor/acceptor conditions on potential chemolithoautotrophic communities from marine pelagic redoxcline, Appl. Environ. Microbiol., 71, 6664–6672,
5
2005.
Liu, X., Tiqueia, S. M., Holguin, G., Wu, L., Nold, S. C., Devol, A. H., Luo, K., Palumbo, A. V., Tiedje, J. M., and Zhou, J.: Molecular diversity of denitrifying genes in continental marine sediment within the oxygen-deficient zone off the Pacific coast of Mexico, Appl. Environ. Microbiol., 69, 3549–3560, 2003.
10
Mendum, T. A., Sockett, E., and Hirsch, P. R.: The detection of Gram-negative bacterial mRNA from soil by RT-PCR, FEMS Microbiol. Lett., 164, 369–373, 1998.
Meyer-Reil, L.-A. and K ¨oster, M.: Eutrophication of marine waters: Effects on benthic microbial communities, Mar. Poll. Bull., 41, 255–263, 2000.
Nausch, G., Matth ¨aus, W., and Feistel, R.: Hydrographic and hydrochemical conditions in the
15
Gotland Deep area between 1992 and 2003, Oceanologia, 45, 557–569, 2003.
Ogram, A.: Isolation of nucleic acids from environmental samples, in: Techniques in microbial ecology, Oxford Universtiy Press, 1998.
Osborn, C., Rees, G. N., Bernstein, Y., and Jansen, P. H.: New threshold and confidence estimates for terminal restriction length polymorphism analysis of complex bacterial
commu-20
nities, Appl. Environ. Microbiol., 72, 1270–1278, 2006.
Priem ´e, A., Braker, G., and Tiedje, J. M.: Diversity of nitrite reductase (nirK and nirS) gene fragments in forested upland and wetland soils, Appl. Environ. Microbiol., 68, 1893–1900, 2002.
Revsbech, N. P., Jørgensen, B. B., and Blackburn, T. H.: Microelectrode studies of the
pho-25
tosynthesis and O2, H2S, and pH profiles of a microbial mat, Limnol. Oceanogr., 28, 1062– 1074, 1983.
Risgaard-Petersen, N., Meyer, R. L., Schmid, M., Jetten, M. S. M., Enrich-Prast, A., Rysgaard, S., and Revsbech, N. P.: Anaerobic ammonium oxidation in an estuarine sediment. Aquat. Microb. Ecol., 36, 293–304, 2004.
30
R ¨onner, U. and S ¨orensson, F.: Denitrification rates in the low-oxygen waters of the stratified baltic proper, Appl. Environ. Microbiol., 50, 801–806, 1985.
BGD
3, 697–727, 2006 Denitrifier communities in the Baltic Sea S. Falk et al. Title Page Abstract Introduction Conclusions References Tables Figures J I J I Back CloseFull Screen / Esc
Printer-friendly Version Interactive Discussion
nitrate and salinity gradient in a coastal aquifer, Appl. Environ. Microbiol., 72, 2102–2109, 2006.
Scala, D. J. and Kerkhof, L. J.: Horizontal heterogeneity of denitrifying communities in ma-rine sediments by terminal restriction fragment length polymorphism analysis, Appl. Environ. Microbiol., 66, 1980–1986, 2000.
5
Sohlenius, G., Emeis, K.-C., Andr ´en, E., Andren, T., and Kohly, A.: Development of anoxia dur-ing the Holocene fresh-water transition in the Baltic Sea, Mar. Geol., 177, 221–242, 2001. Sohlenius, G., Sternbeck, J., Andr ´en, E., and Westman, P.: Holocene history of the Baltic Sea
as recorded in a sediment core from the Gotland Deep, Mar. Geol., 134, 183–201, 1996. Taroncher-Oldenburg, G., Griner, E. M., Francis, C. A., and Ward, B. B.: Oligonucleotide
mi-10
croarray for the study of functional gene diversity in the nitrogen cycle in the environment, Appl. Environ. Microbiol., 69, 1159–1171, 2003.
Thamdrup, B. and Dalsgaard, T.: Production of N2 through anaerobic ammonium oxidation coupled to nitrate reduction in marine sediments, Appl. Environ. Microbiol., 68, 1312–1318, 2002.
15
Throb ¨ack, I. N., Enwall, K., Jarvis, A., and Hallin, S.: Reassessing PCR primers targeting nirS,
nirK, and nosZ genes for community surveys of denitrifying bacteria with DGGE, FEMS
Microbiol. Ecol., 49, 401–417, 2004.
Tuomainen, J. M., Hietanen, S., Kuparinen, J., Martikainen, P. J., and Servomaa, K.: Baltic Sea cyanobacterial bloom contains denitrification and nitrification genes, but has negligible
20
denitrification activity, FEMS Microbiol. Ecol., 45, 83–96, 2003.
Tuominen, L., Hein ¨anen, A., Kuparinen, J., and Nielsen, L. P.: Spatial and temporal variability of denitrification in the sediments of the northern Baltic Proper, Mar. Ecol. Prog. Ser., 172, 13–24, 1998.
Voss, M., Liskow, I., Pastuszak, M., Russ, D., Schulte, U., and Dippner, J. W.: Riverine
dis-25
charge into a coastal bay: A stable isotope study in the Gulf of Gdansk, Baltic Sea., J. Marine Syst., 57, 127–145, 2005.
Weinbauer, M. G., Fritz, I., Wenderoth, D. F., and H ¨ofle, M. G.: Simultaneous extraction from bacterioplancton of total RNA and DNA suitable for quantitative structure and function anal-ysis, Appl. Environ. Microbiol., 68, 1082–1087, 2002.
30
Zumft, G.: Cell biology and molecular basis of denitrification, Microbiol. Mol. Biol. Rev., 61, 533–616, 1997.
BGD
3, 697–727, 2006 Denitrifier communities in the Baltic Sea S. Falk et al. Title Page Abstract Introduction Conclusions References Tables Figures J I J I Back CloseFull Screen / Esc
Printer-friendly Version Interactive Discussion
Fig. 1. Sampling stations in the Baltic Sea. Station Rassower Strom (St. RS) in the Bodden
next to the island of R ¨ugen (Germany) and Gotland Deep (St. GD) in the central Baltic Sea (Map courtesy of Jan Donath, Baltic Sea Research Institute Warnem ¨unde).
BGD
3, 697–727, 2006 Denitrifier communities in the Baltic Sea S. Falk et al. Title Page Abstract Introduction Conclusions References Tables Figures J I J I Back CloseFull Screen / Esc
Printer-friendly Version Interactive Discussion 0 5 10 15 20 Wat e r De p th [m ] 0 50 100 210 215 220 225 230 235 0.0 0.5 1.0 1.5 2.0 2 O [µM] 0 100 200 300 400 500 -NO3 NO2 -NH4+ S² -O2 Sal
(b)
0 5 10 15 20 25 30 0 5 10 15 20 25 30 pH .. O [µM] O2 0 100 200 300 400 S2-[mM] 0 1 2 3 5.5 6.0 6.5 7.0 7.5 Se di m e nt D e p th [m m] S² -S² -pH pH O22(a)
S2-, NO 3-, NH4+ [µM] NO2-[µM]Fig. 2. Physical and chemical parameters of sampling sites in the Baltic Sea; (a) water column
BGD
3, 697–727, 2006 Denitrifier communities in the Baltic Sea S. Falk et al. Title Page Abstract Introduction Conclusions References Tables Figures J I J I Back CloseFull Screen / Esc
Printer-friendly Version Interactive Discussion 9-10 De p th s [c m] De p th s [ m ] 0% 20% 40% 60% 80% 100% 5-7 2-5 1-2 0-1 232 230 225 200 150 100 85 70 Relative abundance of T-RFs [%] 36 47 45 72 97 107 111 118 120 218 238 240 273 275 295 299 341 346 347 380 385 537 (a) (b)
Fig. 3. Relative abundance of terminal restriction fragments (T-RFs) of nirS amplicons.
Num-bers indicate the size of the fragment in base pairs after T-RFLP analysis.(a) samples from the
BGD
3, 697–727, 2006 Denitrifier communities in the Baltic Sea S. Falk et al. Title Page Abstract Introduction Conclusions References Tables Figures J I J I Back CloseFull Screen / Esc
Printer-friendly Version Interactive Discussion 31 BSS Cluster A; pA12, PNW Cluster III (AJ248405)
3 CBBS 2 BS Cluster II 14 PNW Cluster III 3 BS Cluster Ie 4 BSS Cluster B 3 BS Cluster Ic; BSS-3-30 pA5, PNW Cluster III (AJ248403)
6 BSS Cluster C 2 ETNP Cluster Ib 2 BSS Cluster D CBBS (AJ457197)
15 BS Cluster Ia+b; BSS-1-19; PNW Cluster IV BSS-3-4
BS M60-131 (DQ072196)
32 ESP Cluster I; ASW Cluster XI; ETNP Cluster Ic
4 ETNP Cluster Ic 5 CBBS
Azoarcus tolulyticus (AY078272) 17 ASW Cluster XII + PNW Cluster IV 5 BS Cluster Id; CBBS (UB457198)
ASW (AY336929) 12 BS Cluster III; BSS Cluster E ASW Cluster VI (AY336851) BSS-3-24
23 19 ASW Cluster VIII + 4 P Pseudomonas aeruginosa
25 1 BS Cluster V; 22 ESP Cluster III; Pseudomonas fluorescens
3 ASW Cluster VII 6 ASW Cluster IV Thauera mechernichensis (AY078268) Azoarcus tolulyticus Tol-4 (AY078271) ASW Cluster IV (AY336818)
CBBS (AJ457201)
17 2 BS Cluster IV; 14 ESP Cluster IIa; Isolate D4-14 (AJ248395) 13 8 ESP Cluster IIb,c; 4 ASW Cluster IX + Isolate C10-1 (AJ248394) Isolate B9-12 (AJ248393)
BS M60-97 (DQ072207) 4 BSS Cluster F
ETNP Cluster Ib (AY195930) 5 BS Cluster VIII 3 ESP Cluster IV 16 ASW Cluster II 3 ASW Cluster I 2 ETNP Cluster Ia 2 BS Cluster VIa ETNP Cluster Ia (AY195925)
ETNP Cluster Ib (AY195928) 2 BS Cluster VIb
24 ASW Cluster III
2 Ralstonia eutropha. 3 Paracoccus spp. 3 BS Cluster VIIa
2 BS Cluster VIIb Roseobacter denitrificans (AJ224911) ETNP Cluster Ia (AY195920)
16 ETNP Cluster Ic; Isolate 3 Pseudomonas stutzeri
ETNP Cluster Ic (AY195909) Thauera sp. (AY838759)
2 Azoarcus spp.
14 11 Thauera spp.; 1 Acidovorax sp. 2FB7 (AY078273); 2 Pseudomonas stutzeri 13 BS Cluster IX
Azospirillum brasilense Sp7 (AJ224912)
7 5 BS Cluster X, 2 PNW Cluster II 3 ASW Cluster V 2 PNW Cluster II 2 ASW Cluster V 5 ASW Cluster V 0.10 marine Cluster I marine Cluster II marine Cluster III marine Cluster IV marine Cluster V marine Cluster VI marine Cluster VII
BGD
3, 697–727, 2006 Denitrifier communities in the Baltic Sea S. Falk et al. Title Page Abstract Introduction Conclusions References Tables Figures J I J I Back CloseFull Screen / Esc
Printer-friendly Version Interactive Discussion
Fig. 4. Phylogenetic tree of nirS sequences from all marine habitats. Tree was calculated by
the neighbour joining method based on an alignment of 166 amino acids. Roman numbers indicate marine nirS sequence clusters. NirS sequences from sediment samples from the Baltic Sea were labelled with BSS. Clones were labelled with numbers to indicate from which depth of the sediment sequences were retrieved (1, 0 to 5 mm; 2, 5 to 12 mm; 3, 12 to 30 mm) and a second number for the respective clone. NirS clusters from Baltic Sea sediments were labelled with A to F. The number after the polygon indicates the number of clones of a given cluster. ASW, Arabian Sea water column; BS, Baltic Sea water column; CBBS, cyanobacterial bloom Baltic Sea; ESP, eastern South Pacific sediment; ETNP, eastern tropical North Pacific sediment; PNW, Pacific Northwest sediment.
BGD
3, 697–727, 2006 Denitrifier communities in the Baltic Sea S. Falk et al. Title Page Abstract Introduction Conclusions References Tables Figures J I J I Back CloseFull Screen / Esc
Printer-friendly Version Interactive Discussion BSS (BSS-2-1, -2- 54, -2-74) BSS (BSS-1-10, -1-75, -1-73, -1-70) BSS-3-52 BSS-1-18 BSS-2-62 BSS (BSS-1-72, -1-69, -1-20) BSS (BSS-3-3, -3-41, -3-25) BSS-2-35 BSS-2-42 BSS-3-40 BSS-2-73 CBBS (AJ457196) 3 BSS (BSS-1-24, -1-23, -1-44) 3 BSS (BSS-1-12, -1-4, -1-68) BSS-3-26
pA12, PNW Cluster III (AJ248405) BSS-3-2 BSS-2-52 14 PNW Cluster III 3 BS Cluster Ie (M60) BSS-2-39 BSS-2-59 BSS-3-54 BSS-3-11 BS M60-151 (DQ072217) BS M60-165 (DQ072223) BSS-3-30 PNW, pA5 ( AJ248403) BSS (BSS-3-14, -3-33) BSS (BSS-1-66, -1-57) BSS-1-76 BSS-3-31 2 ETNP Cluster Ib 2 BSS (BSS-1-41, -1-71) CBBS (AJ457197) 8 BS Cluster Ia (M40,60) BSS-1-19 2 PNW Cluster IV ASW Cluster X (AY336817) 2 BS Cluster Ib (M60)
wF16full, PNW Cluster IV (AJ248437) BSS-3-4 BS M60-131(DQ072196) 23 ESP Cluster Ic 9 ASW Cluster XI 4 ETNP Cluster Ic 5 CBBS 3 CBBS
Azoarcus tolulyticus (AY078272)
17 ASW Cluster XII; PNW Cluster IV
5 BS Cluster Id (M60); CBBS (AJ457198) 2 BS Cluster II ASW (AY336929) BS M60-126 (DQ072193) BSS (BSS-2-37, -2-51, -2-69) BSS-3-13 BSS (BSS-2-38, -2-29, -2-48, -2-70) ASW Cluster VI ( AY336851) BSS-3-24
0.10
outgroup
BSS Clus ter A , pA12 , PNW Clus ter III
BS Clus ter Ie BSS Clus ter B BS Clus ter I c, BSS -3-30 BSS Clus ter C BSS Clus ter D
BS Clus ter Ia+ b, BSS -1-19 , PNW Clus ter IV
BS Clus ter III , BSS Clus ter E
BGD
3, 697–727, 2006 Denitrifier communities in the Baltic Sea S. Falk et al. Title Page Abstract Introduction Conclusions References Tables Figures J I J I Back CloseFull Screen / Esc
Printer-friendly Version Interactive Discussion
Fig. 5. Phylogenetic tree of nirS sequences clustering in marine Cluster I. NirS sequences
from sediment samples from the Baltic Sea were labelled with BSS. Clones were labelled with numbers to indicate from which depth of the sediment sequences were retrieved (1, 0 to 5 mm; 2, 5 to 12 mm; 3, 12 to 30 mm) and a second number for the respective clone. NirS clusters from Baltic Sea sediments were labelled with A to F. The number after the polygon indicates the number of clones of a given cluster. ASW, Arabian Sea water column; BS, Baltic Sea water column; CBBS, cyanobacterial bloom Baltic Sea; ESP, eastern South Pacific sediment; ETNP, eastern tropical North Pacific sediment; PNW, Pacific Northwest sediment.