HAL Id: hal-03000017
https://hal.archives-ouvertes.fr/hal-03000017
Submitted on 11 Nov 2020
HAL is a multi-disciplinary open access
archive for the deposit and dissemination of
sci-entific research documents, whether they are
pub-lished or not. The documents may come from
teaching and research institutions in France or
abroad, or from public or private research centers.
L’archive ouverte pluridisciplinaire HAL, est
destinée au dépôt et à la diffusion de documents
scientifiques de niveau recherche, publiés ou non,
émanant des établissements d’enseignement et de
recherche français ou étrangers, des laboratoires
publics ou privés.
Two uneven sisters
B. Vollmer, C. Pappalardo, M. Soida, A. Lançon
To cite this version:
B. Vollmer, C. Pappalardo, M. Soida, A. Lançon. Two uneven sisters: I. NGC 4388 – a strongly
constrained ram-pressure stripping event. Astronomy and Astrophysics - A&A, EDP Sciences, 2018,
620, pp.A108. �10.1051/0004-6361/201731910�. �hal-03000017�
https://doi.org/10.1051/0004-6361/201731910 c ESO 2018
Astronomy
&
Astrophysics
Two uneven sisters
I. NGC 4388 – a strongly constrained ram-pressure stripping event
B. Vollmer
1, C. Pappalardo
2,3, M. Soida
4, and A. Lançon
11 Université de Strasbourg, CNRS, Observatoire astronomique de Strasbourg, UMR 7550, 67000 Strasbourg, France
e-mail: [email protected]
2 Centro de Astronomia e Astrofísica da Universidade de Lisboa, Observatório Astronómico de Lisboa, Tapada da Ajuda,
1349-018 Lisboa, Portugal
3 Instituto de Astrofísica e Ciencias do Espaço, Universidade de Lisboa, OAL, Tapada da Ajuda, 1349-018 Lisboa, Portugal 4 Astronomical Observatory, Jagiellonian University, 30-244 Kraków, Poland
Received 7 September 2017/ Accepted 10 September 2018
ABSTRACT
Since the Virgo cluster is the closest galaxy cluster in the northern hemisphere, galaxy interactions can be observed in it at kiloparsec resolution. The spiral galaxy NGC 4388 underwent a ram-pressure stripping event ∼200 Myr ago caused by its highly eccentric orbit within the Virgo cluster. This galaxy fulfills all diagnostic criteria for having undergone active ram-pressure stripping in the recent past: it has a strongly truncated Hi and Hα disk, an asymmetric ridge of polarized radio continuum emission, extended extraplanar gas toward the opposite side of the ridge of polarized radio continuum emission, and has undergone a recent (a few hundred million years ago) quenching of its star formation activity in the outer, gas-free galactic disk. We made dynamical simulations of the ram-pressure stripping event to investigate the influence of galactic structure on the observed properties of NGC 4388. The combination of a deep optical spectrum of the outer gas-free region of the galactic disk together with deep Hi, Hα, far-ultraviolet, and polarized radio continuum data allows us to constrain numerical simulations to derive the temporal ram-pressure profile, the three-dimensional velocity vector of the galaxy, and the time since peak ram pressure with a high level of confidence. From the simulations, an angle between the ram-pressure wind and the galactic disk of 30◦
is derived. The galaxy underwent peak ram pressure ∼240 Myr ago. The observed asymmetries in the disk of NGC 4388 are not caused by the present action of ram pressure, but by the resettling of gas that has been pushed out of the galactic disk during the ram-pressure stripping event. For the detailed reproduction of multi-wavelength observations of a spiral galaxy that undergoes or underwent a ram-pressure stripping event, galactic structure, such as spiral arms for example, must be taken into account.
Key words. Galaxy: evolution – galaxies: kinematics and dynamics – galaxies: individual: NGC 4388
1. Introduction
The environment has a strong influence on spiral galaxies evolving in a cluster of galaxies. The ideal place to study the evolution of cluster spiral galaxies is the Virgo cluster, because it represents the only cluster in the northern hemi-sphere where one can observe the interstellar medium (ISM) distribution and kinematics of cluster galaxies at kiloparsec resolution (1 kpc ∼ 1200)1. The Virgo cluster is dynamically young and spiral rich. The cluster spiral galaxies have lost up to 90% of their neutral hydrogen, that is, they are Hi deficient (Chamaraux et al. 1980; Giovanelli & Haynes 1983). Imaging Hi observations have shown that these galaxies have truncated Hi disks (Cayatte et al. 1990; Chung et al. 2009). Therefore, it appears that the cluster environment changes the Hi content and morphology of Virgo cluster spiral galaxies.
Vollmer et al.(2007) showed that the distribution of polar-ized radio continuum emission of cluster spiral galaxies can be very asymmetric compared to the emission of field galaxies. Asymmetric ridges of polarized radio emission are produced by compression or shear motions (Otmianowska-Mazur & Vollmer 2003). Both kinds of motions occur during ram-pressure strip-ping events or tidal interactions. In the case of a ram-pressure
1 We assume a distance of 17 Mpc to the Virgo cluster.
stripping event the gas is compressed on one side of the galactic disk and pushed out of the disk on the other side, as observed in NGC 4522 (Kenney et al. 2004). Together with the gas distribu-tion and velocity field, the polarized radio continuum emission thus represents an important diagnostic tool for ram-pressure stripping (e.g.,Vollmer et al. 2006).
Based on these diagnostic tools, Vollmer (2009) was able to establish a time sequence for ram-pressure stripping in the Virgo cluster: NGC 4501 is observed before peak ram pres-sure, NGC 4522 and NGC 4438 close to peak ram prespres-sure, NGC 4388 ∼ 100 Myr after peak ram pressure, and NGC 4569 ∼ 300 Myr after peak ram pressure.
Two edge-on spiral galaxies, NGC 4388 and its sister galaxy NGC 4402, are located close (∼400 kpc) to the cluster centre (M 87) and close (135 kpc) to each other in projection on the sky. Both galaxies have high radial velocities with respect to the clus-ter mean velocity (vN4388 ∼ 1500 km s−1, vN4402 ∼ −900 km s−1).
Both galaxies are strongly Hi deficient, their disks of atomic hydrogen being strongly truncated. Whereas NGC 4402 shows only a small Hi tail (Chung et al. 2009), NGC 4388 has a spec-tacular Hi plume extending ∼100 kpc to the north of the galaxy (Oosterloo & van Gorkom 2005). The part of the plume close to the galactic disk is also visible in Hα emission (Yoshida et al. 2002). The polarized radio continuum emission distributions of
Open Access article,published by EDP Sciences, under the terms of the Creative Commons Attribution License (http://creativecommons.org/licenses/by/4.0),
both galaxies are asymmetric with ridges of polarized emis-sion located at the southern edges of the galaxies (Vollmer et al. 2007). In NGC 4388 the distribution of polarized radio contin-uum emission is complex due to a nuclear outflow.
Both galaxies therefore share common key properties: asymmetric ridges of polarized radio continuum emission and strongly truncated Hi disks together with extraplanar neutral gas. The huge Hi tail of NGC 4388 indicates that the galaxy is stripped for the first time, that is, it was not significantly Hi deficient before its passage in the Virgo cluster core. Does NGC 4402 share the same history in the Virgo cluster? Is it also stripped for the first time? Within this article on NGC 4388 and its companion on NGC 4402, we want to find answers to these questions.
In order to verify the time to peak ram pressure of NGC 4388 derived from the direct comparison of the model gas distri-bution, Pappalardo et al. (2010) took a deep optical spectrum of the outer gas-free stellar disk of NGC 4388. With the help of stellar population synthesis models they could determine the time since star formation was quenched in the stellar disk when the gas was removed by ram-pressure stripping. This time (∼200 Myr) was in agreement with the star-formation quenching time derived from Lick indices byCrowl & Kenney(2008), but in disagreement with the time to peak ram pressure determined byVollmer & Huchtmeier(2003) based on Effelsberg Hi data.
In this article we present new dynamical simulations of the ISM of NGC 4388 together with calculations of the associated magnetic field and the polarized radio continuum emission. We study the influence of galactic structure, that is, spiral arms, on the final gas distribution and velocity field, the Hα, far-ultraviolet (FUV), and polarized radio continuum emission, and the optical spectrum after the ram-pressure stripping event. The comparison of the simulated data with observations can discriminate between the different model scenarios.
2. The model
We use the N-body code described inVollmer et al.(2001) which consists of two components: a non-collisional component that simulates the stellar bulge/disk and the dark halo, and a collisional component that simulates the ISM. A new scheme for star forma-tion has been implemented, where stars are formed during cloud collisions and are then evolved as non-collisional particles. 2.1. Halo, stars, and gas
The non–collisional component consists of 81 920 particles, which simulate the galactic halo, bulge, and disk. The character-istics of the different galactic components are shown in Table1. The resulting rotation velocity is vrot = 190 km s−1and the
rota-tion curve becomes flat at a radius of about 6 kpc.
We have adopted a model where the ISM is simulated as a collisional component, i.e. as discrete particles or clouds which possess a mass and a radius and which can have inelastic col-lisions (sticky particles). Since the ISM is a turbulent and frac-tal medium (see e.g.Elmegreen & Falgarone 1996), it is neither continuous nor discrete. The volume filling factor of the warm and cold phases is smaller than one. The warm neutral and ionized gas fill about 30−50% of the volume, whereas cold neutral gas has a volume-filling factor smaller than 10% (Boulares & Cox 1990). It is not clear how this fraction changes when an external pressure is applied. In contrast to smoothed-particle hydrodynamics (SPH), which is a quasi continuous approach and where the particles cannot penetrate each other,
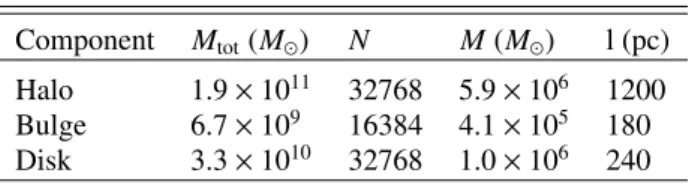
Table 1. Total mass, number of particles N, particle mass M, and smoothing length l for the different galactic components.
Component Mtot(M ) N M(M ) l (pc)
Halo 1.9 × 10¹¹ 32768 5.9 × 10⁶ 1200
Bulge 6.7 × 10⁹ 16384 4.1 × 10⁵ 180
Disk 3.3 × 10¹⁰ 32768 1.0 × 10⁶ 240
our approach allows a finite penetration length, which is given by the mass-radius relation of the particles. Both methods have their advantages and their limits. The advantage of our approach is that ram pressure can be included easily as an additional accel-eration on particles that are not protected by other particles (see Vollmer et al. 2001).
The 20 000 particles of the collisional component repre-sent gas cloud complexes which are evolving in the gravita-tional potential of the galaxy. The total assumed gas mass is Mgastot = 4.4 × 10⁹M , which corresponds to the total neutral gas
mass before stripping, that is, to an Hi deficiency of zero, which is defined as the logarithm of the ratio between the Hi content of a field galaxy of the same morphological type and diameter and the observed Hi mass (e.g.Chung et al. 2009). To each particle a radius is assigned depending on its mass. During disk evolu-tion the particles can have inelastic collisions, the outcome of which (coalescence, mass exchange, or fragmentation) is sim-plified followingWiegel(1994). This results in an effective gas viscosity in the disk.
The optical radius of NGC 4388 is R25 = 2.420 ∼ 12 kpc. If
we assume an inclination-corrected optical radius of 10–11 kpc, the initial radial model Hi profile with respect to R/R25is similar
to that of the local field spiral galaxy NGC 5055 (Leroy et al. 2008). It can be broadly described by an exponential with a length scale of 5.5 kpc with two dips at 2.5 and 7.5 kpc. With a molecular fraction proportional to the square root of the gas den-sity fmol∝ √ρ (Vollmer et al. 2008), the Hi surface density
pro-file is constant from 2.5 to 7.5 kpc (ΣHI∼ 10 M pc−2), declines
rapidly toΣHI ∼ 4 M pc−2and then stays approximately
con-stant between 9 and 14 kpc.
As the galaxy moves through the intracluster medium (ICM), its clouds are accelerated by ram pressure. Within the galaxy’s inertial system its clouds are exposed to a wind coming from a direction opposite to that of the galaxy’s motion through the ICM. The adopted temporal ram-pressure profile has the form of a Lorentzian, which is realistic for galaxies on highly eccentric orbits within the Virgo cluster (Vollmer et al. 2001). The effect of ram pressure on the clouds is simulated by an additional force on the clouds in the wind direc-tion. Only clouds which are not protected by other clouds against the wind are affected. Since the gas cannot develop instabilities, the influence of turbulence on the stripped gas is not included in the model. The mixing of the ICM into the ISM is very crudely approximated by a finite penetration length of the ICM into the ISM, that is, until this penetration length, the clouds undergo an additional acceleration due to ram pressure.
We note that the treatment of the ISM in numerical simu-lations is very crude (gas clouds having partially inelastic col-lisions). As soon as the clouds are stripped from the galaxies, the clouds mainly behave like ballistic particles which are affected by ram pressure. For the acceleration by ram pressure, we assume a= pram/Σ, where the surface density of the atomic
gas clouds is assumed to beΣ = 10 M pc−2at all times. Cloud
30
◦long
30
◦30
◦short
45
◦long
45
◦45
◦short
60
◦long
60
◦60
◦short
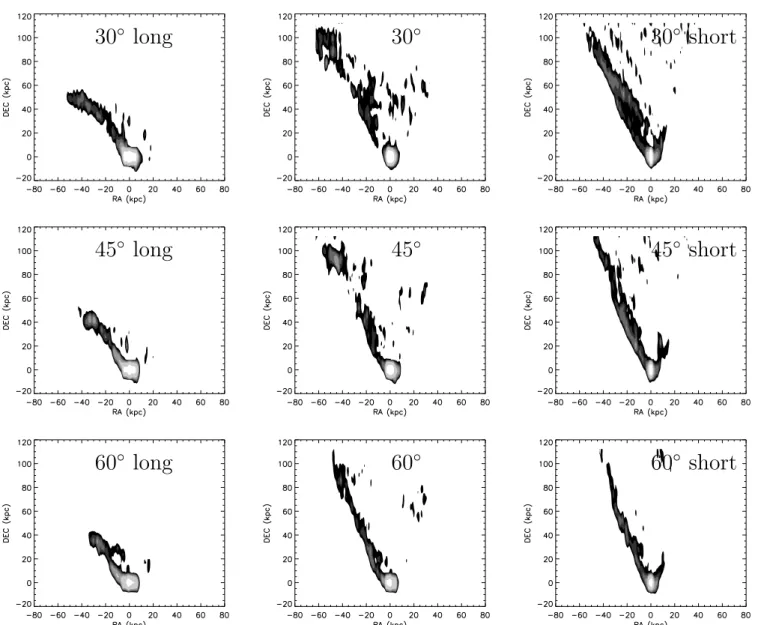
Fig. 1.Large-scale Hi distribution of models with different cluster orbits and wind angles (30◦
, 45◦
, 60◦
), i.e. the angle between the ram-pressure wind and the galactic disk. The projection angles are i = 90◦
(edge-on) and PA = 90◦
(horizontal). The Lorentzian ram-pressure profiles with shorter widths have higher values of peak ram pressure. Contour levels are (3, 6, 9, 15, 30, 150) × 1019cm−2. The times of interest are 240 Myr,
210 Myr, and 200 Myr after peak ram pressure for wind angles of 30◦
, 45◦
, and 60◦
, respectively.
in our simulations because this kind of cloud is expected to be stripped more efficiently, and a larger extent of the outer Hi tail than that calculated with clouds of constant surface density might be expected.
The particle trajectories are integrated using an adaptive time step for each particle. This method is described inSpringel et al. (2001). The following criterion for an individual time step is applied:
∆ti=
20 km s−1 ai
, (1)
where aiis the acceleration of the particle i. The minimum value
of tidefines the global time step used for the Burlisch–Stoer
inte-grator that integrates the collisional component. It is typically a few times 104yr.
2.2. Star formation
We assume that the star formation rate (SFR) is proportional to the cloud collision rate. During the simulations, stars are formed
in cloud-cloud collisions. At each collision a collisionless star particle is created which is added to the ensemble of collisional and collisionless particles. The newly created collisionless parti-cles have zero mass (they are test partiparti-cles) and the positions and velocities of the colliding clouds after the collision. These par-ticles are then evolved passively with the whole system. Since in our sticky-particle scheme there is mass exchange, coales-cence, or fragmentation at the end of a cloud–cloud collision, the same clouds will not collide infinitely. The local collision rate traces the cloud density and the velocity dispersion of the collisional component. Since the cloud density increases rapidly with decreasing galactic radius, the number of newly created par-ticles rises steeply toward the galaxy centre.
The information about the time of creation is attached to each newly created star particle. In this way the Hα emission distribu-tion can be modelled by the distribudistribu-tion of star particles with ages less than 10 Myr. The ultraviolet (UV) emission of a star particle in the two GALEX bands is modelled by the UV flux from single stellar population models from STARBURST99 (Leitherer et al. 1999). We assume that all star particles have the same
num-Table 2. Comparison between the models and observations.
Model 1 2 3 4 5 6 7 8 9 10
Wind angle 45◦ 45◦ 45◦ 45◦ 45◦ 45◦ 30◦ 30◦ 30◦ 30◦
Time of peak ram pressure tpeak(Myr) 530 550 570 590 510 500 500 530 560 590
Large-scale HI – – – – – – ∼ ∼ ∼ ∼ Small-scale HI – – – + – – – – ∼ – HI pV – – – ∼ – – ∼ – + ∼ Hα/8 µm (i = 75◦) – – – – – – – – – ∼ Hα/8 µm (i = 90◦) – – – – – – – – – – FUV (i= 75◦) – – – – – – – – – – FUV (i= 90◦) – – – – – – – – + –
Polarized radio continuum (i= 75◦) – – – – – – – – – ∼
Polarized radio continuum (i= 90◦) – – – – – – – – – –
Optical spectrum ∼ + + + + ∼ + ∼ ∼ ∼
ber of UV-emitting stars. The total UV distribution is then the extinction-free distribution of the UV emission of the newly cre-ated star particles. For the unperturbed galaxy, the resulting power law between star formation based on the model UV emission and the total/molecular gas surface density has an exponent of 1.7/1.2, respectively (Fig. A.1 of Vollmer et al. 2012). This is close to the observational findings ofBigiel et al.(2008). 2.3. The influence of the galaxy orbit on the simulations As a first test we investigated the influence of the galaxy orbit within the Virgo cluster on the formation of the stripped Hi tail. To do so, we adopted three different galaxy orbits from Vollmer et al. (2001; Fig. 2). These orbits lead to Lorentzian ram-pressure profiles (Vollmer et al. 2001; Fig 3), which are characterized by the ram-pressure maximum pmaxand the width
∆t. The three different orbits have long, intermediate, and short timescales: (pmax, ∆t) = (1250, 200), (5000, 100), (2 × 10⁴, 50),
where pmaxand∆t are in cm−3/(km s−1)2and Myr, respectively.
In addition, we varied the wind angle, the angle between the ram-pressure wind and the disk plane, between 30◦ and 60◦. Hi column-density maps were produced 200, 210, and 240 Myr after the time of peak ram pressure for the models with angles between the galactic disk and the ram-pressure wind of 60◦, 45◦, and 30◦, respectively (Fig.1).
Since the peak ram pressure sets the gas truncation radius, the Hi disks of the (pmax, ∆t) = (1250, 200), (2×10⁴, 50)
simula-tions are too large and too small compared to the VIVA Hi obser-vations (Chung et al. 2009). Moreover, the model Hi tails of the low peak ram-pressure simulations are about two times smaller than the observed Hi tail (Oosterloo & van Gorkom 2005). On the other hand, the model Hi tails of the high peak ram-pressure simulations are longer and thinner compared to observations. The high peak ram-pressure simulations also show a small tail on the western side of the galactic disk, which is not observed.
Only the simulations with an intermediate peak ram pres-sure and an intermediate width show an Hi tail length which is consistent with observations. A wind angle of 60◦leads to a sig-nificantly smaller tail width than that of the observed Hi tail. The observed extent in the east–west direction is only approximately reproduced by the simulations with wind angles of 30◦and 45◦.
These models show faint emission west of the tail which is not observed. Moreover, all models miss the observed gas at a height of ∼80 kpc, ∼−35 kpc east of the galaxy centre.
We conclude that the simulations which are most consistent with Hi observations have pmax∼ 8 × 10⁻¹¹dyn cm−2, a width of
Fig. 2.Snapshots of a galaxy after 0, 30, 60, and 90 Myr of evolution with a wind angle of 30◦
, 590, 560, 530, and 500 Myr before peak ram pressure.
∆t = 100 Myr, and a wind angle of 30◦–45◦. The ram-pressure
profile of the model ofVollmer & Huchtmeier(2003) had the same peak ram pressure, but a two-times smaller width and a wind angle of 45◦.
2.4. The influence of galactic structure on the simulations As in Nehlig et al. (2016), we study the influence of galac-tic structure on the outcome of a ram-pressure stripping event by using the same initial condition and fixing the peak of ram-pressure stripping at different times: tpeak =
500, 510, 530, 550, 570, 590 Myr after the beginning of the simulation (see Table 2). For comparison, the time interval of 100 Myr corresponds to approximately half a rotation period at the distance of the main spiral arms (∼7 kpc). The time of interest is 210 Myr after peak ram pressure for the wind angle of 45◦. For the simulations with a wind angle of 30◦the time steps of peak
ram pressure are tpeak= 500, 530, 560, 590 Myr after the
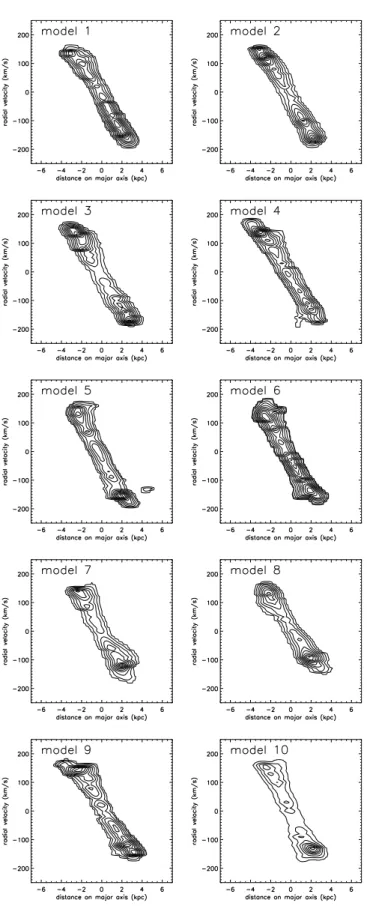
model2 model1 model4 model3 model6 model5 model8 model7 model10 model9
Fig. 3.Model Hi large-scale distributions and position–velocity diagrams with i = 90◦
. Contour levels are (3, 6, 9, 15, 30, 150) × 1019cm−2.
ram pressure. These time steps were chosen to reproduce the large-scale Hi distribution of NGC 4388. Table2gives the num-bering of the different models (6, 5, 1, 2, 3, 4, 7, 8, 10 for increas-ing time delays). The face-on projections of the gas disk 500 Myr before peak ram pressure for tpeak= 500, 530, 560, 590 Myr are
presented in Fig.2.
3. Comparison with observations
For comparison with observations, Hi, Hα, FUV, and radio continuum maps together with Hi position-velocity diagrams along the galaxy’s major axis and optical spectra of the stripped gas-free part of the galactic disk were produced from the simulations.
3.1. Atomic hydrogen
To separate the atomic and molecular gas phases, we follow Vollmer et al. (2008) by assuming that the molecular fraction depends linearly on the square root of the gas density ( fmol =
p
ρ/(0.5 M pc−3)), where ρ is the total gas density. Moreover,
the molecular fraction cannot exceed unity. The Hi column den-sity is then given byΣHI = (1 − fmol)Σ, where Σ is the total gas
surface density. 3.1.1. The Hi tail
The observed large-scale Hi distribution together with the position-velocity diagram of NGC 4388 are presented in the
Fig. 4. Upper left panel: Hi on optical image. The contour levels are (1, 5, 10, 50) × 1019cm−2
. Upper right panel: Hi pV diagram from
Oosterloo & van Gorkom(2005). Lower left panel: best-fit model Hi large-scale distribution with i = 90◦
. Contour levels are (3, 6, 9, 15, 30, 150) × 1019cm−2
. Lower right panel: model Hi pV diagram.
upper panels of Fig.4. The extended plume has a total extent of ∼200 = 100 kpc. The region of highest gas surface
den-sity is located ∼13.50 = 67 kpc north of the galactic disk and ∼7.20 = 36 kpc east of the centre of the galaxy. The plume
region near the galactic disk is almost devoid of detectable Hi emission. The velocity range of the plume is roughly −500 to 0 km s−1with respect to the galaxy’s systemic velocity of v
sys =
2524 km s−1. The velocity width is about 100 km s−1, except in the region near the maximum where the velocity width is ∼200 km s−1.
The large-scale Hi distributions and pV diagrams with respect to the projected distance from the galaxy centre of all models with wind angles of 45◦and 30◦are presented in Fig.3.
We used an inclination angle of i = 90◦(edge-on) for all model
snapshots. The projection with i = 75◦ is shown in Fig.A.1. We chose i= 90◦, because for this inclination all Hi tails show
a vertical extent between 90 and 100 kpc which is close to the observed extent. On the other hand, for i = 75◦the gas tails are
somewhat too extended (∼120 kpc). The characteristic curvature of the observed tail at high latitudes is better reproduced by the
simulations with a wind angle of 30◦. Models 5, 6, and 7 show low-surface-density Hi west of the plume which has no coun-terpart in observations. The dearth of Hi emission close to the galactic disk is reproduced by models 7 and 8. The column den-sity of the model gas tail close to the disk is small for model 9, but higher than observed. As already stated in Sect.2.3, all mod-els miss the observed gas in the Hi tail at a height of ∼70 kpc, ∼ − 35 kpc east of the galaxy centre. Only the simulations with a wind angle of 30◦reproduce the observed velocity range of the
Hi plume (∆v ∼ 500 km s−1). We thus conclude that the models with a wind angle of 30◦ are in better agreement with the data
than those with a wind angle of 45◦.
For the sake of illustration and clarity, we chose a “best-fit” model for each observable (models 9 or 10) and compare it to observations. The best-fit models can therefore vary for di ffer-ent observables, since we cannot expect that one single model produces all observables given the degeneracies between galac-tic structure, time of peak ram pressure, wind angle, and tem-poral ram-pressure profile. We also use two different inclination angles, i = 75◦ and i = 90◦. The set of model snapshots for a
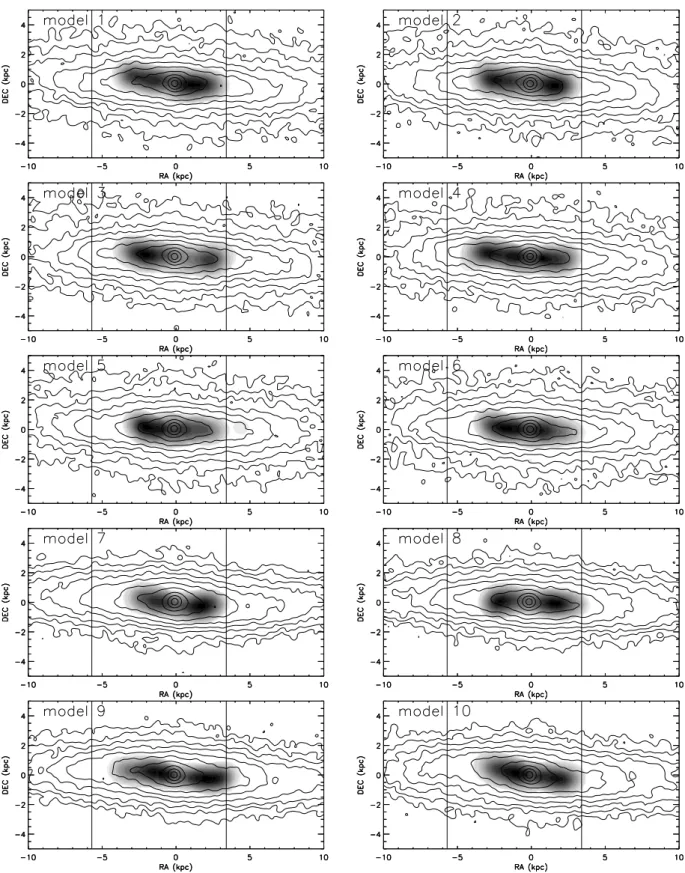
Fig. 5.Model Hi distributions of the galactic disk (grey-scale) with i = 90◦. Grey-scale levels are (4, 7, 14, 22, 30, 36, 43, 50, 58, 65, 72, 80) ×
1020cm−2
. The stellar content is shown with contours. To guide the eye, the vertical lines delimit the extent of the observed Hi distribution. given inclination, which includes the “best-fit” model, is shown
in the main part of the article, the other set is presented in the Appendix.
The large-scale Hi distributions of the best-fit model, together with the position-velocity diagram of NGC 4388, are presented in the lower panels of Fig.4for an inclination angle of i = 90◦. Since we restricted ourselves to models 9 and 10
for the best-fit model, we present model 9 as the best-fit model. The model gas plume shows about the same extent and the same east-west asymmetry as the observed gas plume. The regions of highest surface density in the model gas tail are located at ver-tical distances of ∼80 kpc and ∼40 kpc, 55 kpc and 25 kpc east of the galaxy centre (positions (−55 kpc, 80 kpc) and (−25 kpc, 40 kpc)). Whereas the high surface density gas at a vertical
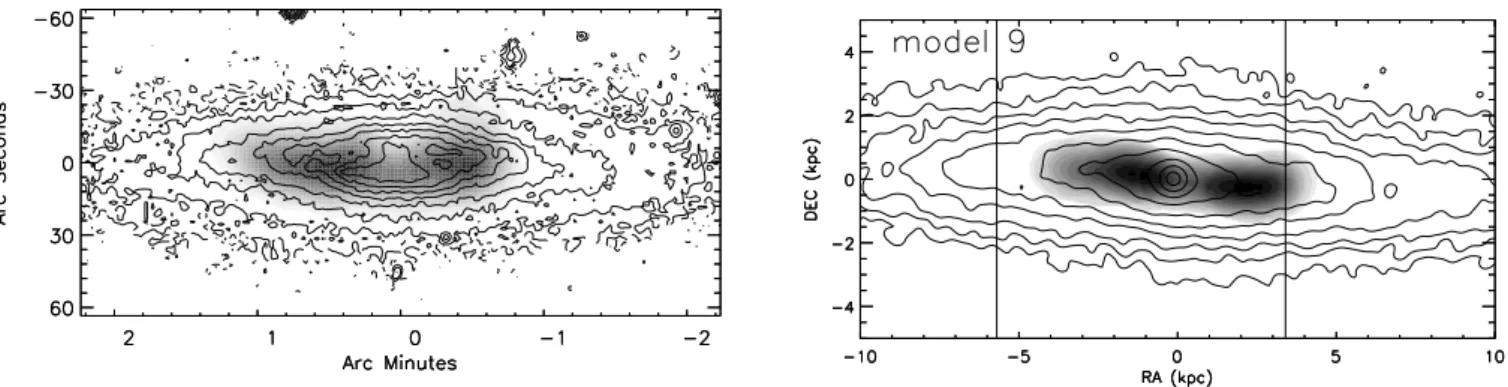
Fig. 6.Left panel: VIVA Hi distribution (grey-scale;Chung et al. 2009). Grey-scale levels are (2, 4, 6, . . . , 40) × 1020cm−2
. Right panel: model Hi distribution with i= 90◦
. Grey-scale levels are (4, 7, 14, 22, 30, 36, 43, 50, 58, 65, 72, 80) × 1020cm−2. The stellar content is shown with contours.
To guide the eye, the vertical lines delimit the extent of the observed Hi distribution. distance of 40 kpc has an observed counterpart, the observed
gas surface density in the region at vertical distance of 80 kpc is much lower than that of the model. Furthermore, the observed tail does not show significant emission close to the galactic disk (z < 20 kpc), but there is gas of relatively high surface density in this area of the model tail. Moreover, the low sur-face density gas in the model tail above the galaxy centre has no observed counterpart. In this respect, model 7 (Fig. 5) bet-ter reproduces the Hi observations. The main drawback of the model (and all other models) is the lack of emission at verti-cal distances 60 ≤ z ≤ 90 kpc, 30–50 kpc east of the galaxy centre.
For the model pV diagram we assume that only the parts with the highest particle density can be observed. With ∼500 km s−1,
the velocity range of the model gas plume is well comparable to that of the observed plume (lower left panel of Fig.4). The width of the model tail in the pV diagram is about 100 km s−1, well comparable to the observed velocity width. However, the smaller velocity width of the farthest parts of the tail is not reproduced by the model.
We conclude that galactic structure, that is, the location of spiral arms during the ram-pressure stripping event, determines the distribution of the gas surface density within the extended gas plume to a certain extent (gas surface density near the galac-tic disk, morphology of the vergalac-tical part). However, it cannot solve the discrepancy between the model and observations in the northwestern region of the gas tail which is closest to M 86 in projection on the sky (Fig.4).
3.1.2. The Hi disk
The observed and model Hi distributions within the galactic disk are presented in Fig.5for an inclination angle of i= 90◦. Since
the projection with i= 75◦does not significantly differ from the projection with i= 90◦, we do not show it in the Appendix. The observed western extent of the Hi disk is reproduced by all mod-els. However, a pronounced east-west asymmetry, as is observed, is only present in models 4 and 9. Still, the eastern half of the observed Hi disk is 20% and 25% more extended than those of models 4 and 9, respectively.
The observed and best-fit model Hi distributions within the galactic disk are presented in Fig. 6. Since we restricted our-selves to models 9 and 10 for the best-fit model, we present model 9 as the best-fit model. The observed Hi distribution has a central depression and is truncated at a radius of 5.7 kpc to the east and 3.4 kpc to the west with respect to the optical centre of the galaxy. The model shows the same, but less pronounced,
east-west asymmetry. However, the eastern side of the model Hi disk is ∼1.5 kpc less extended than its observed counterpart. None of the models reproduces the observed protruding Hi in the northwestern part of the galactic disk.
The position-velocity diagrams along the galaxy’s major axis are presented in Fig.7for an inclination angle of i= 90◦. Since the projection with i= 75◦does not significantly differ from the
projection with i= 90◦, we do not show it in the Appendix. Only models 1, 7, 9, and 10 show a small plateau of constant rotation velocity at the eastern side of the galactic disk. A common linear behaviour is seen in the western side of the pV diagram for all simulation snapshots.
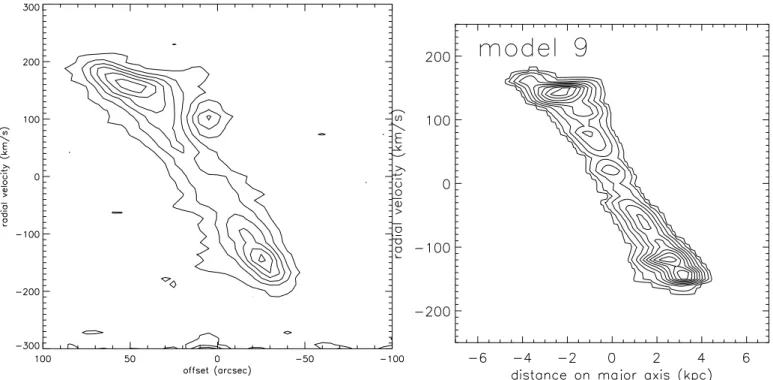
The observed position-velocity diagram shows a different kinematical behaviour of the two sides of the galactic disk (left panel of Fig.8): the western side has an almost constant veloc-ity gradient until the outer edge of the disk, whereas the velocveloc-ity gradient of the eastern side decreases significantly at a distance of >4000 = 3.4 kpc. This behaviour is qualitatively best
repro-duced by model 9 (right panel of Fig.8).
We conclude that galactic structure has a small but signifi-cant influence on the east-west asymmetry of the truncated Hi disk.
3.2. Hα
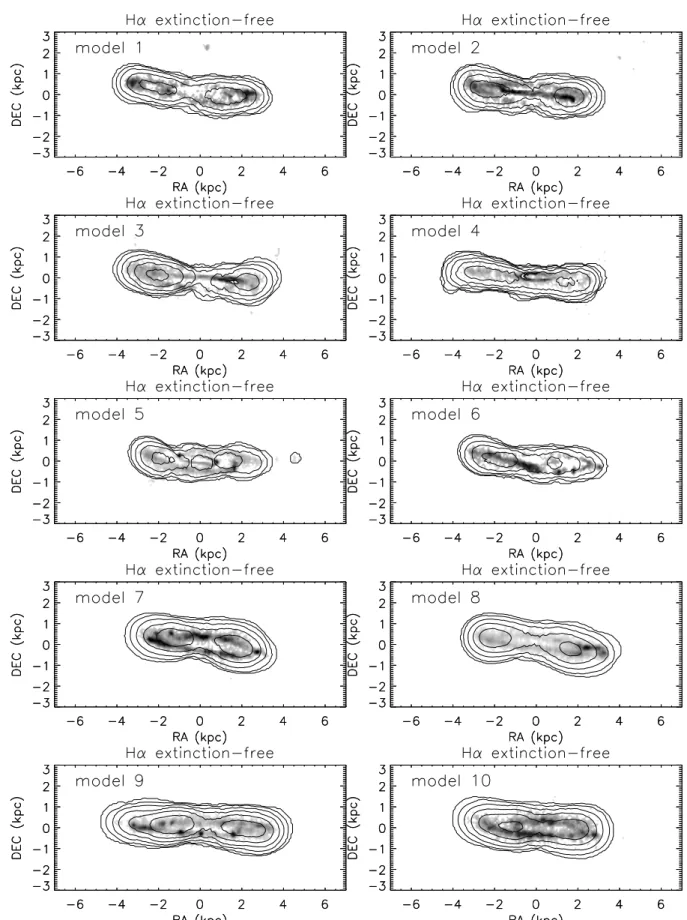
The model Hα maps of all models are presented in Fig.9for an inclination angle of i = 75◦. The corresponding model images
for i= 90◦are shown in Fig.B.1. By comparing the outer spiral arms (especially in models 6, 9, and 10) between the two figures, it becomes clear that the inclination angle changes the apparent sense of rotation: whereas it is counter-clockwise for i= 75◦, it
is clockwise for i= 90◦. Assuming trailing spirals, observations indicate an apparent counter-clockwise rotation of the galactic disk. All model Hα distributions show a central ring structure. In most cases, the ring has an asymmetric surface brightness dis-tribution. In addition, models 6, 9, and 10 show an arm structure in the eastern part of the galactic disk.
The observed and best-fit model (model 10) Hα maps are presented in Fig.10. The Spitzer 8 µm emission distribution is comparable to the Hα emission. These maps show the same east-west asymmetry as the Hi distribution: the eastern side is ∼1.5 times more extended than the western side. Two prominent spiral arms are visible in the northwestern and southeastern quadrants of the galactic disk. On the other hand, the 6 cm radio contin-uum map (Fig. 2 ofDamas-Segovia et al. 2016) shows more of a ring structure in the western part of the galactic disk. Thus, a high extinction is not excluded in the southwestern quadrant of
Fig. 7.Model Hi pV diagrams along the major axis with i = 90◦
.
the galactic disk. The only model which resembles the Hα/8 µm emission distribution of the eastern half of the galactic disk is model 10. Only in the presence of high extinction in the south-western quadrant of the galactic disk, is the Hα/8 µm emission distribution of the western half of the galactic disk reproduced by the model.
3.3. FUV
The FUV emission distribution traces star formation (∼100 yr) that is less recent than the Hα emission distribution (∼10 Myr). In addition, the FUV emission is prone to dust extinction. We determined the model 3D FUV emission by using the clocks associated to the newly created stellar particles (see Sect.2.2). In a second step, we calculated the dust extinction based on the 3D gas distribution by assuming a constant gas-to-dust ratio of 100. The resulting observed and model FUV emission distri-butions are presented in Fig.11for an inclination of i = 90◦,
and those for i = 75◦ are shown in Fig. C.1. For compari-son, the GALEX FUV emission of NGC 4388 (left panel of Fig.12) is very asymmetric: only the northwestern spiral arm is clearly visible. This means that the southeastern spiral arm is strongly obscured by the disturbed dusty interstellar medium of NGC 4388.
The model FUV emission distribution of almost all models is asymmetric, except model 3 with i = 90◦. Only the asym-metry of model 9 with i = 90◦ is comparable to the observed
asymmetry, that is, the emission in the northwestern quadrant of the galactic disk is prominent. We therefore assume that model 9 with i= 90◦best reproduces the GALEX FUV observations.
3.4. Polarized radio continuum
To calculate the large-scale regular magnetic field for our simula-tions, we follow the same procedure asSoida et al.(2006). Time-dependent gas-velocity fields provided by the 3D dynamical simulations were used as input for solving the dynamo (induction) equation using a second-order Godunov scheme with second-order upstream partial derivatives together with a second-order Runge-Kutta scheme for the time evolution. To avoid non-vanishing ∇ · B, we evolved the dynamo equation expressed by the magnetic potential A, where B = ∇ × A, (B is the magnetic induction):
∂
∂tB= ∇ × (u × B)∇ × (αB) − ∇ × (η∇ × B), (2)
where u is the large-scale velocity of the gas, and η the coe ffi-cient of a turbulent diffusion. We assume the magnetic field to be partially coupled to the gas via the turbulent diffusion pro-cess (Elstner et al. 2000) whilst assuming the magnetic diffusion coefficient to be η = 3 × 1025cm2s−1. We do not implement
any explicit dynamo process (α = 0). Our MHD calculations were carried out on a 3D grid of 2563 points, and with a
spa-tial resolution of 300 pc. For the inispa-tial conditions we adopt the magnetic vector potential appropriate to purely toroidal mag-netic field with an exponential distribution with a scale length of 1 kpc in the vertical direction. The MHD model does not con-tain a galactic wind.
The resulting polarized emission is calculated by assuming a density of relativistic electrons that is proportional to the model gas density ρ. This rather crude approximation is motivated by the fact that in quiescent galaxies, the density of relativistic elec-trons is approximately proportional to the star formation density which depends on ρ1−1.7.
The model and observed 6 cm polarized radio continuum emission distributions are presented in Fig. 13 for an inclina-tion angle of i = 75◦. The corresponding maps for i = 90◦are shown in Fig.D.1. The 6 cm polarized radio continuum emis-sion distribution is asymmetric in all models except for model 6, where i= 75◦. A significant east-west asymmetry is observed at i= 75◦in models 1, 2, 6, and 10, and at i= 90◦in models 1 and
Fig. 8.Left panel: VIVA Hi pV diagram along the major axis (Chung et al. 2009). Right panel: model Hi pV diagram along the major axis with i= 90◦
.
3. A significant north-south asymmetry is observed at i= 75◦in model 10, and at i= 90◦in models 2, 7, and 10.
The observed polarized emission at 6 cm is asymmetric (left panel of Fig.14). Whereas it is shifted to the south with respect to the galactic plane in the eastern half, it is shifted to the north in the western half of the galactic disk. The observed polarized emission along the minor axis of the galactic disk is caused by the nuclear outflow (Damas-Segovia et al. 2016; see also Fig. 5 ofYoshida et al. 2002).
The only model with a significant north-south asymme-try in the eastern half of the galactic disk is model 10 at an inclination of i = 75◦ (right panel of Fig. 14); it also shows some emission in the northwestern quadrant of the galactic disk, as observed. However, the model polarized radio contin-uum emission has a significant disk component which is not observed.
3.5. Optical spectrum of the gas-free part of the galactic disk We used the VLT FORS2 spectrum from Pappalardo et al. (2010) obtained with the GRIS-600B covering a wavelength range of 3350–6330 Å with a resolution of 1.48 Å per binned pixel. The average signal-to-noise ratio (S/N) per pixel is ∼26.
As inPappalardo et al.(2010) we derived an optical spec-trum from our simulations within a slit which is located at a distance of 4.5 kpc west of the galaxy centre. The slit size is 500 pc. To do so, we extracted all star particles from this region to obtain the star formation histories within for our ten mod-els (Fig. 15). The variations of the SFR for t < −200 Myr are due to galactic spiral arms. From the beginning of the simula-tions the model galaxy is affected by ram pressure which leads to an asymmetric distribution of the outer gas disk after ∼150– 200 Myr. Even small differences in the amount of ram pressure between the models at the beginning of the simulations with different time delays lead to a different star formation history within the slit at the times of interest. Models 3, 7, and 8 show an
increase of the SFR just before gas stripping that is more impor-tant than the increase caused by spiral arms. The star formation of all models with a stripping angle of 45◦ steeply decreases around t ∼ −250 Myr due to gas stripping by ram pressure. This timescale is significantly higher than the star formation quench-ing time of t = −190 ± 30 Myr obtained by Pappalardo et al. (2010). For a stripping angle of 30◦, star formation strongly decreases at t ∼ −200 Myr.
We used the star formation histories of Fig.15to obtain opti-cal spectra for the different models. Only one of these spectra is shown in Fig. 16, because of the strong resemblance between the spectra. Since the model star formation histories end at t = −800 Myr we had to assume a star formation history prior to this time step. We decided to use an exponentially declining SFR with three different normalizations (Fig.17)
SFR= fct × SFR0× exp(−t/τ), (3)
where fct = 0.7, 1, 1.2 and τ = 20, 25, 30, 40, 70, 100, 200, 400 Gyr. The range of metallicities was set between Z= 0.01 and 0.028 in steps of 0.02. The revised solar metallicity is Z= 0.014 (Asplund et al. 2009). For each comparison of the model spec-trum with the observed specspec-trum we calculated an associated χ2.
In addition, we only allowed for models whose χ2at the time of interest is minimum, that is, the χ2 increases for earlier or later
times of interest. Without doing so, a discrimination between the models based on the χ2distribution was not possible. This means that at this point of a refined modelling the optical spectrum gives only weak constraints.
The distributions of the χ2for the different model spectra are
shown in Fig.18for the solar and slightly subsolar metallicity models. In general, the most important influence on the χ2values
comes from metallicity: low-metallicity models yield smaller χ2 than high-metallicity models.
The percentage for the acceptance of a model χ2is set to the
inverse of the square root of the number of degrees of freedom. The number of degrees of freedom N is set to the number of
Fig. 9.Model Hi contours on model Hα emission distributions without extinction with i = 75◦.
independent points of the spectrum. With a spectral resolution of∆λ/λ = 780, a wavelength coverage of 2400 Å, and a central wavelength of 5000 Å, we find N ∼ 374. We thus set the limit for the acceptance of a model to χ2lim= 1.05 × min(χ2).
The smallest χ2value is χ2 = 0.549 at a metallicity of Z =
0.01. Models with a normalization fct = 0.7 do not appear in the list of acceptable models. Moreover, models with 20 ≤ τ ≤ 40 Gyr are preferred. For their parametric determination of the
Fig. 10.Left panel: VIVA Hi contours on Hα emission distribution (Yoshida et al. 2002). Right panel: model Hi contours on model Hα emission distribution without extinction with i= 75◦
.
star formation quenching time,Pappalardo et al.(2010) found a minimum value of χ2 = 0.597 for Z = 0.018. The corresponding
χ2 of model 9 with Z = 0.018 is χ2 = 0.593, that is, the star
formation history of model 9 leads to a slightly better fit of the optical spectrum than a truncated constant SFR.
The distributions of the different models with lowest χ2 are
shown in the lower panel of Fig. 18. For both metallicities, Z = 0.014 and Z = 0.01, models 2, 3, 4, 5, and 7 are preferred, whereas models 1, 6, 8, 9, and 10 are under-represented.
We define the model star formation quenching age as the time when the local SFR dropped below one third of its mean value for t < −230 Myr. The obtained star formation quench-ing age of 190 Myr and 200 Myr for models 9 and 10 are consistent with the quenching age derived byPappalardo et al. (2010) within their uncertainty of 30 Myr. Our quenching age is also broadly consistent with the quenching age determined by Crowl & Kenney (2008) from spectroscopic line indices. Given the differences in the model star formation histories before gas stripping, we believe that it is not excluded that Pappalardo et al. (2010), who assumed smooth star formation histories, have somewhat underestimated the uncertainty of the quenching age.
4. Discussion
Table2summarises the results obtained in Sect.3. Models 1 to 8 do not reproduce the majority of the available observations. We therefore conclude that models 9 and 10 are the preferred models and derive a ram-pressure wind angle of 30◦ from our
simula-tions. Even the preferred models have difficulties in reproducing the detailed large-scale Hi emission distribution and the polar-ized radio continuum emission distribution. The preferred incli-nation angle is i= 75◦, except for the FUV emission distribution
which is only reproduced with i = 90◦. Since this inclination leads to an apparent direction of rotation which is opposite to the observed direction, i= 75◦is the best choice for the
inclina-tion. For comparison,Veilleux et al.(1999) gave an inclination angle of i= 78◦.
Models 9 and 10 reproduce the extent and the radial velocity range of the Hi tail. Its width is only reproduced in the southern half of the tail. These models also reproduce the east-west asym-metry of the galactic Hi disk, its pV diagram, the FUV emission distribution, and the optical spectrum. Moreover, they qualita-tively reproduce the main features of the Hα and polarized radio continuum emission distributions. However, these best-fit mod-els do not reproduce the morphology of the northern half of the Hi tail, the protruding Hi feature in the northwestern part of the
galactic disk, the smaller velocity width of the far tail, and the detailed Hα and radio continuum emission distributions.
The dependence on the time of peak ram pressure makes it clear that galactic structure, for example, spiral arms, influence the outcome of a ram-pressure stripping event: the large-scale and small-scale Hi distribution and the α/8 µm, FUV, and polar-ized radio continuum emission distribution. This influence is similar to what was observed byNehlig et al.(2016) for another Virgo galaxy, NGC 4501, which undergoes active ram-pressure stripping. The optical spectrum of the gas-free region of the galactic disk shows a rather weak dependence on galactic struc-ture. We thus conclude that for the detailed reproduction of multi-wavelength observations of a spiral galaxy that is under-going or has undergone a ram-pressure stripping event, galactic structure must be taken into account.
The Hi disk truncation radius is given by the peak ram pres-sure during the stripping event (pmax= 8.3×10⁻¹¹dyn cm−2). The
extent of the tail is determined by the width of the temporal ram-pressure profile (∆t = 100 Myr). This is entirely consistent with a radial orbit of NGC 4388 within the Virgo cluster (Vollmer et al. 2001). The present day ram pressure is ptoday = 0.15 × pmax =
1.25 × 10⁻¹¹dyn cm−2. This value is consistent with the model of Vollmer & Huchtmeier(2003). With an intracluster medium den-sity of nICM = 3 × 10⁻⁴cm−3(Damas-Segovia et al. 2016) and
a molecular weight of µ = 0.6, this yields a galaxy velocity of vgal∼ 2200 km s−1, which is about a factor of 1.5 higher than its
radial velocity with respect to the cluster mean. The normalized 3D vector of the galaxy velocity is vmodelgal = (0.11, −0.69, 0.72)2. The model radial velocity is therefore vmodel
rad = 0.72 × v model gal =
1580 km s−1, which is consistent with the observed radial
veloc-ity of vgal= 1420 km s−1. Compared to the geometrical model put
forward byVeilleux et al.(1999), our model has a non-negligible galaxy motion to the south. The arrows on the left side of their Fig.5, which represent the ICM wind direction, are inclined by 40◦in our model: the angle between the wind and the disk of 30◦ plus 10◦from the galaxy inclination.
At the time of interest, 240 Myr after peak ram pressure, the disk gas is no longer actively stripped. The inspection of the face-on evolution of the gas disk shows that even more than 100 Myr before the time of interest the truncated gas disks become oval and develop intermittent gas arms. Since there is no longer an overdensity observed at the windward side, these structures are caused by the resettling of the gas that has been violently pushed to smaller galactic radii by strong ram pressure
Fig. 11.Model Hi contours on model FUV emission distributions with i = 90◦
Fig. 12.Left panel: VIVA Hi contours on GALEX FUV emission distribution. Right panel: model Hi contours on model FUV emission distribution with i= 90◦
.
around its peak value. In agreement withDamas-Segovia et al. (2016), we thus conclude that the observed asymmetries in the disk of NGC 4388 are not caused by the present action of ram pressure, but by the resettling of gas that has been pushed out of the galactic disk during the ram-pressure stripping event.
With an Hi deficiency of defHI = 1.1 ± 0.3 and an Hi
mass of 3.7 × 10⁸M
(Chung et al. 2009), the total Hi mass
prior to the ram-pressure stripping event was of the order of MHI, prior ∼ 4 × 10⁹M with an uncertainty of a factor of two.
Therefore, a gas mass of 3.6 × 10⁹M was stripped from the
galaxy, of which only 3.4 × 10⁸M
or 10% was detected by
Oosterloo & van Gorkom (2005). The two regions of highest column densities (∼1020cm−2) in the model gas tail are located
at projected coordinates (−22 kpc, 40 kpc) and (−57 kpc, 77 kpc). The observed regions of highest column densities (∼1020cm−2)
are located between 27 and 36 kpc east and between 40 and 70 kpc north of the galaxy centre. As predicted byVollmer et al. (2001), even molecular gas clouds with masses of a few 106M
exist in the plume region of high column densities at z ∼ 70 kpc (Verdugo et al. 2015).
The initial radial profile of the gas surface density is expected to play a role for the morphology of the Hi tail at the time of interest. Our initial model profile shows a rapid decrease from 10 to 4 M pc2between 7.5 and 9 kpc. Since this part of the gas
disk is stripped first, we expect it to be located in the northern half of the tail at the time of interest. If the initial model profile has a constant gas surface density of 10 M pc2up to the optical
radius, like that of NGC 3521 (Leroy et al. 2008) for example, we expect to observe higher Hi surface densities in the northern half of the model gas tail.
No instabilities which give rise to turbulent motions of the stripped gas are included in the model. Once the model gas clouds are pushed out of the galactic disk, they react like ballistic particles of constant surface density subjected to the ram-pressure wind. The resemblance between the observed and the modelled gas plume therefore seems surprising, because tur-bulence might be expected in the galaxy’s wake which should lead to rapid mixing of the ISM with the ICM leading to a lower cloud surface densityΣcl. Since the acceleration by ram pressure
is arp = pram/Σcl, the mixed clouds are expected to be stripped
more efficiently. This would lead to a larger extension of the gas tail at the time of interest and an earlier time of interest might have to be chosen based on the extension of the Hi tail which could potentially lead to a contradiction with the observed star formation quenching age.
Recent studies of the X-ray emission of the leading edges of ram-pressure-stripped elliptical galaxies showed that the
viscosity is at most 5–10% of the isotropic Spitzer-like viscos-ity (Roediger et al. 2015;Su et al. 2017; Ichinohe et al. 2017). In addition, thermal conduction is suppressed by at least a fac-tor of ∼50 (Vikhlinin et al. 2001; Sun et al. 2005, 2007) and X-ray tails of stripped gas do not become hotter with increas-ing distance to the galaxy (Sun et al. 2010;Zhang et al. 2013). Magnetic fields are most probably responsible for the suppres-sion of viscosity and heat conduction (see, e.g.Pope et al. 2005; Vijayaraghavan & Sarazin 2017). In light of these facts, the resemblance between the modelled and the observed tail can be explained by inefficient gas mixing and thermal conduction of the stripped gas.
The total mass of the model gas plume in the range 7.5 kpc ≤ z ≤ 100 kpc with column densities in excess of 3 × 1019cm−2
is 7.7 × 10⁸M , a factor of approximately two higher than the
observed Hi in the extended gas plume. The model gas mass in the range 7.5 kpc ≤ z ≤ 100 kpc is in agreement with the observed gas mass for a limiting column density of 8×1019cm−2.
This means that ISM–ICM mixing and heating through thermal conduction does occur, but these are slow processes. Since the gas left the galactic disk about 200 Myr ago (the star forma-tion quenching timescale), the mixing and thermal conducforma-tion timescales should be of the same order to decrease the atomic gas mass by a factor of two.
Vollmer et al. (2001) estimated the timescale of saturated evaporation by the ICM to be tsatevap∼ 10 × (N/(1020cm−2)) Myr,
where N is the column density of the stripped gas based on the results ofCowie & McKee(1977). If the Hi clouds were stripped with a typical column density of 1021cm−2within galactic disks, the evaporation time would be tsat
evap∼ 100 Myr. As already stated
above, in the presence of a magnetic field configuration that inhibits heat flux (e.g. a tangled magnetic field), this evaporation time can increase significantly (Cowie et al. 1981). We suggest that the observed presence of Hi at vertical distances of ∼70 kpc is evidence for an evaporation timescale that is comparable or somewhat larger than the star formation quenching timescale of 200 Myr. With a thermal conduction that is suppressed by 25–50 times, an evaporation time of 200 Myr corresponds to a cloud column density of ∼8 to 4 × 1019cm−2, which is close
to the limiting Hi column density for consistency between the observed and model gas mass in the extended tail of NGC 4388. We therefore suggest that gas of lower column density has been evaporated by the hot ICM. We conclude that the presence of the huge low column density Hi tail of NGC 4388 with a gas stripping timescale of ∼200 Myr is consistent with a suppression of the thermal conductivity by a factor of about 25–50 (see also Tonnesen et al. 2011).
Fig. 13.Model polarized emission distributions on model Hi distribution with i = 75◦
Fig. 14.Left panel: 6 cm polarized emission distribution (Damas-Segovia et al. 2016) on VIVA Hi distribution. Right panel: model polarized emission distribution on model Hi distribution with i = 75◦
.
Fig. 15.Normalized model star formation histories. The time t= 0 Myr is the time of interest.
Ram-pressure stripping by the ICM of M 86 is improbable In the present scenario the gas of NGC 4388 has been stripped by the ICM of M 87. The proximity of NGC 4388 to M 86 might suggest that an alternative scenario is ram-pressure stripping by the ICM of M 86. In the following we give our reasons for why we think that this alternative scenario is highly improbable.
Firstly, since the ICM distributions are very much peaked on M 87 and M 86, NGC 4388 would have to come much closer to M 86 than to M 87 (despite the 2 times higher veloc-ity that is equivalent to an increase of ICM densveloc-ity of a fac-tor of 4). The ram-pressure time profile would be much nar-rower and there would be less stripping (less amount of encoun-tered ICM, seeJáchym et al. 2009). This is a more probabilistic argument.
Secondly, the trajectory given by the model wind direction is consistent with stripping by the M 87 ICM (Vollmer 2009).
Finally, the Hi tail of NGC 4388 is located in front of M 86 (dust absorption). Given the radial velocities (NGC 4388: 2585 km s−1; M 86: −224 km s−1), NGC 4388 must have passed
M 86 to the south. The spatial extent of the Hi tail (∼100 kpc) and a timescale of 250 Myr implies a velocity in the plane of the sky of ∼380 km s−1. With a radial velocity of 2585 + 224 km s−1 = 2800 km s−1, the axis ratio of the tail would be
p
(x2+ y2)/z ∼ 0.15, that is, its extent in the radial direction
would be 670 kpc. The passage of NGC 4388 south of M 86 is in contradiction to the northern tip of the Hi tail that extends north of M 86, except if stripping began much earlier than the time of peak ram pressure. Since the stripped Hi is never accelerated to the ICM velocity and there is always a time delay between maximum ram pressure and effective gas stripping, the northern tip of the Hi tail should have moved even further to the south of M 86. In the present simulations the ratio between the size of the tail and the distance travelled since closest approach is approximately 0.5.
5. Conclusions
The spectacular extended Hi plume of spiral galaxy NGC 4388 is unique in the Virgo cluster (Oosterloo & van Gorkom 2005). This galaxy fulfills all criteria for having undergone a recent ram-pressure stripping event caused by its highly eccentric orbit within the Virgo cluster which led it close to the cluster centre where the density of the ICM is high (see, e.g.,Vollmer 2009):
✥ ✁ ✂ ✵ ✵✁ ✶✵ ✶✵✁ ❲✄☎✆✝✆ ✞✟✠✡☛ ☞ ✞✟✌ ✠✍✎✆✏✑ ◆ ✒ ✓ ✔ ✕ ✖ ✗ ✘ ✙
Fig. 16.Optical spectrum for model 9 (red) with Z= 0.014, fct = 1.2, τ = 70 Gyr together with the observed spectrum. The residuals are shown as the lower black line. Blanked regions are shown in green. The bottom of the panel shows the residuals (black) and the observational errors (cyan). The subtracted continuum is shown as a blue line.
−1000 −500 0 0.0 0.5 τ = 100 − Z = 0.02 − BV mod = 1
Normalized SFR
time [Myr]
fct = 0.7
fct = 1.0
fct = 1.2
Fig. 17.Star formation histories of model 1 for which model spectra were obtained. The timescale for the exponential SFR is τ = 100 Gyr (Eq. (3)).
– NGC 4388 has a strongly truncated Hi (Chung et al. 2009) and Hα disk (Yoshida et al. 2002),
– an asymmetric ridge of polarized radio continuum emission (Vollmer et al. 2007;Damas-Segovia et al. 2016),
– extended extraplanar gas toward the opposite side of the ridge of polarized radio continuum emission (Oosterloo & van Gorkom 2005), and shows
– a recent (a few 100 Myr) quenching of the star formation activity in the outer, gas-free galactic disk (Pappalardo et al. 2010).
Nehlig et al. (2016) showed for another Virgo cluster galaxy, NGC 4501, that the location of galactic spiral arms during the interaction between the ISM and the ICM significantly influ-ences the evolution of the gas surface density distribution.
Fig. 18.Upper panel: distribution of the model χ2for Z ≥ 0.01. The
dotted line represents the limit (1.05 × min(χ2)) for the accepted models
shown in the lower panel. Lower panel: the distribution of the different models with the lowest χ2.
We made numerical simulations of the ram-pressure strip-ping event to investigate the influence of galactic structure on the observed properties of NGC 4388. In each simulation the spi-ral arms are located differently with respect to the direction of the galaxy’s motion within the ICM. We tested different orbits, wind angles, and angles between the ram-pressure wind and the
galactic disk. The multiwavelength observations are best repro-duced by a wind angle of 30◦.
Out of ten simulations, only two could approximately repro-duce the following observational constraints.
– The extent of the extended Hi plume and the surface density distribution of its southern half,
– the east-west asymmetry of the Hi disk,
– the asymmetry of the Hi position-velocity diagram along the major axis of the galactic disk,
– the FUV emission distribution,
– the southern asymmetric ridge of polarized radio continuum emission, and
– the optical spectrum of the outer, gas-free region of the galac-tic disk.
Given the degeneracies between the effects of galactic structure, time of peak ram pressure, wind angle, and temporal ram-pressure profile on the outcome of the simulations, we could not find one single simulation and projection that fulfilled all our criteria. Models 9 and 10 (Table2) with an inclination angle of i= 75◦are consistent with a maximum of the observational constraints.
These best-fit models do not reproduce the morphology of the northern half of the Hi tail, the protruding Hi feature in the northwestern part of the galactic disk, the smaller velocity width of the far tail, or the detailed Hα and radio continuum emission distributions.
The derived time since the quenching of the star forma-tion activity of the outer, gas-free disk is ∼200 Myr. This time is somewhat shorter than the time since maximum ram pres-sure (∼240 Myr). The peak ram prespres-sure was pmax = 8.3 ×
10−11dyn cm−2and the present ram pressure is p
today = 1.25 ×
10−11dyn cm−2. The 3D velocity vector of NGC 4388 is vgal =
(0.11, −0.69, 0.72). The galaxy velocity within the ICM is vgal∼
2200 km s−1.
Based on our results we make the following conclusions. 1. The combination of a deep optical spectrum of the outer
gas-free region of the galactic disk together with deep Hi, Hα, FUV, and polarized radio continuum data permits us to constrain numerical simulations to derive the temporal ram-pressure profile, the 3D velocity vector of the galaxy, and the time since peak ram pressure with a high level of confidence. 2. For the detailed reproduction of multi-wavelength observa-tions of a spiral galaxy that is undergoing or has undergone a ram-pressure stripping event, galactic structure must be taken into account.
3. The observed asymmetries in the disk of NGC 4388 are not caused by the present action of ram pressure, but by the resettling of gas that has been pushed out of the galac-tic disk during the ram-pressure stripping event (see also Damas-Segovia et al. 2016).
4. The presence of the huge low column density Hi tail of NGC 4388 with a gas stripping timescale of ∼200 Myr is consistent with a suppression of the thermal conductivity by a factor of approximately 25–50.
Acknowledgements. BV would like to thank A. Damas for sharing the JVLA image of NGC 4388 and Ming Sun for sharing his insights on gas viscos-ity and thermal conduction. MS acknowledges the support by the Polish National Science Centre (NCN) through the grant 2012/07/B/ST9/04404. CP acknowledges support from the Science and Technology Foundation (FCT, Portugal) through the Postdoctoral Fellowship SFRH/BPD/90559/2012, PEst-OE/FIS/UI2751/2014, PTDC/FIS-AST/2194/2012, and through the support to the IA activity via the UID/FIS/04434/2013 fund.
References
Asplund, M., Grevesse, N., Sauval, A. J., & Scott, P. 2009,ARA&A, 47, 481
Bigiel, F., Leroy, A., Walter, F., et al. 2008,AJ, 136, 2846
Boulares, A., & Cox, D. P. 1990,ApJ, 365, 544
Cayatte, V., van Gorkom, J. H., Balkowski, C., & Kotanyi, C. 1990,AJ, 100, 604
Chamaraux, P., Balkowski, C., & Gerard, E. 1980,A&A, 83, 38
Chung, A., van Gorkom, J. H., Kenney, J. D. P., Crowl, H., & Vollmer, B. 2009,
AJ, 138, 1741
Cowie, L. L., & McKee, C. F. 1977,ApJ, 211, 135
Cowie, L. L., McKee, C. F., & Ostriker, J. P. 1981,ApJ, 247, 908
Crowl, H. H., & Kenney, J. D. P. 2008,AJ, 136, 1623
Damas-Segovia, A., Beck, R., Vollmer, B., et al. 2016,ApJ, 824, 30
Elmegreen, B. G., & Falgarone, E. 1996,ApJ, 471, 816
Elstner, D., Otmianowska-Mazur, K., von Linden, S., & Urbanik, M. 2000,
A&A, 357, 129
Giovanelli, R., & Haynes, M. P. 1983,AJ, 88, 881
Ichinohe, Y., Simionescu, A., Werner, N., & Takahashi, T. 2017,MNRAS, 467, 3662
Jáchym, P., Köppen, J., Palouš, J., & Combes, F. 2009,A&A, 500, 693
Kenney, J. D. P., van Gorkom, J. H., & Vollmer, B. 2004,AJ, 127, 3361
Leitherer, C., Schaerer, D., Goldader, J. D., et al. 1999,ApJS, 123, 3
Leroy, A. K., Walter, F., Brinks, E., et al. 2008,AJ, 136, 2782
Nehlig, F., Vollmer, B., & Braine, J. 2016,A&A, 587, A108
Oosterloo, T., & van Gorkom, J. 2005,A&A, 437, L19
Otmianowska-Mazur, K., & Vollmer, B. 2003,A&A, 402, 879
Pappalardo, C., Lançon, A., Vollmer, B., et al. 2010,A&A, 514, A33
Pope, E. C. D., Pavlovski, G., Kaiser, C. R., & Fangohr, H. 2005,MNRAS, 364, 13
Roediger, E., Kraft, R. P., Nulsen, P. E. J., et al. 2015,ApJ, 806, 104
Soida, M., Otmianowska-Mazur, K., Chy˙zy, K., & Vollmer, B. 2006,A&A, 458, 727
Springel, V., Yoshida, N., & White, D. M. 2001,NA, 6, 79
Su, Y., Kraft, R. P., Roediger, E., et al. 2017,ApJ, 834, 74
Sun, M., Vikhlinin, A., Forman, W., Jones, C., & Murray, S. S. 2005,ApJ, 619, 169
Sun, M., Jones, C., Forman, W., et al. 2007,ApJ, 657, 197
Sun, M., Donahue, M., Roediger, E., et al. 2010,ApJ, 708, 946
Tonnesen, S., Bryan, G. L., & Chen, R. 2011,ApJ, 731, 98
Veilleux, S., Bland-Hawthorn, J., Cecil, G., Tully, R. B., & Miller, S. T. 1999,
ApJ, 520, 111
Verdugo, C., Combes, F., Dasyra, K., Salomé, P., & Braine, J. 2015,A&A, 582, A6
Vijayaraghavan, R., & Sarazin, C. 2017,ApJ, 841, 22
Vikhlinin, A., Markevitch, M., Forman, W., & Jones, C. 2001,ApJ, 555, L87
Vollmer, B. 2009,A&A, 502, 427
Vollmer, B., & Huchtmeier, W. 2003,A&A, 406, 427
Vollmer, B., Cayatte, V., Balkowski, C., & Duschl, W. J. 2001,ApJ, 561, 708
Vollmer, B., Soida, M., Otmianowska-Mazur, K., et al. 2006,A&A, 453, 883
Vollmer, B., Soida, M., Beck, R., et al. 2007,A&A, 464, L37
Vollmer, B., Braine, J., Pappalardo, C., & Hily-Blant, P. 2008,A&A, 491, 455
Vollmer, B., Soida, M., Braine, J., et al. 2012,A&A, 537, A143
Wiegel, W. 1994,Diploma Thesis, University of Heidelberg
Yoshida, M., Yagi, M., Okamura, S., et al. 2002,ApJ, 567, 118
Appendix A: Atomic hydrogen model2 model1 model4 model3 model6 model5 model8 model7 model10 model9
Fig. A.1.Model Hi large-scale distributions with i = 75◦
Appendix B: Hα
Fig. B.1.Model Hi contours on model Hα emission distributions without extinction with i = 90◦
Appendix C: FUV
Fig. C.1.Model Hi contours on model FUV emission distributions with i = 75◦
Appendix D: Polarized radio continuum
Fig. D.1.Model polarized emission distributions on model Hi distribution with i = 90◦