HAL Id: hal-00304863
https://hal.archives-ouvertes.fr/hal-00304863
Submitted on 7 Nov 2005
HAL is a multi-disciplinary open access
archive for the deposit and dissemination of
sci-entific research documents, whether they are
pub-lished or not. The documents may come from
teaching and research institutions in France or
abroad, or from public or private research centers.
L’archive ouverte pluridisciplinaire HAL, est
destinée au dépôt et à la diffusion de documents
scientifiques de niveau recherche, publiés ou non,
émanant des établissements d’enseignement et de
recherche français ou étrangers, des laboratoires
publics ou privés.
climatological drought: an evaluation of the
Standardized Precipitation Index in a mountainous
Mediterranean basin
S. M. Vicente-Serrano, J. I. López-Moreno
To cite this version:
S. M. Vicente-Serrano, J. I. López-Moreno. Hydrological response to different time scales of
climatolog-ical drought: an evaluation of the Standardized Precipitation Index in a mountainous Mediterranean
basin. Hydrology and Earth System Sciences Discussions, European Geosciences Union, 2005, 9 (5),
pp.523-533. �hal-00304863�
SRef-ID: 1607-7938/hess/2005-9-523 European Geosciences Union
Earth System
Sciences
Hydrological response to different time scales of climatological
drought: an evaluation of the Standardized Precipitation Index in a
mountainous Mediterranean basin
S. M. Vicente-Serrano1,2and J. I. L´opez-Moreno1
1Instituto Pirenaico de Ecolog´ıa, CSIC (Spanish Research Council), Campus de Aula Dei, P.O. Box 202, Zaragoza 50 080,
Spain
2Unit for Landscape Modelling, University of Cambridge, Sir William Hardy Building, Tennis Court Road, Cambridge, CB2
1QB, UK
Received: 3 June 2005 – Published in Hydrology and Earth System Sciences Discussions: 28 July 2005 Revised: 4 October 2005 – Accepted: 7 October 2005 – Published: 7 November 2005
Abstract. At present, the Standardized Precipitation Index
(SPI) is the most widely used drought index to provide good estimations about the intensity, magnitude and spatial extent of droughts. The main advantage of the SPI in comparison with other indices is the fact that the SPI enables both deter-mination of drought conditions at different time scales and monitoring of different drought types. It is widely accepted that SPI time scales affect different sub-systems in the hydro-logical cycle due to the fact that the response of the different water usable sources to precipitation shortages can be very different. The long time scales of SPI are related to hydro-logical droughts (river flows and reservoir storages). Never-theless, few analyses empirically verify these statements or the usefulness of the SPI time scales to monitor drought. In this paper, the SPI at different time scales is compared with surface hydrological variables in a big closed basin located in the central Spanish Pyrenees. We provide evidence about the way in which the longer (>12 months) SPI time scales may not be useful for drought quantification in this area. In general, the surface flows respond to short SPI time scales whereas the reservoir storages respond to longer time scales (7–10 months). Nevertheless, important seasonal differences can be identified in the SPI-usable water sources relation-ships. This suggests that it is necessary to test the drought in-dices and time scales in relation to their usefulness for mon-itoring different drought types under different environmental conditions and water demand situations.
Correspondence to: S. M. Vicente-Serrano
1 Introduction
Drought is one of the main natural hazards affecting the economy and the environment of large areas (Obasi, 1994; Bruce, 1994; Wilhite, 2000). Droughts cause crop losses
(Austin et al. 1998; Leilah and Al-Khateb, 2005),
ur-ban water supply shortages (De Gaetano, 1999), social alarm (Morales et al., 2000), degradation and desertification (Nicholson et al., 1998; Pickup, 1998; Evans and Geerken, 2004), and forest fires (Pausas, 2004; Flannigan and Har-rington, 1988).
Drought is a complex phenomenon which involves differ-ent human and natural factors that determine the risk and vul-nerability to drought. Although the definition of drought is very complex (Wilhite and Glantz, 1985), it is usually related to a long and sustained period in which water availability be-comes scarce (Havens, 1954; Dracup et al., 1980; Redmond, 2002). Drought can be considered to be essentially a climatic phenomenon (Palmer, 1965; Beran and Rodier, 1985) related to an abnormal decrease in precipitation (Oladipo, 1985; Mc-Kee et al., 1993).
The spatial extent of droughts is usually much greater than for other natural hazards and the impacts are generally non-structural and difficult to quantify. Compared with other hydrological hazards, such as floods, the development of droughts is slow and it is very difficult to identify the mo-ment in which droughts start and finish (Burton et al., 1978). Thus, drought is probably the best example of a “penetrat-ing” nature hazard. Usually, droughts are only recognised when human activities and the environment are affected.
Important efforts for developing methodologies to quan-tify different aspects related to droughts have been made, such as the spatial differences in the drought hazard
(Vicente-Serrano and Beguer´ıa, 2003; Lana et al., 1998; Beersma and Buishand, 2004), the prediction of droughts by means of the use of atmospheric circulation indices (Cordery and McCall, 2000; Lloyd-Hughes and Saunders, 2002), and the mitigation of drought effects (WMO, 2000). However, more efforts have been made to develop drought indices, which allow an earlier identification of droughts, their inten-sity and surface extent. During the twentieth century, sev-eral drought indices were developed, based on different vari-ables and parameters (Heim, 2002). Drought indices are very important for monitoring droughts continuously in time and space, and drought early warning systems are based primar-ily on the information that drought indices provide (Svoboda et al., 2002).
Together with the problems for clearly establishing the spatial and temporal extent of droughts, other important problems are involved in monitoring droughts, problems which are related to the different time scales of this phe-nomenon. McKee et al. (1993) indicated that usable water re-sources include soil moisture, ground water, snowpack, river discharges, and reservoir storages. The time period from the arrival of precipitation until usable water is available differs considerably. Thus, the time scale over which precipitation deficits accumulate becomes extremely important and func-tionally separates different types of drought: hydrological, environmental, agricultural, urban, etc.
The different response of hydrological systems to precip-itation can vary noticeably as a function of the time scales (Changnon and Easterling, 1989; Pandey and Ramasastri, 1999; Elfatih et al., 1999). This is determined by the differ-ent frequencies of the hydrologic/climatic variables (Skøien et al., 2003). Peters et al. (2005) have shown that the propa-gation of the climatic droughts to the groundwater decreases the number of droughts and causes a shift in the drought dis-tribution. Therefore, the drought indices used must be asso-ciated to a specific timescale to be operative for management purposes in each of the different usable water sources.
The majority of drought indices have a fixed time scale. For example, the Palmer Drought Severity Index (PDSI, Palmer, 1965) has a time scale of about 9 months (Guttman, 1998), which does not allow identification of droughts at shorter time scales. Moreover, this index has many other problems related to calibration and spatial comparability (Guttman et al., 1992; Karl, 1983; Alley, 1984). To solve these problems, McKee et al. (1993) developed the Standard-ized Precipitation Index (SPI), which can be calculated at dif-ferent time scales to monitor droughts in the difdif-ferent usable water resources. Moreover, the SPI is comparable in time and space (Hayes et al., 1999; Lana et al., 2001; Wu et al., 2005).
The SPI was developed in 1993 following a careful pro-cedure (Redmond, 2002), but due to its robustness it has already been widely used to study droughts in different re-gions, among others the USA (Hayes et al., 1999), Italy (Bonaccorso et al., 2003); Hungary (Domonkos, 2003);
Ko-rea (Min et al., 2003); Greece (Tsakiris and Vangelis, 2004), and Spain (Vicente-Serrano et al., 2004; Lana et al., 2001), and the SPI has also been included in drought monitoring systems and management plans (Wu et al., 2005).
In general, different studies have indicated the usefulness of the SPI to quantify different drought types (Edwards and McKee, 1997; Hayes et al., 1999; Komuscu, 1999; White et al., 2000). The long time scales (over 6 months) are consid-ered as hydrological drought indicators (river discharges or reservoir storages) (McKee et al., 1993; Hayes et al., 1999).
Although the SPI is widely used (Wu et al., 2005), there are not many empirical studies that provide evidence about the usefulness of the different time scales for drought moni-toring in surface water resources. Among the limited studies on this topic, in Hungary Szalai et al. (2000) analysed the re-lationships between time scales of SPI, river discharges and reservoir storages, showing important spatial differences.
This paper analyses the usefulness of different SPI time scales to monitor droughts in river discharges and reservoir storages. Moreover, the monthly differences in the response of both hydrologic sub-systems to droughts were also anal-ysed. The study was carried out in a large basin located in the central Spanish Pyrenees where there is a high complexity of hydrological processes with a marked seasonal as well as in-terannual variability. The objective is to determine the most adequate time scales of SPI to monitor droughts in two ba-sic water usable sources: river discharges and reservoir stor-ages. This is useful for monitoring drought intensity and im-proving the assessment of the availability of water resources by means of monthly precipitation data, a climatic parame-ter widely recorded. Mountain areas, as the analysed here, are the main source of hydrological resources in the Mediter-ranean region.
2 Study area and the Yesa reservoir
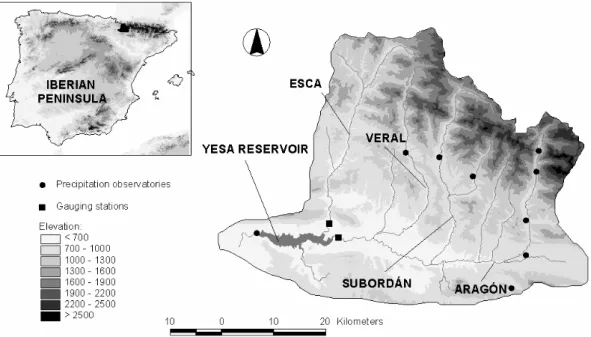
The study was carried out in the high basin of the Aragon River, in the central Spanish Pyrenees (Fig. 1). The area was selected because it is a delimited hydrological system closed by the Yesa reservoir, which finally retains the wa-ter resources that the basin collects. Moreover, two hydro-logic variables can be summarised within the basin: river discharges and reservoir storages.
The surface of the basin is 2181 km2. It is a
mountain-ous area, with a wide range of altitudes (from 2886 m in the Collarada peak to less than 500 m in the Yesa reservoir), complex topography and dominated by steep slopes. Relief and lithology are arranged in parallel bands in a NW-SE di-rection (Soler-Sampere and Puigdef´abregas, 1972). Thus, the Aragon river runs north-south across the paleozoic area (limestones, shales and clays), the Inner Sierras (limestones and sandstones) and the Flysch Sector. Then it arrives to the Inner Depression (marls), and runs westward until the Yesa reservoir.
Figure 1: Location and relief of the study area and spatial distribution of meteorological
stations used for analysis
Fig. 1. Location and relief of the study area and spatial distribution of meteorological stations used for analysis.
Plant cover has been strongly impacted by human activ-ities. Historically, cultivated areas have been located be-low 1600 m a.s.l. in the valley bottoms, perched flats and steep, south-facing hillslopes, which were cultivated even under shifting agricultural systems. Actually, most of the fields have been abandoned (except in the Inner Depression) and now are covered by shrubs or have been reforested with pines. The forests remain relatively well preserved in the north facing slopes and everywhere between 1600–1800 m. The subalpine belt (up to 2200 m) was extensively burnt dur-ing the Middle Ages (Montserrat, 1992).
In the low elevated areas the mean annual precipitation is 800 mm. This value is overcome in the rest of the basin; above 1500 m, the precipitation is higher than 1500 mm. The annual variability is very high (i.e. in the meteorolog-ical station of Canfranc the maximum annual precipitation was recorded in 1979 with 2744 mm, whereas the minimum was in 1957 with 1034 mm), and the rainy season extends from October to June. Intense precipitation events can occur throughout all the year (White et al., 1997) although they are more frequents during autumn. Extreme precipitation events can exceed 100 mm in a day (i.e. the maximum daily
precip-itation in the area ranges between 156 mm day−1recorded in
Canfranc, and 100 mm day−1in Jaca).
Mean temperature is 12◦C in the inner depression.
Dur-ing the cold season (November to April) the isotherm of 0◦C is located over 1500 m a.s.l. (Garc´ıa-Ruiz et al., 1985). This isotherm explains the great importance of snow accu-mulation in the availability of winter and spring water re-sources (L´opez-Moreno and Garc´ıa-Ruiz, 2004). The abun-dant winter precipitation produces high runoff in the lower
sector of the study area. Above the elevations in which
the 0◦C isotherm is recorded during the winter,
precipita-tion is retained in solid form and melts from April to June. Thus, from the end of autumn until June there exists a pro-longed period of high inflows to the Yesa reservoir, with a maximum in May and June. In summer the scarcity of precipitation and the exhaustion of the snowpack produce a marked period of low discharges. The total annual contribu-tion of the Aragon and Esca rivers for the analyzed period was 1327 hm3(42 m3s−1).
The Yesa reservoir collects all the surface runoff produced in the studied basin. The Yesa dam is 74 m high and was
built in 1959 with an original capacity of 470 hm3. The
Bar-denas Canal, with a maximum capacity of 64 m3s−1, starts
from the reservoir to supply water to newly irrigated areas in semiarid sectors of northeast Spain. Reservoir management is focused on reaching the maximum stored volume in May or June. This aim is achieved by releasing fewer discharges than inflows from October to June. However, large differ-ences in the rhythm of filling have been found according to the hydro-climatic condition of each year (L´opez-Moreno et al., 2005). In summer, the coincidence of the lowest inflows to the reservoir with the highest water demand to irrigation areas rapidly exhausts the water stored.
3 Methodology
3.1 Precipitation data
To carry out our analysis we used different hydrological vari-ables. The precipitation data used to calculate the SPI was obtained in 8 meteorological stations within the valley (to
Table 1. Correlation between the regional series and the
precipita-tion series of the different meteorological staprecipita-tions. Meteorological station R-pearson Castiello 0.94 Jaca 0.93 Bernues 0.85 Arag. Puerto 0.92 Anso 0.97 Canfranc 0.92 Hecho 0.94 Yesa 0.84
see spatial distribution in Fig. 1). Data were provided by the National Institute of Meteorology (Spain) and covers the pe-riod between 1950 and 2000. To avoid inhomogeneities in the data (Peterson et al., 1998) we tested the homogeneity of series by means the Standard Homogeneity Normal Test (SHNT, Alexandersson, 1986) using relative homogenisation procedure by means of reference series created following Pe-terson and Easterling (1994). For homogenisation procedure the ANCLIM program was used ( ˇSt`ıp´anek, 2004). The tem-poral gaps (<20%) in the meteorological stations were com-pleted using linear regressions upon the respective reference series. From homogeneous precipitation records, we created a regional precipitation series by means of the weighted av-erage of monthly records. The weight was the surface repre-sented by each meteorological station by means of Thiessen polygons method, following Jones and Hulme (1996). Re-gional precipitation series represent the temporal evolution of precipitation in the whole of the basin. Table 1 shows the coefficients of correlation among the monthly precipitation series in each meteorological station and the regional series. Correlations are high and significant (p<0.001) in all meteo-rological stations (R>=0.84).
3.2 Calculation of the Standardized Precipitation Index
From regional precipitation series the SPI was calculated to determine the evolution and intensity of climatic droughts at different time scales, between 1 and 24 months. The SPI was developed by McKee et al. (1993), and this index only uses precipitation data. Other variables also related to drought occurrence, such as the temperature, evapotranspiration, or atmospheric humidity, were not taken into account. Never-theless, numerous papers have indicated that precipitation is the most important variable in the drought indices that also include data of temperature or evapotranspiration (Oladipo, 1985; Keyantash and Dracup, 2002). Moreover, precipita-tion is the variable that mainly determines the duraprecipita-tion, mag-nitude, and intensity of droughts (Chang and Cleopa, 1991). The SPI shows a high correlation with the PDSI at time scales about 9 months, which indicates that for drought
identifi-cation and monitoring, temperature does not contribute sig-nificantly to drought index (Redmond, 2002). Guttman et al. (1992) have indicated that the effects of temperatures on the PDSI are little in comparison to the effects of precipita-tion. Hence, it is preferable to work with a drought index that only uses precipitation data because it is less complex to calculate (Keyantash and Dracup, 2002) and also because availability of precipitation data is higher than temperature data, both in time and space.
The main advantage of the SPI is that it can be calculated at different time scales. This is very important because the time scale over which precipitation deficits accumulate func-tionally separates different types of drought (McKee et al., 1993) and, therefore, allows to quantify the natural lags be-tween precipitation and other water usable sources such as the river discharges and the reservoir storages. More details about the properties, advantages and limitations of the SPI can be consulted in Hayes et al. (1999).
The SPI is, in fact, a fit of the precipitation data, calcu-lated on a certain time scale, to a given probability distri-bution. This is a problem for its calculation because the frequency distributions of precipitation series showed sig-nificant changes that depended on the time scale (Vicente-Serrano, 2005). However, irrespective of the time scales, Pearson III distribution adapts well to the statistics from the meteorological stations at the different time scales (Guttman, 1999; Ntale and Gan, 2003: Vicente-Serrano, 2005). When cumulative distribution is calculated, this is transformed us-ing equal probability to a normal distribution with a mean of zero and standard deviation of one. Positive SPI values indi-cate greater than median precipitation, while negative values indicate less than median precipitation.
In this paper Pearson III distribution was selected for SPI calculation at time scales from 1 to 24 months. The pa-rameters of the distribution can be obtained following Hosk-ing (1990), when L-moment ratios have been calculated (Greenwood et al., 1979; Sankarasubramanian and
Srini-vasan, 1999; Vicente-Serrano, 2005). The complete
for-mulation of the SPI calculation method can be consulted in Vicente-Serrano (2005).
3.3 River discharges and reservoir storages
Two gauging stations provide information on river discharges between 1953 and 2000. They are located in the Esca and Aragon rivers (see location in Fig. 1). Data was obtained from the Confederaci´on Hidrol´ogica del Ebro (C.H.E., Ebro River Administration Office). These gauging stations are lo-cated at the entrance of the Yesa reservoir. Both rivers ac-cumulate most of the inflow to the reservoir, except small ravines which drain into the reservoir during intense rain-fall events. Monthly flows in the two gauging stations were summed and standardised monthly to be compared to the dif-ferent time scales of SPI.
1950 1955 1960 1965 1970 1975 1980 1985 1990 1995 2000 SP I -3 -2 -1 0 1 2 3 1950 1955 1960 1965 1970 1975 1980 1985 1990 1995 2000 SP I -3 -2 -1 0 1 2 3 2 months-SPI 8 months-SPI 1950 1955 1960 1965 1970 1975 1980 1985 1990 1995 2000 SP I -3 -2 -1 0 1 2 3 1950 1955 1960 1965 1970 1975 1980 1985 1990 1995 2000 SP I -3 -2 -1 0 1 2 3 14 months-SPI 22 months-SPI
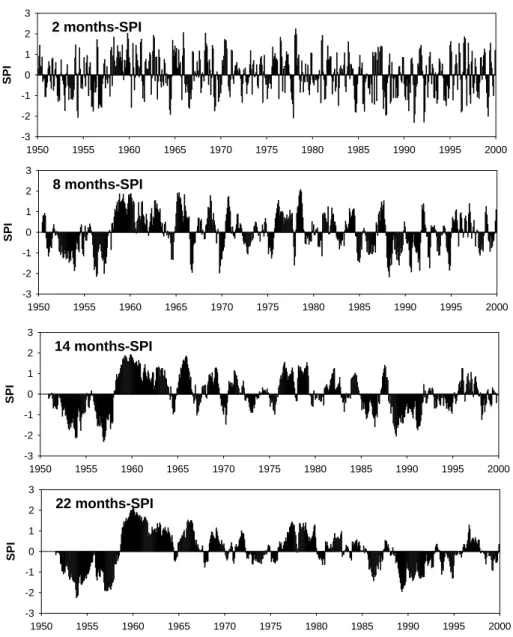
Figure 2. Evolution of the SPI at different time scales in the whole of the study area
Fig. 2. Evolution of the SPI at different time scales in the whole of the study area.
The water storages in the Yesa reservoir from 1959 were also used. This data was also obtained from the Ebro River Administration Office. The data on reservoir storages was also summed and standardised monthly. The quality of the river discharges data has been assessed in previous works (see Beguer´ıa et al., 2003; L´opez-Moreno and Garc´ıa-Ruiz, 2004). The Yesa reservoir data has been tested and no-trend in the amount of water diverted to the irrigation canal has been found (L´opez-Moreno et al., 2004).
Standardised data of river discharges and reservoir storage were compared with the SPI series at different time scales considering two approaches: continuously (considering all the months as a continuum) and monthly. For comparison the Pearson correlation coefficient was used.
4 Results
4.1 SPI temporal variability at different time scales
Figure 2 shows the continuous evolution of SPI at different time scales. At shorter time scales (e.g., 2 months) the dry (SPI<0) and moist (SPI>0) periods show a high temporal frequency, whereas when the time scale increases the fre-quency of dry periods decreases. At the time scale of 22 months only two important dry periods are recognised: the decade of 1950 and the decades of 1980 and 1990. The average duration of the dry periods (SPI<0) change notice-ably as a function of the time scales. At the time scale of 3 months the average duration is 2.5 months, at the time scale of 12 months is 3.5 months and the longest mean duration is recorded at the time scale of 24 months with an average
Time scale 0 2 4 6 8 10 12 14 16 18 20 22 24 C o rrelat ion ( R ) 0.0 0.2 0.4 0.6 0.8 Time scale 0 2 4 6 8 10 12 14 16 18 20 22 24 C o rrelat ion ( R ) 0.0 0.2 0.4 0.6 0.8 (a) (b)
Figure 3: Correlation between continuous standardized series of hydrological variables and
the SPI at different time scales. 1- Reservoir storages, 2- River discharges.
Fig. 3. Correlation between continuous standardized series of hydrological variables and the SPI at different time scales. (a) Reservoir
storages, (b) River discharges.
Time scales (SPI)
2 4 6 8 10 12 14 16 18 20 22 24 Month Oct Nov Dec Jan Feb Mar Apr May Jun Jul Aug Sep 0.3 0.3 0.3 0.3 0.3 0.3 0.3 0.3 0.3 0.3 0.4 0.4 0.4 0.4 0.4 0.4 0.5 0.5 0.5 0.5 0.5 0.4 0.4 0.4 0.4 0.4 0.3 0.3 0.3 0.3 0.4 0.4 0.4 0.3 0.3 0.5 0.5 0.5 0.4 0.4 0.3 0.3 0.6 0.6 0.6 0.5 0.5 0.5 0.7 0.7 0.3 0.4 0.5 0.4 0.6 0.5 0.4 0.7 0.8 0.4 0.3 0.7 0.8 0.3 0.4 0.5 0.6 0.7 0.8 Correl. Coef.
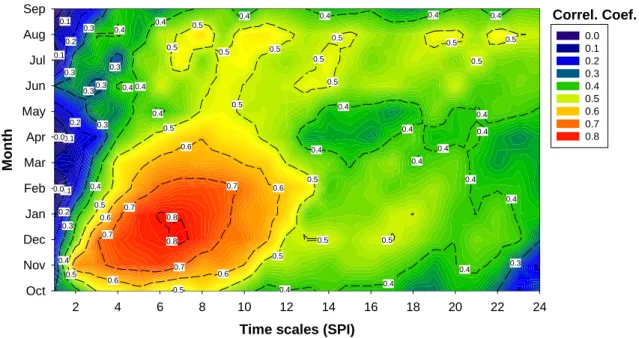
Figure 4. Correlation coefficients between the monthly river discharges series and the
monthly SPI series at different time scales. Significant correlations (p < 0.05) correspond to R
values higher than 0.29.
Fig. 4. Correlation coefficients between the monthly river discharges series and the monthly SPI series at different time scales. Significant
correlations (p<0.05) correspond to R values higher than 0.29.
duration of 9.5 months. To identify the main dry periods it is necessary to analyse the time scales larger than 6 months be-cause the high frequency of SPI values at the shorter time
scales hide the most important dry periods. Time scales
shorter than 6 months show non-significant autocorrelations considering lags shorter than 4 months, whereas considering the SPI at time scales larger than 6 months the autocorre-lations with lags of 4 of more months increase noticeably. Therefore, with time scales shorter than 6 months, it is dif-ficult to identify periods of consecutive 4 months with dry conditions.
4.2 Continuous relationships between time scales of SPI
and the hydrological variables
Figure 3 shows the Pearson correlation coefficients between the continuous standardized series of reservoir storages, river discharges and the SPI series at different time scales. For reservoir storages, correlations are positive, but there are im-portant differences with regard to time scales. At the shorter time scales, the relationship is poor. On a 1-month time scale, the correlation is only R=0.11. Nevertheless, the correlation increases when the time scale increases, with a maximum of R=0.59 on a time scale of 8 months. Considering river dis-charges, higher correlations have been obtained with the SPI on shorter time scales (1–3 months). The maximum correla-tion is found on the time scale of 2 months (R=0.63). Results
1950 1955 1960 1965 1970 1975 1980 1985 1990 1995 2000 SPI an d Sta n d a rd ise d disc ha rge s -2 -1 0 1 2 3 SPI Standardised discharges
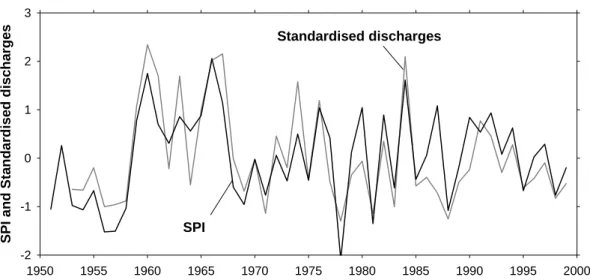
Figure 5. Interannual evolution of standardised river discharges and the SPI at the time scale
of 2 months in November.
Fig. 5. Interannual evolution of standardised river discharges and the SPI at the time scale of 2 months in November.
indicate that river discharges are more determined by precip-itation of the current month and previous month than consid-ering wider periods.
4.3 Monthly relationships between the different time scales
of SPI and hydrological variables
Figure 4 shows the monthly correlations between standard-ised series of river discharges and the SPI at different time scales. There are important seasonal differences in the re-sponse of the river discharges to different time scales of SPI. High correlations (R>0.7) are found during autumn and early winter (October–December) considering time scales shorter than 6 months. The highest correlations were ob-tained in October and November considering time scales of 1 and 2 months respectively (R=0.83 and R=0.80). Between February and April, correlations are lower than in winter months but the higher correlations are also obtained with the shorter time scales of SPI (1–3 months). Between May and July, the absolute values of correlation continue decreasing and rarely do the correlation coefficients (r) exceed 0.5. It is interesting to note that from March to July the SPI time scale with the highest correlation with discharge shows a progres-sive increase. Thus, maximum correlation in March is found at a 1-month time scale and in July the highest correlation is at a time scale of 7 months. In some cases such as June or July, discharge shows high correlations with both: short SPI time scales (1–2 months) and larger scales (5–7 months) with an intermediate time scale range (3–4 months) with lower correlations (less than r=0.5). In August and September the lower correlations between river discharges and the SPI are identified. In any case, only the shorter time scales (1–3 months) exceed correlations of r=0.5.
Figure 5 shows the evolution of SPI at the time scale of two months and the standardised values of river discharges in November, the month in which the highest correlation
be-tween both variables was recorded. The SPI at this time scale allows identification of the main drought periods recorded, such as 1978, 1981 and 1988, years in which the river dis-charges in the basin were very low.
Figure 6 shows correlations between the monthly SPI se-ries at the different time scales and the time sese-ries of reservoir storages. Higher correlations than those for river discharges were obtained, but very different patterns were found in re-lation to the months with the highest correre-lations and also to the longest time scales of SPI. The highest correlations between the SPI and reservoir storages were found between November and February. In this period, the highest corre-lated SPI time scales increased from 4 to 10 months. Dur-ing sprDur-ing, the correlations decreased slightly, especially in the shorter time scales. During the summer months, reser-voir storages are less sensitive to the SPI values than in win-ter and spring. However, significant correlations were found with time scales between 9 and 12 months.
Reservoir storages are not sensitive to longer time scales of the SPI in any month although, in general, correlations are higher considering time scales longer than 10 months than shorter than 4 months.
Figure 7 shows the evolution of the standardised water storages in the Yesa reservoir and the 7-months SPI in De-cember, the month in which the correlation between both pa-rameters is higher. Thus, the anomalies observed in the water stored in December can be well predicted by the cumulated precipitation recorded from July.
5 Discussion and conclusions
This paper has analysed the usefulness of a drought index (the Standardized Precipitation Index) to identify droughts in different usable water resources. The analysis was done in the central Spanish Pyrenees (Aragon River Basin). The
Time scales (SPI) 2 4 6 8 10 12 14 16 18 20 22 24 Mon th Oct Nov Dec Jan Feb Mar Apr May Jun Jul Aug Sep 0.4 0.3 0.5 0.4 0.4 0.4 0.4 0.5 0.4 0.4 0.4 0.5 0.4 0.4 0.4 0.4 0.4 0.4 0.5 0.5 0.5 0.5 0.5 0.5 0.5 0.4 0.5 0.5 0.5 0.5 0.5 0.6 0.6 0.6 0.6 0.6 0.4 0.7 0.7 0.7 0.7 0.5 0.5 0.4 0.8 0.5 0.8 0.4 0.4 0.4 0.4 0.3 0.4 0.3 0.3 0.3 0.3 0.3 0.2 0.2 0.2 0.5 0.4 0.3 0.1 0.1 0.1 0.0 0.1 0.0 0.0 0.1 0.2 0.3 0.4 0.5 0.6 0.7 0.8 Correl. Coef.
Figure 6. Correlation coefficients between the reservoir storages and the monthly SPI series at
different time scales. Significant correlations (p < 0.05) correspond to R values higher than
0.31.
Fig. 6. Correlation coefficients between the reservoir storages and the monthly SPI series at different time scales. Significant correlations
(p<0.05) correspond to R values higher than 0.31.
main topic of the paper has been focussed on the time scales of the drought index. This is a key-aspect for management purposes because the time of propagation of the precipita-tion anomalies to the hydrological cycle change noticeably as a function of the different water usable sources (Changnon and Easterling, 1989; Elfatih et al., 1999). Therefore, it is necessary to test the response of the different subsystems of the hydrological cycle to precipitation variability, before to use drought indices for management purposes.
We have shown that droughts have a different frequency according to the time scale used for analysis. At shorter time scales dry and moist periods change with a high frequency. At the longest time scales the droughts are less frequent but their duration is longer. In general, it is accepted that the time scales of the SPI are useful to monitor droughts in the different usable water resources.
Robust relationships were found analysing the role of the time scales of SPI on the river discharges and reservoir stor-ages. In the case of river discharges, correlations higher than 0.6 were found with continuous series of the SPI at time scales between 1 and 3 months. The response of the river discharges to longer time scales of the SPI is very low and the usefulness of longer time scales than 3 months to moni-tor river flow droughts in the mountain hydrological system studied here is very debatable. Nevertheless, we must indi-cate that this statement could be valid for mountainous areas in which runoff is very intense, precipitation is high and the generation of runoff is quick. In other basins with differ-ent characteristics (size, shape, slope, litology, climate, land cover, etc.) different time scales of SPI could be better to monitor droughts. In any case, more research is necessary to
establish proper relationships between the basins character-istics and their response to different time scales of SPI.
On the other hand, the time scales of SPI, which are use-ful to analyse droughts in the reservoir storages are longer than for river discharges in the study area. The continuous analysis showed that the higher correlations between stan-dardised data of reservoir storages and SPI were found at the time scales between 7 and 10 months. This result agrees with the time scales that Szalai et al. (2000) observed in Hungary. Therefore, the reservoirs could not be sensitive to the short dry periods and to be affected by droughts, these must have of a longer duration, identified with the SPI at longer time scales. However, it is necessary to consider that the charac-teristics of the reservoir (capacity or impounded ratio index), the type of the supplied demand (irrigation, hydropower gen-eration, both) and the management pattern applied can pro-duce a large variability in the response of the water stored to SPI at different scales. These results agree with the general theory on the response of the hydrological resources to pre-cipitation deficits of different duration and intensity being the reservoir storages on longer time scales (McKee et al., 1993; Komuscu, 1999). Nevertheless, in the study area we found a limit in the time scale of about 12 months. Time scales of SPI longer than 12 months do not seem useful to monitor any drought type. At longer time scales, the correlation de-creases with values around R=0.40 for time scales between 12 and 24 months.
However, a noticeable seasonality was found in the SPI’s usefulness to monitor droughts. There are monthly variations in both the strength of the correlations and the most suit-able SPI time scales, resulting from several features of the
1955 1960 1965 1970 1975 1980 1985 1990 1995 2000
SPI and Standa
rdis ed w a te r v o lume -2 -1 0 1 2 SPI
Standardised water volume
Figure 7. Interannual evolution of standardised reservoir storages and the SPI at the time scale
of 7 months in December.
Fig. 7. Interannual evolution of standardised reservoir storages and the SPI at the time scale of 7 months in December.
hydrological behaviour of the basin. Thus, the large hydro-logical importance of snow accumulation and melting pro-cesses in the area (L´opez-Moreno and Garc´ıa-Ruiz, 2004) determines the progressive increase in the optimum SPI time scale for explaining the river discharges and the low impor-tance of the SPI at short time scales, during late winter and spring. At the end of spring and during early summer, the high precipitations registered in the area, when the soil mois-ture in the basin is still high, produce a fast hydrological re-sponse to SPI (time scale of 1–2 months). Also, a new rise is observed in the correlation coefficients at large time scales as a consequence of snowmelt and the water stored in the soils during the previous months. In August and Septem-ber, the reserve of water in the basin is usually exhausted. Thus, the hydrological response is highly governed by the stormflow (short SPI time scale) and is subject to great un-certainty. The hydrological response of autumn seems to be mainly governed by both the moisture conditions found at the beginning of the season and the short scale precipitation conditions. This explains the high correlation coefficients from 1 to 7 month SPI time scales. Finally, during winter wet conditions dominate the catchment, which explains the better response of river flows to shorter SPI time scales.
Seasonal variability in the response of reservoir storages to SPI seems to be related to the fluvial regime received and the annual pattern of reservoir management. In summer the reservoir storages do not show correlations higher than 0.55 with the SPI. On the contrary, however, during the autumn and winter the correlations between the SPI and the hydro-logical variables are more robust and even higher than 0.8. In summer, the contribution of the rivers with regard to the wa-ter supplied for irrigation is very low. Thus, the wawa-ter volume during this season depends more on the stored level reached at the end of spring, determined by the hydroclimatic char-acteristics of the previous year (L´opez-Moreno et al., 2004)
than to the precipitation conditions during the current or the previous two or three months. In autumn, the water level depends on the stored volume at the end of the irrigation sea-son (September) and the magnitude of the inflow discharges. The former responds to the hydroclimatic conditions at large scale (L´opez-Moreno et al., 2004), and the latter is highly determined by the SPI at short scales. However, water stored in winter basically depends on the hydroclimatic conditions since the beginning of the filling period. Thus, the SPI at short time scale progressively loses importance and increases the correlation coefficients with the SPI at larger time scales. The analysed basin is an example of complex hydrolog-ical systems of mountainous regions, and in the Mediter-ranean region these are the most important sources of water resources. The results reveal the need of testing the useful-ness of the drought indicators to monitor different drought types prior to developing monitoring plans. In general, the results agree with theoretical statements about the usefulness of different time scales of drought indices to monitor differ-ent drought types. Nevertheless, the seasonal differences are very important and must be taken into account when drought information is provided. This conclusion claims for caution when theoretical statements are used to relate the length of a drought period and the hydrological subsystems affected in ungauged basins. In order to address this task, further re-search is needed in other different basins about the relation-ships between the time of response of the hydrological vari-ables in relation to the climatic characteristics and the water resources management.
Acknowledgements. The authors want to acknowledge
finan-cial support from the following projects: BSO2002-02743, REN2003-07453, CGL2005-04508/BOS, PIRIHEROS (REN2003-08678/HID) and CANOA (CGL 2004-04919-c02-01), funded by Ministerio de Ciencia y Tecnolog´ıa (Spain) and UE-FEDER, and “Programa de grupos de investigaci´on consolidados” (BOA
48 of 20-04-2005), funded by Aragon Government. Research of the first author was supported by postdoctoral fellowship by the Ministerio de Educaci´on y Ciencia (Spain). We would like to thank J. Mart´ın-Vide and B. van den Hurk and the anonymous reviewer for their helpful comments.
Edited by: B. van den Hurk
References
Abramowitz, M. and Stegun, I. A.: Handbook of Mathematical Functions, Dover Publications, New York, 1965.
Alexandersson, H.: A homogeneity test applied to precipitation data, J. Climat., 6, 661–675, 1986.
Alley, W. M.: The Palmer drought severity index: limitations and applications, J. Appl. Meteor., 23, 1100–1109, 1984.
Austin, R. B., Cantero-Mart´ınez, C., Arr´ue, J. L., Play´an, E., and Cano-Marcell´an, P.: Yield-rainfall relationships in cereal crop-ping systems in the Ebro river valley of Spain, European Journal of Agronomy, 8, 239–248, 1998.
Beersma, J. J. and Buishand, T. A.: Joint probability of precipitation and discharge deficits in the Netherlands, Water Resour. Res., 40, W12508, doi:10.1029/2004WR003265, 2004.
Beguer´ıa, S., L´opez-Moreno, J. I., Lorente, A., Seeger, M., Garc´ıa-Ruiz, J. M.: Assesing the Effect of Climate Oscillations and Land-use on Streamflow in the Central Spanish Pyrenees, Am-bio, 32(4), 283–286, 2003.
Beran, M. A. and Rodier, J. A.: Hydrological aspects of drought. Studies and reports in hidrology, 39. UNESCO – WMO, Gine-bra, 1985.
Bonaccorso, B., Bordi, I., Cancielliere, A., Rossi, G., and Sutera, A.: Spatial variability of drought: an analysis of the SPI in Sicily, Water Resour. Management, 17, 273–296, 2003.
Bruce, J. P.: Natural disaster reduction and global change, Bull. Amer. Meteor. Soc., 75, 1831–1835, 1994.
Burton, I., Kates, R. W. and White, G. F.: The environment as haz-ard, Oxford University Press, New York, 240 pp, 1978. Chang, T. J. and Kleopa, X. A.: A proposed method for drought
monitoring, Water Resour. Bull., 27, 275–281, 1991.
Changnon, S. A. and Easterling, W. E.: Measuring drought impacts: the Illinois case, Water Resour. Bull., 25, 27–42, 1989.
Cordery, I. and McCall, M.: A model for forecasting drought from teleconections, Water Resour. Res., 36, 763–768, 2000. DeGaetano, A. T.: A Temporal Comparison of Drought Impacts and
Responses in the New York City Metropolitan Area, Climatic Change, 42, 539–560, 1999.
Domonkos, P.: Recent precipitation trends in Hungary in the con-text of larger scale climatic changes, Natural Hazards, 29, 255– 271, 2003.
Dracup, J. A., Lee, K., and Paulson, E. G.: On the definition of droughts, Water Resour. Res., 16, 297–302, 1980.
Edwards, D. C. and McKee, T. B.: Characteristics of 20th century drought in the United States at multiple time scales, Atmospheric Science Paper No. 634, 1997.
Elfatih, A., Eltahir, B., and Yeh, P. J. F.: On the asymmetric re-sponse of aquifer water level to floods and droughts in Illinois, Water Resour. Res., 35, 1199–1217, 1999.
Evans, J. and Geerken, R.: Discrimination between climate and human-induced dryland degradation, J. Arid Environ., 57, 535–
554, 2004.
Flannigan, M. D. and Harrington, J. B.: A study of the relation of meteorological variables to monthly provincial area burned by wilfire in Canada (1953–1980), J. Appl. Meteor., 27, 441–452, 1988.
Garc´ıa-Ruiz, J. M., Puigdef´abregas, J., and Creus, J.: Los recur-sos h´ıdricos superficiales del Alto Aragon, Colecci´on de Estudios Altoaragoneses, Huesca, 224 pp, 1985.
Greenwood, J. A., Landwehr, J. M., Matalas, N. C., and Wallis, J. R.: Probability Weighted Moments: definition and relation to parameters of several distributions expressible in inverse form, Water Resour. Res., 15, 1049–1054, 1979.
Guttman, N. B., Wallis, J. R., and Hosking, J. R. M.: Spatial com-parability of the Palmer Drought Severity Index, Water Resour. Bull., 28, 1111–1119, 1992.
Guttman, N. B.: Comparing the Palmer drought index and the Stan-dardized Precipitation Index, J. Amer. Water Resour. Associa-tion, 34, 113–121, 1998.
Guttman, N. B.: Accepting the standardized precipitation index: a calculation algorithm, J. Amer. Water Resour. Association, 35, 311–322, 1999.
Havens, A. V.: Drought and agriculture, Weatherwise, 7, 51–55, 1954.
Hayes, M., Wilhite, D. A., Svoboda, M., and Vanyarkho, O.: Moni-toring the 1996 drought using the Standardized Precipitation In-dex, Bull. Amer. Meteor. Soc., 80, 429–438, 1999.
Heim, R. R.: A review of twentieth-century drought indices used in the United States, Bull. Amer. Meteor. Soc., 83, 1149–1165, 2002.
Hosking, J. R. M.: L-Moments: Analysis and estimation of dis-tributions using linear combinations of order statistics, J. Royal Statistical Soc. B, 52, 105–124, 1990.
Jones, P. D. and Hulme, M.: Calculating regional climatic time se-ries for temperature and precipitation: methods and illustrations, International J. Climat., 16, 361–377, 1996.
Karl, T. R.: Some spatial characteristics of drought duration in the United States, J. Clim. Appl. Meteor., 22, 1356–1366, 1983. Keyantash, J. and Dracup., J.: The quantification of drought: an
evaluation of drought indices, Bull. Amer. Meteor. Soc., 83, 1167–118, 20020.
Komuscu, A. U.: Using the SPI to analyze spatial and temporal patterns of drought in Turkey, Drought Network News, 11, 7–13, 1999.
Lana, X. and Burgue˜no, A.: Spatial and temporal characterization of annual extreme droughts in catalonia (Northeast Spain), Inter-national J. Climat., 18, 93–110, 1998.
Lana, X., Serra, C., and Burgue˜no, A.: Patterns of monthly rain-fall shortage and excess in terms of the Standardied Precipita-tion Index for Catalonia (NE Spain), InternaPrecipita-tional J. Climat., 21, 1669–1691, 2001.
Leilah, A. A. and Al-Khateeb, S. A.: Statistical analysis of wheat next term yield under previous term drought next term condi-tions, J. Arid Environ., 61, 483–496, 2005.
Lloyd-Hughes, B. and Saunders, M. A.: Seasonal prediction of European spring precipitation from El Ni˜no-southern oscillation and local sea-surface temperatures, International J. Climat., 22, 1–14, 2002.
L´opez Moreno, J. I. and Garc`ıa Ruiz, J. M.: Influence of snow ac-cumulation and snowmelt on streamflow in the Central Spanish
Pyrenees, International J. Hydrol. Sci., 49, 787–802, 2004. L´opez Moreno, J. I., Beguer`ıa, S., and Garc`ıa-Ruiz, J. M.: The
management of a large mediterranean reservoir: storage regimes of the Yesa reservoir, Upper Aragon River basin, Central Spanish Pyrenees, Environmental Management, 34(4), 508–515, 2004. McKee, T. B. N., Doesken, J., and Kleist, J.: The relationship of
drought frecuency and duration to time scales, Eight Conf. On Applied Climatology, Anaheim, CA, Amer. Meteor. Soc. 179– 184, 1993.
Min, S. K., Kwon, W. T., Park, E. H. and Choi, Y.: Spatial and temporal comparisons of droughts over Korea with East Asia, International J. Climat., 23, 223–233, 2003.
Montserrat-Mart´ı, J. M.: Evoluci´on Glaciar y postglaciar del Clima y la vegetaci´on en la vertiente sur del Pirineo: Estudio Palinol´ogico, Monograf´ıas del Instituto Pirenaico de Ecolog´ıa, C.S.I.C. no. 6, 147 pp., Zaragoza, 1992.
Morales, A., Olcina, J., and Rico, A. M.: Diferentes persepciones de la sequ´ıa en Espa˜na: adaptaci´on, catastrofismo e intentos de correcci´on, Investigaciones Geogr´aficas, 23, 5–46, 2000. Nicholson, S. E., Tucker, C. J., and Ba, M. B.:
Desertifica-tion, drought and surface vegetation: an example from the west African Sahel, Bull. Amer. Meteor. Soc., 79, 815–829, 1998. Ntale, H. K. and Gan, T.: Drought indices and their application to
East Africa, International J. Climat., 23, 1335–1357, 2003. Obasi, G. O. P.: WMO‘s role in the international decade for
natu-ral disaster reduction, Bull. Amer. Meteor. Soc., 75, 1655–1661, 1994.
Oladipo, E. O.: A comparative performance analysis of three mete-orological drought indices, J. Climat., 5, 655–664, 1985. Palmer, W. C.: Meteorological droughts, U.S. Department of
Com-merce Weather Bureau Research, Paper 45, 58 pp., 1965. Pandey, R. P. and Ramasastri, K. S.: Relationship between the
com-mon climatic parameters and average drought frequency, Hydrol. Processes, 15, 1019–1032, 2001.
Pausas, J. G.: Changes in fire and climate in the eastern Iberian Peninsula (Mediterranean basin), Climatic Change, 63, 337–350, 2004.
Peters, E., van Lanen, H. A. J., Torfs, P. J. J. F., and Bier, G.: Drought in groundwater-drought distribution and performance indicators, J. Hydrol., 306, 302–317, 2005.
Peterson, T. C. and Easterling, D. R.: Creation of homogeneous composite climatological reference series, International J. Cli-mat., 14, 671–679, 1994.
Peterson, T. C., Easterling, D. R., Karl, T. R., et al.: Homogeneity adjustments of in situ atmospheric climate data: a review, Inter-national J. Climat., 18, 1493–1517, 1998.
Pickup, G.: Desertification and climate change – The Australian perspective, Climate Research, 11, 51–63, 1998.
Redmond, K. T.: The depiction of drought, Bull. Amer. Meteor. Soc., 83, 1143–1147, 2002.
Sankarasubramanian, A. and Srinivasan, K.: Investigation and com-parison of sampling properties of L-moments and conventional moments, J. Hydrol., 218, 13–34, 1999.
Soler-Sampere, M. and Puigdef´abregas, C.: Esquema litol´ogico del Alto Aragon Occidental, Pirineos, 106, 5–15, 1972.
Skøien, J. O., Bl¨osch, G., and Western, A. W.: Characteristic space scales and timescales in hydrology, Water Resour. Res., 39, 1304, doi:10.1029/2002WR001736, 2003.
ˇSt`ıp´anek, P.: AnClim – software for time series analysis (for Win-dows), Dept. of Geography, Fac. of Natural Sciences, MU, Brno. 1.47 MB, 2004.
Svoboda, M., LeCompte, D., Hayes, M., Heim, R., Gleason, K., Angel, J., Rippey, B., Tinker, R., Palecki, M., Stooksbury, D., Miskus, D., and Stephens, S.: The drought monitor, Bull. Amer. Meteor. Soc., 83, 1181–1190, 2002.
Szalai, S., Szinell, C. S., and Zoboki, J.: Drought monitoring in Hungary, in: Early warning systems for drought preparedness and drought management, World Meteorological Organization, Lisboa, 182–199, 2000.
Tsakiris, G. and Vangelis, H.: Towards a drought watch system based on spatial SPI, Water Resour. Management, 18, 1–12, 2004.
Vicente Serrano, S. M. and Beguer´ıa, S.: Estimating extreme dry-spell risk in the middle Ebro valley (Northeastern Spain): A com-parative analysis of partial duration series with a General Pareto distribution and Annual maxima series with a Gumbel distribu-tion, International J. Climat., 23, 1103–1118, 2003.
Vicente-Serrano, S. M., Gonz´alez-Hidalgo, J. C., de Luis, M., and Ravent´os, J.: Drought patterns in the Mediterranean area: the Va-lencia region (eastern Spain), Climate Research, 26, 5–15, 2004. Vicente-Serrano, S. M.: Differences in spatial patterns of drought on different time scales: an analysis of the Iberian Peninsula, Water Resour. Management, in press, 2005.
White S, Garc´ıa-Ruiz, J. M., Mart´ı, C., Valero, B., Errea, M. P., and G´omez-Villar, A.: The 1996 Biescas campsite disaster in the Central Spanish Pyrenees, and its temporal and spatial context, Hydrol. Processes, 11, 1797–1812, 1997.
Wilhite, D. A. and Glantz, M. H.: Understanding the drought phe-nomenon: the role of definitions, Water International, 10, 111– 120, 1985.
Wilhite, D. A.: Drought as a natural hazard: concepts and defini-tions, in: Drought: a global assessment, edited by: Wilhite, D., 1, 3–18, 2000.
WMO, World Meteorological Organization: Early Warning Sys-tems for Drought Preparedness and Drought Management, Lis-boa, 2000.
Wu, H., Hayes, M. J., Wilhite, D. A., and Svoboda, M. D.: The effect of the length of record on the standardized precipitation index calculation, International J. Climat., 25, 505–520, 2005.