Emulsions via Exciton Migration of Conjugated Polymers
The MIT Faculty has made this article openly available. Please share
how this access benefits you. Your story matters.
Citation Koo, Byungjin, and Timothy M. Swager. “Distinct Interfacial Fluorescence in Oil-in-Water Emulsions via Exciton Migration of Conjugated Polymers.” Macromolecular Rapid Communications 38, no. 18 (August 3, 2017): 1700262.
As Published http://dx.doi.org/10.1002/marc.201700262
Publisher Wiley Blackwell
Version Author's final manuscript
Citable link http://hdl.handle.net/1721.1/114849
Terms of Use Creative Commons Attribution-Noncommercial-Share Alike
DOI: 10.1002/marc.((insert number))
Communication
Distinct Interfacial Fluorescence in Oil-in-Water Emulsions via Exciton
Migration of Conjugated Polymers
aByungjin Koo, Timothy M. Swager* –––––––––
B. Koo, Prof. T. M. Swager
Department of Chemistry, Massachusetts Institute of Technology, Cambridge, Massachusetts 02139, United States
E-mail: tswager@mit.edu B. Koo
Department of Materials Science and Engineering, Massachusetts Institute of Technology, Cambridge, Massachusetts 02139, United States
–––––––––
Commercial dyes are extensively utilized to stain specific phases for the visualization applications in emulsions and bioimaging. In general, dyes emit only one specific fluorescence signal and thus, in order to stain various phases and/or interfaces, one needs to incorporate multiple dyes and carefully consider their compatibility to avoid undesirable interactions with each other and with the components in the system. Herein we report surfactant-type, perylene-endcapped fluorescent conjugated polymers that exhibit two different emissions, which are cyan in water and red at oil–water interfaces. The interfacially distinct red emission results from enhanced exciton migration from the higher bandgap polymer backbone to the lower bandgap perylene endgroup. The confocal microscopy images exhibit the localized red emission exclusively from the circumference of oil droplets. This exciton migration and dual-fluorescence of the polymers in different physical environments can provide a new concept of visualization methods in many amphiphilic colloidal systems and bioimaging.
1. Introduction
Fluorescent dyes have been utilized to stain one or more phases in complex colloidal systems[1] or organelles in cell and tissue imaging.[2,3] Various natural and synthetic
fluorescent markers have been reported, and the emissions range from ultraviolet to near infrared with strong brightness resulting from high extinction coefficients and quantum yields.[2,4] Which specific phases are stained is determined by the chemical structures of dyes.
For example, hydrophilic dyes partition to aqueous phases, lipophilic dyes assemble in lipophilic phases, and amphiphilic dyes can bind at hydrophobic–hydrophilic interfaces. In order to label multiple phases and interfaces, one should consider both chemical structures of the dyes and their compatibility, so that the dyes should not interact with each other and with other components in the colloidal system. Among the aforementioned types of dyes are the amphiphilic fluorescent probes that are structurally more challenging to synthesize owing to meeting the optimum balance between hydrophobicity and hydrophilicity.[5] Furthermore, the
equilibrium of solubility results in the partial amount of dyes residing in water and/or oil phases in addition to interfaces, which could reduce the contrast of fluorescence images between interfaces and backgrounds.
Poly(phenylene ethynylene)s (PPEs), fluorescent conjugated polymers, have been extensively investigated as optoelectronic and fluorescent sensory materials.[6-8] They possess
both large extinction coefficients and high fluorescence quantum yields, resulting from an electronic structure with a direct band gap[9] as well as rigid butatriene-like excited state
structures.[10] The strong brightness makes them suitable materials as fluorescent dyes. One
distinct feature of the PPE as a fluorescent probe, compared to other conventional small molecular probes, is that their fluorescence can be switched via exciton migration that can be modulated by their conformations[11] and interpolymer distances.[12,13] We reported[13] that
surfactant-type PPEs having low-energy emissive endgroups can display dual-fluorescence, which is cyan (backbone) in solution and red (endgroup) in thin films at a single excitation
wavelength through energy transfer. In their Langmuir monolayers at the air– water interface, interpolymer distances are controlled, resulting in the ratiometric fluorescence changes. Herein we aim to apply this dual-fluorescence concept to more general amphiphilic colloidal systems. As a proof of concept, we choose oil-in-water emulsions that are stabilized by PPE surfactants. We found that PPEs show cyan fluorescence in water, which switches to red fluorescence in oil-in-water emulsions (Figure 1a) because of the closer interpolymer distance on the confined spherical oil surface, and therefore, the red emission is observed exclusively from the oil–water interface.
We envision that this switchable
fluorescence between bulk and interface can pave a novel way of high-contrast
visualization techniques for many
amphiphilic systems found in colloids and bioimaging.
2. Results and Discussion
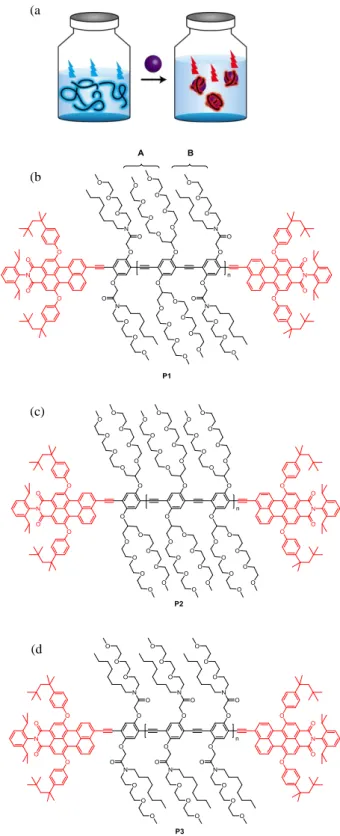
Figure 1. (a) Schematics of exciton migration upon the
formation of emulsions. In water (left), P1 shows cyan fluorescence. At the oil–water interfaces (right), P1 shows red fluorescence owing to enhanced exciton migration to perylene endgroups resulting from closer interpolymer distance. (b) Structure of endcapped surfactant-type PPE (P1). P1 shows the optimum water solubility and efficient localization at the droplet surface with enhanced energy transfer. (c) Structure of P2. P2 is too water-soluble, and the localization at the droplet surface is not efficient. (d) Structure of P3. P3 is not water-soluble, and thus droplet fabrication is not successful.
(a ) (b ) (c) (d )
We synthesized several perylene end-capped water-soluble PPEs to make oil droplets in water. The perylene is functionalized with bulky phenoxy groups at its bay area, designed to reduce π-π stacking and aggregation-induced fluorescence quenching.[14] Regarding sidechains of the
polymer backbone, we chose a branched double triethylene glycol monomethyl ether (“A” in Figure 1b) as one of the sidechains because of structural simplicity and the highest fluorescent quantum yield in water (QY = 43%) among the reported water-soluble PPEs.[15,16] The other
type of sidechain is a branched triethylene glycol monomethyl ether and octyl group (“B” in Figure 1b), which was chosen from the previous report.[17] Based on the combination of two
types of sidechains, we synthesized three PPEs: P1 with alternate A–B, P2 with A–A, and P3 with B–B as shown in Figure 1. The number ratio of triethylene glycol (TEG) to octyl per repeat unit is 6:2 (P1), 8:0 (P2), and 4:4 (P3). P3 turns out to be not water-soluble and thus in-water emulsion fabrication was not possible. P1 and P2 are water-soluble, and the oil-in-water emulsions were fabricated. However, we will mainly focus on P1 since P2 shows only slightly enhanced red fluorescence in the emulsion (Figure S1 in Supporting Information), which is not as significant as P1 (vide infra). This is perhaps attributed to the fact that P2 is too water-soluble and these polymers stay in the water phase rather than partitioning to the interface. P1 is moderately water-soluble and we observe the stable oil-in-water emulsions with the strongly increased red fluorescence at the oil–oil-in-water interface (vide infra).
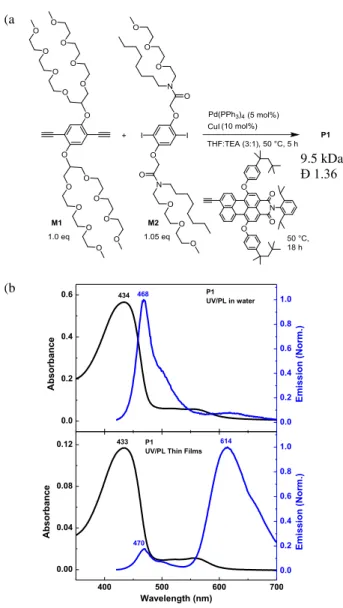
We synthesize P1 via Sonogashira cross-couplings with M1 (diyne) and M2 (diiodide) in the presence of Pd(PPh3)4, CuI, triethylamine (TEA), and tetrahydrofuran (THF) as a
solvent (Figure 2a and detailed synthetic procedures in Supporting Information). The perylene with a terminal acetylene was added in situ to perform the endcapping reaction of the polymer, providing a unimodal distribution of the polymers (Figure S2) with the molecular weight of 9.5 kDa and the polydispersity of 1.36. We also synthesize P2 and P3 in a similar way (see
Supporting Information). Figure 2b shows the absorption and emission spectra (excitation at 400 nm) of P1 in water and thin films. The absorption spectra between solution and thin films are very similar with conformational disorder that produces a manifold of electronic states. This indicates that organized π-π stacking in the solid state is absent, presumably as a result of the sterically bulky branched side chains as well as bulky perylene endgroups. The absence of strong π-π interactions is desirable for our application, because they generally produce
aggregation-induced fluorescence
quenching. In contrast to the similar absorption spectra, the emission spectra display large differences between solution and thin film states (Figure 2b). In the solid state, excitons in the backbone migrate to the perylene via statistically improved 3D random walk, which is much more efficient than 1D intrachain exciton migration within isolated chains in solution.[18] Note that the PPE
backbone is exclusively excited since the
perylene endgroup has negligible
absorption at 400 nm (Figure S3) as well as the number of perylene endgroup is very small relative to PPE backbone, considering the weak absorption shoulder (560 nm) and the emission shoulder (615 nm) in solution spectra (Figure 2b, top),
Figure 2. (a) Polymerization of P1 via a Sonogashira-type coupling reaction. The perylene endgroup with a terminal acetylene is added in situ to the polymerization reaction mixture to install the perylene at the polymer chain ends. (b) Absorption and emission spectra of P1 in water (top) and thin films (bottom) with excitation at 400 nm. The absorption spectra are similar each other, whereas the emission spectra exhibit either backbone (solution) or endgroup fluorescence (thin films) as a result of the exciton migration in the solid state.
(a ) (b ) 9.5 kDa Đ 1.36 400 500 600 700 0.00 0.04 0.08 0.12 614 Wavelength (nm) Ab so rb an ce 433 0.0 0.2 0.4 0.6 0.8 1.0 P1 UV/PL Thin Films
E mis sion ( No rm.) 470 0.0 0.2 0.4 0.6 Ab so rb an ce 0.0 0.2 0.4 0.6 0.8 1.0 468 P1 UV/PL in water E mis sion ( No rm.) 434
along with the insignificant perylene peaks in the NMR spectrum (Figure S10).
P1 can serve as a surfactant to
stabilize oil-in-water emulsions. In this application P1 is dissolved in water with the concentration of 25 μg/ml. The solution is slightly cloudy with aggregates (273 nm in size, see Figure S4) and after 10 hours small amounts of the precipitates settle at the bottom of the vial. Since P1 has a surfactant structure, the aggregates may be micelles which are a reservoir of surfactants, thereby providing sufficient surfactant molecules to stabilize oil droplets. Using a freshly
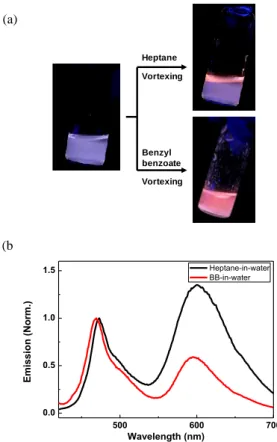
prepared aqueous P1 solution, we made heptane-in-water and benzyl benzoate-in-water emulsions with 5 vol% of oil phases in both cases (Figure 3a). The two different oil phases are used to probe the effect of P1’s solubility in oil on its emission and phase stability (heptane as a poor solvent and benzyl benzoate (BB) as a good solvent). Upon the addition of heptane, we observe bright red emission at the top or the aqueous colloidal solution, indicating that a lower density heptane emulsion (d = 0.68 g/mL) has formed incorporating the polymer (Figure 3a). For benzyl benzoate (d = 1.12 g/mL) the entire solution is uniform with a red emission although larger droplets tend to settle at the bottom of the solution. The uniformity of red emission throughout the solution is understood because the smaller BB droplets display a Brownian motion that keeps them dispersed rather than sinking to the bottom based on density considerations. BB possesses a surface tension of 46 mN/m at room
Heptane Benzyl benzoate Vortexing Vortexing 500 600 700 0.0 0.5 1.0 1.5 E mis sion ( No rm.) Wavelength (nm) Heptane-in-water BB-in-water (b ) (a)
Figure 3. (a) Photographs of emulsions. P1 in water (left), is
combined and vortexed with heptane (top right) and benzyl benzoate (bottom right). Color change is manifested within several seconds. (b) Emission spectra (excitation at 400 nm) of heptane-in-water (black) and BB-in-water (red) emulsions. Increased red emissions are observed in both cases after adding oil phases.
temperature that is closer to water (73 mN/m), whereas heptane (20 mN/m) is far from water, resulting in the formation of more stable, smaller BB droplets in water. The fluorescence spectra are presented in Figure 3b. In both cases, the relative intensity of red to cyan is increased compared to the P1 solution spectrum and is still lower than the P1 thin film spectrum. Heptane-in-water emulsion shows a greater red component (more thin film-like) than BB-in-water emulsion (more solution-like, vide infra). The excitation spectra with the emission measured at 600 nm (Figure S5) indicate that the enhanced red emission is indeed originated from PPE backbone absorption, not from perylene, indicating the exciton migration from polymer to perylene.
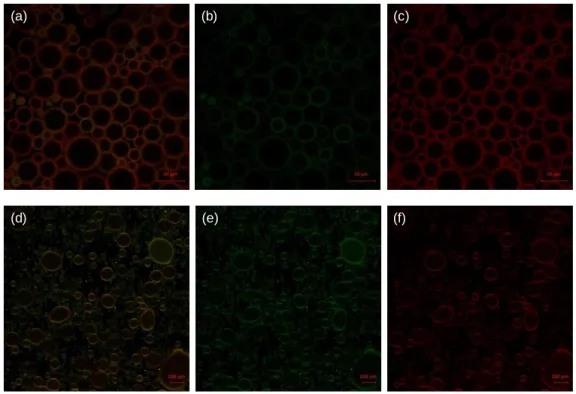
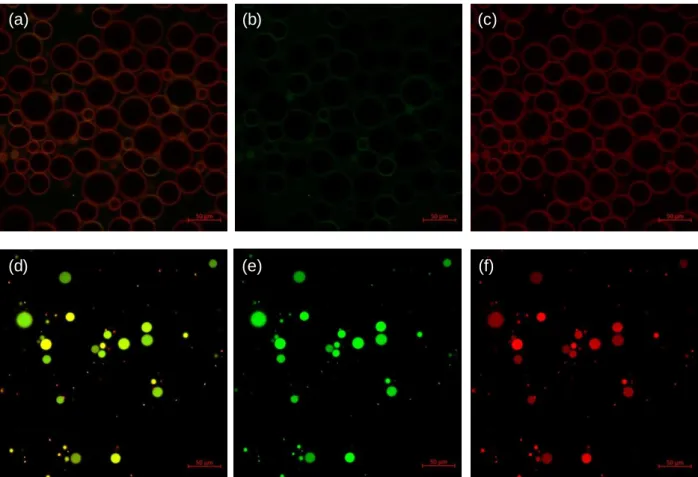
We collected confocal laser scanning microscopy (CLSM) images (Figure 4) to visualize the droplets and locate the origin of fluorescence. Figure 4a-c (and Figure 4d-f) show the heptane-in-water (and BB-in-water) emulsions, respectively, where Figure 4a and 4d are from the mixed channels, collecting green (Figure 4b and 4e) and red (Figure 4c and 4f) emissions.
Figure 4. Confocal laser scanning microscopy images. (a-c) Heptane-in-water emulsions. Scale bar: 50
μm. Emission channels from (a) mixed (b) green and (c) red. (d-f) Benzyl benzoate-in-water emulsions. Scale bar: 100μm. Emission channels from (d) mixed (e) green and (f) red. Excitation laser at 458 nm. Green emission (471–511 nm) and red emission (579–621 nm).
(a) (b) (c)
In all cases, the polymers are successfully localized at the droplet’s interface. In heptane-in-water emulsion, the red emission intensity (Figure 4c) is much stronger than the green (Figure 4b), whereas in the BB-in-water emulsion the red and green (Figure 4e and 4f) are similar, which is consistent with the spectroscopic results in Figure 3b. We hypothesize that this result is related to the local environment of interfaces. Heptane is both a poor solvent for the polymers and has a higher energy interface with water. As a result, the polymers pack densely at the interfaces, potentially in a 2D aggregates, and the shorter interpolymer distances facilitate exciton migration to the terminal perylenes and exhibit thin film-like emission. Because BB is a good solvent for P1, the interfacial polymer chains are solvated, which reduces the energy transfer rates both between polymers and to the endgroups. In the heptane-in-water emulsion, increasing concentration of the polymer solution to 100 μg/ml results in dense interfacial localization and much stronger red emission (Figure S6a-c), whereas in the BB-in-water emulsion, the polymers are dissolved throughout the BB phase (Figure S6d-f).
3. Conclusions
We synthesize surfactant-type fluorescent conjugated polymers that generate cyan and red emissions, depending upon their environment. P1 has moderate solubility in water and preferentially localizes at the oil–water interfaces. This location-dependent fluorescence, which differs from what is possible with conventional small molecular dyes, results from the judicious design of surfactant-type PPEs, which experience enhanced exciton migration at the oil–water interfaces. The increased red fluorescence was confirmed by fluorescence spectroscopy and visualized by the confocal laser scanning microscopy. These tunable emissions provide a rational design to meet specific imaging and sensing needs. We are currently expanding this methodology to complex emulsions.
Supporting Information
Synthetic procedures and NMR spectra are included. Additional data including absorption and emission of emulsions and perylene, gel permeation chromatogram, dynamic light scattering, excitation spectra of emulsions, and confocal images are displayed. Supporting Information is available from the Wiley Online Library.
Acknowledgements: B.K. thanks Wendy Salmon at Whitehead Institute for CLSM images and Qifan Zhang for helpful discussions. B.K. appreciates Samsung Scholarship for graduate research support. This work was also supported by the National Science Foundation DMR-1410718.
Received: Month XX, XXXX; Revised: Month XX, XXXX; Published online: DOI: 10.1002/marc.((insert number))
Keywords: conjugated polymers, surfactants, exciton migration, emulsions, fluorescence
(1) L. L. Schramm, Emulsions; American Chemical Society, 1992; Vol. 231. (2) L. D. Lavis, R. T. Raines, ACS Chem. Biol. 2008, 3, 142.
(3) L. D. Lavis, R. T. Raines, ACS Chem. Biol. 2014, 9, 855. (4) Y. Suzuki, K. Yokoyama, Biosensors 2015, 5, 337.
(5) H.-W. Yao, X.-Y. Zhu, X.-F. Guo, H. Wang, Anal. Chem. 2016, 88, 9014. (6) U. H. F. Bunz, Chem. Rev. 2000, 100, 1605.
(7) S. W. Thomas, G. D. Joly, T. M. Swager, Chem. Rev. 2007, 107, 1339. (8) S. Rochat, T. M. Swager, ACS Appl. Mater. Interfaces 2013, 5, 4488. (9) D. T. McQuade, A. E. Pullen, T. M. Swager, Chem. Rev. 2000, 100, 2537.
(10) U. H. F. Bunz, Macromol. Rapid Commun. 2009, 30, 772
(11) E. E. Nesterov, Z. Zhu, T. M. Swager, J. Am. Chem. Soc. 2005, 127, 10083. (12) A. Satrijo, T. M. Swager, J. Am. Chem. Soc. 2007, 129, 16020.
(13) B. Koo, T. M. Swager, ACS Macro Lett. 2017, 6, 134.
(14) M. Yan, L. J. Rothberg, E. W. Kwock, T. M. Miller, Phys. Rev. Lett. 1995, 75, 1992. (15) A. Khan, S. Muller, S. Hecht, Chem. Commun. 2005, 584.
(16) U. H. F. Bunz, K. Seehafer, M. Bender, M. Porz, Chem. Soc. Rev. 2015, 44, 4322. (17) B. Koo, T. M. Swager, ACS Macro Lett. 2016, 5, 889.
(18) T. L. Andrew, T. M. Swager, J. Polym. Sci. B Polym. Phys. 2011, 49, 476.
B. Koo, T. M. Swager*
Distinct Interfacial Fluorescence in Oil-in-Water Emulsions via Exciton Migration of Conjugated Polymers
ToC figure ((Please choose one size: 55 mm wide × 50 mm high or 110 mm wide × 20 mm high. Please do not use any other dimensions.))
((Supporting Information should be included here for submission only; for publication, please provide Supporting Information as a separate PDF file.))
Supporting Information for
Distinct Interfacial Fluorescence in Oil-in-Water Emulsions via
Exciton Migration of Conjugated Polymers
Byungjin Koo1,2 and Timothy M. Swager*,1
1Department of Chemistry and 2Department of Materials Science and Engineering,
Massachusetts Institute of Technology, Cambridge, Massachusetts 02139, United States *Correspondence to: T. M. Swager (E-mail: tswager@mit.edu)
Contents
Experimental Section ... SError! Bookmark not defined. Additional Data... SError! Bookmark not defined. NMR Spectra ... SError! Bookmark not defined. References ... SError! Bookmark not defined.
Experimental Section
General. Chemicals were purchased from Aldrich, Alfa Aesar, and TCI America
without further purification unless noted otherwise. All reactions were carried out under argon with standard Schlenk techniques. M2,1 M3,2 and P33 were synthesized by following the literature procedures or slight modifications thereof. All 1H NMR and 13C NMR spectra are
reported in ppm on a Bruker Avance-400. 1H NMR is referenced to a chloroform peak (δ = 7.26 ppm). The multiplicity is reported as follows: s = singlet, d = doublet, t = triplet, q = quartet, quint = quintet, m = multiplet or unresolved, dd = doublet of doublets, br = broad signal. Coupling constants J are reported in Hz. 13C NMR is referenced to a chloroform peak (δ = 77.16 ppm). High-resolution mass spectra (HRMS) were obtained at the MIT DCIF (Department of Chemistry Instrumentation Facility) using electrospray ionization (ESI) or direct analysis in real time (DART).
THF Gel Permeation Chromatography (GPC) was performed with a concentration of 0.5 mg/ml on an Agilent 1260 Infinity system equipped with three PLgel columns (103, 104, 105 Å ) in series, calibrated with monodisperse polystyrene standards. UV-vis spectra were
recorded on Agilent Cary 4000 spectrometer at room temperature. Fluorescence measurements were performed at room temperature with a Horiba Jobin Yvon SPEX Fluorolog-τ3 fluorimeter (model FL-321, 450 W Xenon lamp) using right-angle conformation for solution and front-face conformation for thin films. The fluorescence spectra were recorded with the excitation at 400 nm. Regarding the sample preparations for photophysics measurements, the solutions were prepared in water. The solid-state films were prepared on glass by spin-coating 3000 rpm for 30 seconds from the solution in THF and annealed at 70 °C for 15 min in ambient atmosphere. The sizes of aggregates were measured with dynamic light scattering using a NanoBrook Omni (Brookhaven) instrument.
Emulsions are made from distilled water and 5 vol% of oil phases. Specifically, to the polymer solution in water (0.95 mL) is added heptane (0.05 mL) or benzyl benzoate (0.05 mL). The vial containing the mixture is shaken with the aid of vortex for 30–60 seconds. Confocal microscopy images are collected from the W. M. Keck Microscopy Facility at the Whitehead Institute. Zeiss 710 Laser Scanning Confocal Microcopy was used with the excitation lasers 405 or 458 nm. Photons are collected in two channels, one being green (ca. 460–510 nm) and the other being red (ca. 580–620 nm). The emulsion samples are placed between a cover slip and a microscope slide with double-sided tape, which creates a very thin gap where the samples can be loaded by capillary. The top droplets for heptane-in-water and the bottom droplets for benzyl benzoate-in-water were used.
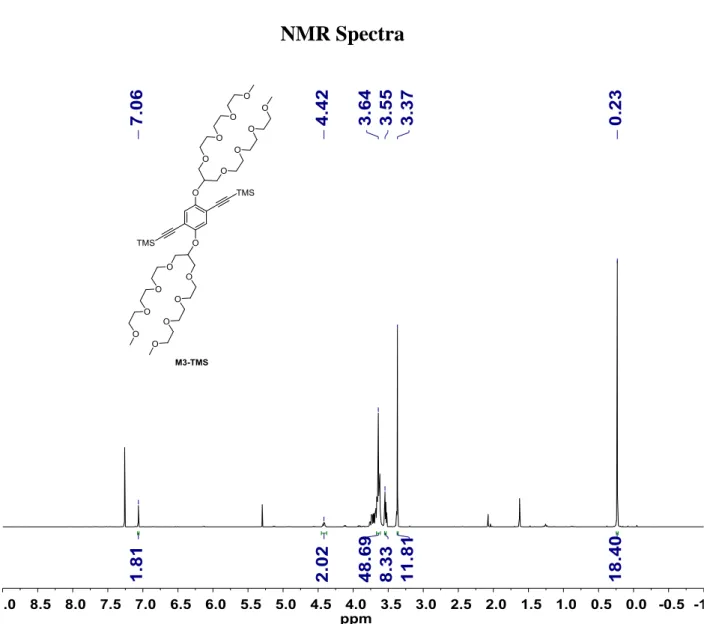
((2,5-bis((2,5,8,11,15,18,21,24-octaoxapentacosan-13-yl)oxy)-1,4-phenylene)bis(ethyne-2,1-diyl))bis(trimethylsilane) (M3-TMS). To the flame-dried Schlenk flask, M3 (340 mg,
0.183 mmol, 1 equiv), Pd(PPh3)2Cl2 (10.9 mg, 0.009 mmol, 5 mol%), and CuI (3.0 mg, 0.009
mmol, 5 mol%) were added, followed by three vacuum-argon exchange cycles. The mixture of THF:diisopropylamine (7:3 v/v) was degassed with N2 for 30 min and 2 mL of the mixture
was added to the flask. Ethynyltrimethylsilane (0.13 mL, 0.55 mmol, 3 equiv) were added. The mixture was stirred at 40 °C for 22 hours. After cooling down to room temperature, the solvents were evaporated in vacuo. The crude material was purified by column chromatography (hexane:CH2Cl2:EtOAc:MeOH = 5:3:2:1). 96% yield (average of two
reactions). 1H NMR (400 MHz, CDCl
3) δ 7.06 (s, 2H), 4.42 (quint, J = 5.1 Hz, 2H), 3.74 –
3.61 (m, 48H), 3.56 – 3.52 (m, 8H), 3.37 (s, 12H), 0.23 (s, 18H).
13,13'-((2,5-diethynyl-1,4-phenylene)bis(oxy))bis(2',5',8',11',15',18',21',24'-octaoxapentacosane) (M1). The starting material M3-TMS (189 mg, 0.183 mmol, 1 equiv)
was placed in a vial, followed by three vacuum-argon exchange cycles. KOH (30.7 mg, 0.548 mmol, 3 equiv) was dissolved in MeOH with the concentration of 30.7 mg/1 mL. THF (1 mL) and KOH-MeOH solution (1 mL) were added to the vial (there may be a slight error in the amount of added KOH due to density change of KOH-MeOH solution, but it may not be significant). The mixture was stirred at room temperature for 5 hours, followed by evaporation in vacuo. The crude material was purified by column chromatography (EtOAc:MeOH = 10:1). 88% yield (average of two reactions). 1H NMR (400 MHz, CDCl3) δ
7.15 (s, 2H), 4.43 (quint, J = 5.1 Hz, 2H), 3.76 – 3.60 (m, 48H), 3.56 – 3.51 (m, 8H), 3.37 (s, 12H). 13C NMR (101 MHz, CDCl
3) δ 154.14, 121.50, 115.04, 82.75, 80.01, 79.71, 71.91,
71.15, 70.62, 70.60, 70.55, 70.49, 59.01. HRMS (DART) calculated for C44H75O18 ([M+H]+)
891.4948; found, 891.4977.
Polymerization. P1 and P2 are synthesized as follows.
P1. To the flame-dried Schlenk flask, M1 (30 mg, 0.0337 mmol, 1.00 equiv), M2 (35.1 mg,
0.0354 mmol, 1.05 equiv), Pd(PPh3)4 (2.0 mg, 0.0017 mmol, 5 mol%), and CuI (0.64 mg,
0.0034 mmol, 10 mol%) were added. The flask containing reagents was evacuated and back-filled with argon for 3 times. The mixture of dry THF:triethylamine (3:1 v/v) was degassed with nitrogen for 30 min, and 1.5 mL was added to the flask. The reaction mixture was stirred for 30 min at room temperature to completely dissolve all the materials, followed by stirring at 50 °C for 5 hours. Perylene-1 (2.3 mg, 0.0025 mmol, 0.075 equiv) dissolved in dry THF (0.5 mL) was added and further stirred at 50 °C for 18 hours. The crude mixture was concentrated in vacuo, diluted with DCM, filtered through a short plug (1–2 cm) of silica gel. After concentrated in vacuo, preparative GPC in THF was performed to separate high
molecular weight fraction of the solid product. The resulting fraction in THF was evaporated under reduced pressure, and the product was dried in vacuo, affording a red rubbery solid (43 mg). 78% yield (yield does not consider endgroup since it is a very small amount). 1H NMR (400 MHz, CDCl3) δ 7.18 (s, 2H), 7.05 (s, 2H), 4.85 (br, 4H), 4.54 (br, 2H), 3.76 – 3.52 (br,
84H), 3.35 (s, 18H), 1.53 (br, 4H), 1.25 (br, 20H), 0.86 (br, 6H), where the proton integrations are based on the repeat unit. GPC (THF): Mn = 9.5 kDa (degree of polymerization = 5.8), Đ =
1.36.
P2. To the flame-dried Schlenk flask, M1 (50.0 mg, 0.0561 mmol, 1.00 equiv), M3 (64.5 mg,
0.0589 mmol, 1.05 equiv), Pd(PPh3)4 (3.2 mg, 0.0028 mmol, 5 mol%), and CuI (1.1 mg,
0.0056 mmol, 10 mol%) were added. The flask containing reagents was evacuated and back-filled with argon for 3 times. The mixture of dry THF:triethylamine (3:1 v/v) was degassed with nitrogen for 30 min, and 2 mL was added to the flask. The reaction mixture was stirred for 30 min at room temperature to completely dissolve all the materials, followed by stirring at 50 °C for 17 hours. Perylene-1 (6.0 mg, 0.0066 mmol, 0.012 equiv) dissolved in dry THF (0.5 mL) was added and further stirred at 50 °C for 26 hours. The crude mixture was concentrated in vacuo, diluted with DCM, filtered through a short plug (1–2 cm) of silica gel. After concentrated in vacuo, preparative GPC in THF was performed to separate high molecular weight fraction of the solid product. The resulting fraction in THF was evaporated under reduced pressure, and the product was dried in vacuo, affording a red rubbery solid (80 mg). 82% yield (yield does not consider endgroup since it is a very small amount). 1H NMR (400 MHz, CDCl3) δ 7.14 (s, 4H), 4.51 (br, 4H), 3.76 – 3.50 (br, 112H), 3.34 (s, 24H), where
the proton integrations are based on the repeat unit. GPC (THF): Mn = 14 kDa (degree of
Additional Data
450 500 550 600 650 700 0.0 0.2 0.4 0.6 0.8 1.0 E mis sion ( No rma li ze d ) Wavelength (nm) water water+heptaneFigure S1. Oil-in-water emulsion stabilized by P2. The black curve shows the emission spectrum of P2 in water. The red curve represents the emission in the presence of heptane with shaking for 30 – 60 seconds. The exciton migration is not efficient as compared to P1 (Figure 3), presumably owing to the high water-solubility of P2 which would not be efficiently localized at the oil–water interfaces.
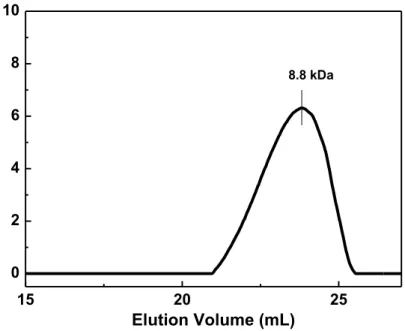
15 20 25 0 2 4 6 8 10 Elution Volume (mL) 8.8 kDa
Figure S2. P1 gel permeation chromatogram with refractive index detector, indicating single chromatogram with the peak molecular weight of 8.8 kDa.
400 500 600 700 0.0 0.5 1.0 Wavelength (nm) Ab so rb an ce ( a.u.) 0 4 8 12 16 20 E mis sion ( a.u.)
Figure S3. Absorption and emission (excitation at 400 nm) spectra of the perylene monoimide derivative (the structure shown in inset).
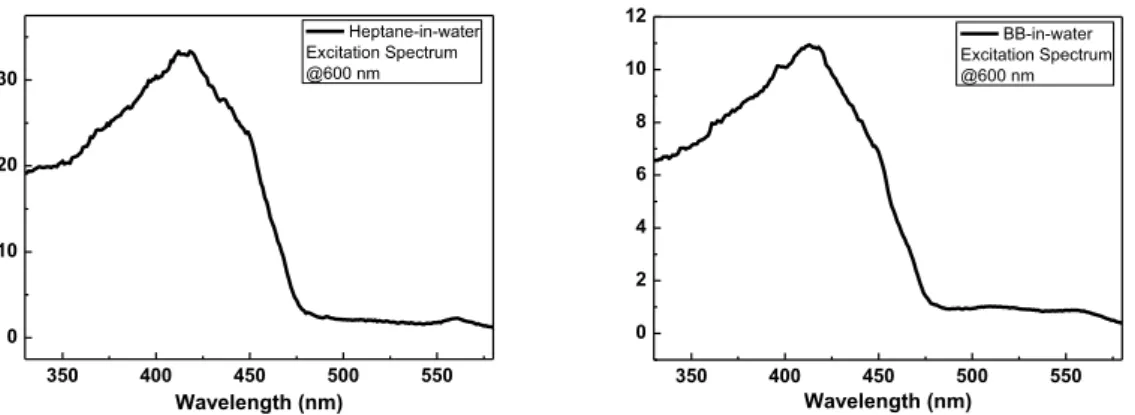
350 400 450 500 550 0 10 20 30 Wavelength (nm) Heptane-in-water Excitation Spectrum @600 nm 350 400 450 500 550 0 2 4 6 8 10 12 Wavelength (nm) BB-in-water Excitation Spectrum @600 nm
Figure S5. Excitation spectra with the emission detected at 600 nm in heptane-in-water (left) and BB-in-water (right) emulsions stabilized by P1. They show that the enhanced red emission is originated from the PPE absorption, not from the perylene, indicating the exciton migration from polymer to perylene.
Figure S4. Dynamic light scattering (DLS) data to measure the aggregate size of P1 in water, resulting in the size of 273 nm.
(a) (b) (c)
(d) (e) (f)
Figure S6. Confocal laser scanning microscopy images of emulsions prepared from an aqueous P1 solution with the concentration of 100 μg/mL. (a–c) Heptane-in-water with (a) mixed (b) green and (c) red emission channels. (d–f) Benzyl benzoate-in-water with (d) mixed (e) green and (f) red emission channels.
NMR Spectra
Figure S7. 1H NMR spectrum of M3-TMS in CDCl 3.
Figure S8. 1H NMR spectrum of M1 in CDCl 3.
Figure S9. 13C NMR spectrum of M1 in CDCl 3.
Figure S10. 1H NMR spectrum of P1 in CDCl
3. Inset is the enlarged area (7.3 – 10 ppm), showing the
Figure S11. 1H NMR spectrum of P2 in CDCl
3. Inset is the enlarged area (7.3 – 10 ppm), showing the
References
1. J. Bouffard, T. M. Swager, Chem. Commun. 2008, 5387.
2. J. Freudenberg, J. Kumpf, V. Schäfer, E. Sauter, S. J. Wörner, K. Brödner, A. Dreuw, U. H. F. Bunz, J. Org. Chem. 2013, 78, 4949.