HAL Id: insu-01285792
https://hal-insu.archives-ouvertes.fr/insu-01285792
Submitted on 10 Mar 2016
HAL is a multi-disciplinary open access
archive for the deposit and dissemination of
sci-entific research documents, whether they are
pub-lished or not. The documents may come from
teaching and research institutions in France or
abroad, or from public or private research centers.
L’archive ouverte pluridisciplinaire HAL, est
destinée au dépôt et à la diffusion de documents
scientifiques de niveau recherche, publiés ou non,
émanant des établissements d’enseignement et de
recherche français ou étrangers, des laboratoires
publics ou privés.
Surface wave dispersion across Tibet: Direct evidence
for radial anisotropy in the crust
F Duret, Nikolai M. Shapiro, Z Cao, V Levin, P Molnar, S Roecker
To cite this version:
F Duret, Nikolai M. Shapiro, Z Cao, V Levin, P Molnar, et al.. Surface wave dispersion across
Tibet: Direct evidence for radial anisotropy in the crust. Geophysical Research Letters, American
Geophysical Union, 2010, 37 (16), �10.1029/2010GL043811�. �insu-01285792�
Surface wave dispersion across Tibet: Direct
evidence for radial anisotropy in the crust
F. Duret,
1N. M. Shapiro,
1Z. Cao,
2V. Levin,
3P. Molnar,
4and S. Roecker
5Received 30 April 2010; revised 3 June 2010; accepted 7 July 2010; published 24 August 2010.
[1] Recordings in western Tibet of Rayleigh and Love
waves at periods less than 70 s from aftershocks of the 2008 Sichuan earthquake cannot be matched by an isotropic velocity model beneath Tibet. These intermediate‐period Rayleigh and Love waves require marked radial anisotropy in the middle crust of Tibet, with the vertically polarized S‐ waves propagating more slowly than S‐waves with horizon-tal polarization. The magnitude of anisotropy inferred using paths entirely within Tibet is slightly greater than that ob-tained previously from a tomographic inversion of a dataset covering a larger region. Anisotropy in the middle crust likely reflects deformation of the middle crust, and is consis-tent with the notion of mid‐crustal flow and thinning of the crust.Citation: Duret, F., N. M. Shapiro, Z. Cao, V. Levin, P. Molnar, and S. Roecker (2010), Surface wave dispersion across Tibet: Direct evidence for radial anisotropy in the crust, Geophys. Res. Lett., 37, L16306, doi:10.1029/2010GL043811.
1.
Introduction
[2] Although formed as a consequence of the
northeast-ward convergence of India with Eurasia, the Tibetan plateau presently extends with a largely east‐west orientation, and the preponderance of normal faulting implies crustal thin-ning [e.g., Molnar and Tapponnier, 1978; Armijo et al., 1986; England and Houseman, 1989; Zhang et al., 2004]. Although potential energy associated with the elevated topography is expended during extension [e.g., Molnar and Lyon‐Caen, 1988; Houseman and England, 1993; Copley and McKenzie, 2007], the details of the Tibetan plateau deformation and, in particular, its distribution with depth remain actively debated. Competing end‐member ideas include coupled deformation of the crust and the underlying upper mantle [e.g., Flesch et al., 2005; Wang et al., 2008], as is implicit in thin viscous sheet models of continental deformation [e.g., England and McKenzie, 1982; England and Houseman, 1986], different deformation of crust and mantle, facilitated by a low‐strength channel in its lower part [e.g., Royden, 1996; Clark and Royden, 2000; Beaumont et al., 2006; Klemperer, 2006; King et al., 2007;
Royden et al., 2008], or a mixture of both [e.g., Bendick and Flesch, 2007].
[3] Deformation of the mantle or crustal rocks leads to
lattice or shape preferred orientations of individual minerals that, in turn, may result in seismic anisotropy (directional dependence of seismic properties). Therefore, observations of this anisotropy constrain the nature and distribution of deformation, and therefore bear on Tibetan tectonics.
[4] Analysis of core‐refracted shear wave splitting at
numerous sites in and near Tibet indicate that the upper mantle in this region is markedly anisotropic. Moreover, the orientations of the faster quasi‐S waves correlate with active and finite deformation inferred from observations at the sur-face, making a strong argument in favor of crust‐mantle coupling [e.g., Davis et al., 1997; Holt, 2000; Flesch et al., 2005; Wang et al., 2008]. In addition, seismic anisotropy has also been observed within the Tibetan crust [e.g., Ozacar and Zandt, 2004; Sherrington et al., 2004; Levin et al., 2008]. [5] Seismic anisotropy can also be inferred from the
simultaneous analysis of dispersion of Love and Rayleigh waves, which are horizontally and vertically polarized, respectively. This approach was widely used to study the radial anisotropy in the upper mantle on a global scale [e.g., Ekstrom and Dziewonski, 1998; Shapiro and Ritzwoller, 2002; Beghein et al., 2006; Becker et al., 2008]. More recently, radial anisotropy within the crust has been dem-onstrated in regions of active extension and crustal thinning, such as Tibet [Shapiro et al., 2004; Chen et al., 2009], and Western United States [Moschetti et al., 2010]. Because they constrain the depth distribution of structure, surface waves offer an advantage over near‐vertically propagating tele-seismic S‐waves. The inversion of a vast surface wave da-taset by Shapiro et al. [2004] revealed 10% to 20% radial anisotropy throughout the middle crust (20–50 km depth) beneath the Tibetan plateau. This result suggests that the Tibetan middle crust has been deformed, consistent with channel flow within the crust.
[6] One limitation of that study is that it was based on
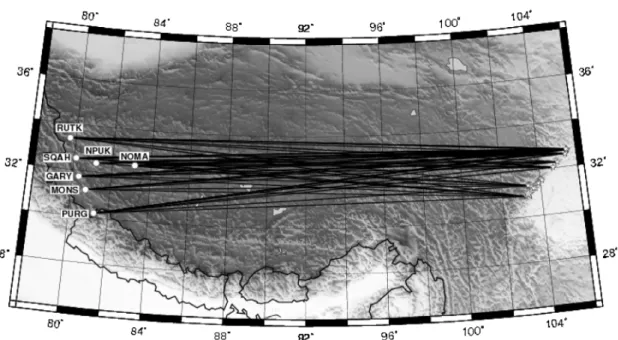
tomographic inversion of a dataset where most of surface‐ wave paths sampled large areas outside Tibet. This config-uration results from the limited number of seismographs. We used the data from an ongoing Western Tibet PASSCAL seismic experiment and records of aftershocks of the May 12, 2008 Sichuan earthquake. These new data sample exclusively the Tibetan plateau (Figure 1), offering an independent check of the mid‐crustal anisotropy.
2.
Data Selection
[7] Because of its complex source time function, the
mainshock is not suitable for dispersion measurements. We also excluded from the analysis hours immediately after the
1Laboratoire de Sismologie, UMR 7154, Institut de Physique du
Globe de Paris, Université Paris Diderot, CNRS, Paris, France.
2Tibetan Bureau, China Earthquake Administration, Lhasa, China. 3
Department of Geological Sciences, Wright Geological Laboratory, Rutgers University, Piscataway, New Jersey, USA.
4
Department of Geological Sciences, University of Colorado at Boulder, Boulder, Colorado, USA.
5
Department of Earth and Environmental Sciences, Rensselaer Polytechnic Institute, Troy, New York, USA.
Copyright 2010 by the American Geophysical Union. 0094‐8276/10/2010GL043811
GEOPHYSICAL RESEARCH LETTERS, VOL. 37, L16306,doi:10.1029/2010GL043811, 2010
main event because of the large number of aftershocks that were closely spaced in time and, therefore, whose surface waves were difficult to isolate. We selected 9 aftershocks with magnitudes ranging from 5.5 to 6.1 (Figure 1 and Table 1). These events are strong enough to excite energetic intermediate and long period surface waves (Figures 2a and 2b) and at the same time their source time functions are simple enough that they can be approximated by delta functions. After visually inspecting the seismograms and the corresponding frequency‐time diagrams, we selected a set of 60 traces for Rayleigh waves and 53 traces for Love waves (Table 1).
3.
Group Velocity Measurements
[8] For every selected event‐station pair we used the
vertical component record to analyze Rayleigh waves, and we rotated horizontal components to get a transverse component record to analyze Love waves (Figure 2). The Rayleigh wave exhibits clear reverse dispersion (high frequencies arriving before low frequencies) at periods between 10 and 40 s but the Love wave is characterized by normal dispersion at the same periods.
[9] We applied Frequency‐Time Analysis (FTAN) [Barmin
et al., 1989] to measure group velocities of the selected waveforms between 10 s and 100 s (Figure 2).
[10] Previous local studies with earthquake‐station paths
located within the Western Tibet showed that Rayleigh waves propagate slightly faster in the northern part of the plateau than in its southern part [e.g., Rapine et al., 2003]. In our study, we use the measurements from long (∼1500 km) paths aligned in the East–West direction and covering the area extending∼300 km in the North–South direction. This extent is about the size of the Fresnel zone for a 30–40 s Rayleigh wave, making it impossible to recover lateral variations in the crustal properties.
[11] Therefore, the measurements from all selected
records have been combined to compute average Rayleigh‐ and Love‐wave group velocity dispersion curves and their standard deviations (Figures 3a and 3c). Rayleigh wave dispersion exhibits a clear Airy phase with an unusual marked minimum at ∼35 seconds, which suggests that the speeds of vertically polarized shear waves (SV) within the crust are relatively low. Such a minimum is not observed for Love waves implying that horizontally‐polarized S‐waves (SH) may propagate faster than the vertically polarized SV waves and therefore, that crustal radial anisotropy char-Figure 1. Map of the studied region showing earthquake to stations paths where dispersion curves have been measured.
Table 1. List of Rayleigh Wave and Love Wave Dispersion Measurements, per Station, and per Event
Date, in 2008 Coordinates Mw GARY MONS NOMA NPUK PURG RUTK SQAH Total
134 07:07:08 (30.89, 103.19) 5.8 R L R L R L R L R L R L R L 7 7 137 05:25:47 (31.35, 103.35) 5.6 R L R L R L L R L R L R L 6 7 138 17:08:25 (32.24, 104.98) 5.8 R R L R L R L R L R L 6 5 146 08:21:49 (32.56, 105.42) 6.1 R L R L R L R L R L R L R L 7 7 148 08:37:51 (32.71, 105.54) 5.7 R L R L R L R L R L R L R L 7 7 205 19:54:44 (32.75, 105.50) 5.5 R R R L R L R R R 7 2 206 07:09:30 (32.75, 105.54) 5.7 R L R L R L R L R L R L R L 7 7 214 08:32:43 (32.03, 104.72) 5.7 R R L R L R L R L R L 6 5 218 09:49:17 (32.76, 105.49) 6.0 R R L R L R L R L R L R L 7 6 Total 9 5 8 7 9 9 8 9 9 8 9 7 8 8 60 53
DURET ET AL.: CRUSTAL RADIAL ANISOTROPY IN TIBET L16306
L16306
acterizes the Tibetan plateau as Shapiro et al. [2004] had inferred.
4.
Inversion of Dispersion Curves for Average
Crustal Structure
[12] We simultaneously invert the measured Rayleigh and
Love wave dispersion curves to deduce an average 1D shear‐wave velocity structure of the Tibetan crust. The inversion is based on a modified Monte‐Carlo method of Shapiro et al. [1997], and consists of testing randomly generated models by computing synthetic group velocity dispersion curves for Rayleigh and Love wave fundamental modes and by comparing them with observations. The computations are done with Herrmann’s [1987] subroutines. To introduce radial anisotropy we consider shear‐wave speeds when calculating dispersion curves for Rayleigh and Love waves. Models are parameterized as a set of layers (four in the crust and two in the uppermost mantle) with constant seismic speeds and densities. During the inversion, layer thicknesses, shear wave speed and amount of radial anisotropy (difference between VSVand VSH) are perturbed
randomly. P‐wave speeds and densities are scaled to S‐wave speeds via constant Vp/Vs ratio (1.73) and empirical
Vs‐density relation based on CRUST2.0 [Mooney et al., 1998; Bassin et al., 2000]. We start the inversion with an isotropic initial model obtained by averaging CUB2.0 [Shapiro and Ritzwoller, 2002] across the region of study. A random exploration of the model space is then performed until 1000 models that fit the data below the pre‐defined acceptable misfit level are found.
[13] When we did not include radial anisotropy in the
crust (VSV = VSH), as expected for Tibet, we find a thick
crust with Moho located at approximately 65 km. Also, relatively low velocities are found in the upper and the middle crust above 45 km. At the same time, we could not find an isotropic model that simultaneously fits the observed Rayleigh and Love wave dispersion curves within the error bars. At periods between 20 and 60 s, the predicted Rayleigh wave group velocities are systematically faster than observed, and the predicted Love‐wave velocities are too low.
[14] To resolve the observed Rayleigh‐Love discrepancy,
we introduced radial anisotropy in the crust. After testing different combinations of anisotropic layers, we found that models with anisotropy in the middle crust (between 15 and 45 km) fit the observed dispersion curves within their Figure 2. Results of the frequency‐time analysis of the event on day 205 recorded at station MONS. (a and b) Vertical and transverse component records lowpassed at 0.1 Hz. (c and d) Frequency‐time diagrams corresponding to records shown in Figures 2a and 2b. Amplitudes were normalized to 1 at every period. Black points show measured group velocities.
DURET ET AL.: CRUSTAL RADIAL ANISOTROPY IN TIBET L16306
uncertainties (Figures 3c and 3d), and offered the best trade‐ off between simplicity and fit to the data.
[15] To obtain a quantitative comparison of results, we
selected best‐fit models from inversions with and without anisotropy, and computed their RMS misfit to observed average dispersion curves in the period range between 15 and 70 s where we could get most reliable measurements. With the isotropic parameterization, the RMS misfits are 44.9 m/s and 82.3 m/s for Rayleigh and Love waves, respectively. After introducing the mid‐crustal radial anisotropy, they become 20.2 m/s and 12.7 m/s implying variance reduction of more than 80% relative to the isotropic parameterization.
5.
Conclusions
[16] Our analysis of records of May 12, 2008 Sichuan
earthquake aftershocks from stations of the Western Tibet PASSCAL seismic experiment clearly demonstrates that the intermediate‐period Rayleigh‐Love discrepancy is a wide-spread feature characterizing surface waves propagating across the Tibetan plateau. To explain this observation, we allow radial anisotropy in the crustal layers during the inversion of the observed dispersion curves. The results of the inversion show that a strong radial anisotropy in the middle crust (between 15 and 45 km) is required to fit
simultaneously observations of dispersion of Rayleigh and Love waves.
[17] This result, based on waves propagating entirely
within the Tibetan plateau, agrees with that previously reported by Shapiro et al. [2004] from a tomographic inversion of a dataset sampling a larger area. For quantita-tive comparison, we follow the approach by Shapiro et al. [2004] and compute the vertically averaged magnitude of the radial anisotropy as the idealized travel time difference between VSVand VSHwaves that are imagined to propagate
vertically through the middle crust. The average value of tSV− tSHcharacterizing most of Tibet is 0.58 ± 0.11 s. This
is slightly larger than the 0.5 ± 0.18 s value for the high plateau reported by Shapiro et al. [2004], indicating that the tomographic inversion could slightly under‐estimate the magnitude of the radial crustal anisotropy beneath Tibet. Moreover, because our estimate is an average for the whole path, but the results of Shapiro et al. [2004] suggested that radial anisotropy is greatest in the high part of the plateau, our data are consistent with yet large radial anisotropy than that given by 0.58 ± 0.11. Modeling anisotropic receiver functions at two sites in western Tibet, Levin et al. [2008] found a likely crustal contribution to the SKS splitting sig-nal to be under 0.3 s, a compatible value considering large differences in periods of seismic waves used. The presence of the radial anisotropy in the middle crust beneath the Figure 3. Results of the inversion of dispersion curves with isotropic parametrization and with radial anisotropy in the middle crust. (a and c) Group velocity dispersion curves. Rayleigh and Love wave observations are shown with black and light grey thin lines and error bars, respectively. Light and dark grey lines show Rayleigh and Love dispersion curves computed for models selected during the inversion. (b) Shear‐wave velocity profiles for ensemble of acceptable models obtained during the inversion with isotropic parameterization. (d) Shear‐wave velocity profiles for ensemble of acceptable models obtained during the inversion with allowing radial anisotropy in the middle crust. VSVand VSHare shown with light
grey and dark grey lines, respectively.
DURET ET AL.: CRUSTAL RADIAL ANISOTROPY IN TIBET L16306
L16306
Tibetan plateau implies that this layer is strongly deformed and, therefore, supports geodynamic models that include the presence of a relatively low‐strength channel at depths between 15 and 45 km.
[18] Acknowledgments. The Western Tibet project is funded by NSF‐Geophysics grants 0440062, 0439976, and 0440004 to VL, SR and PM. Equipment for data collection is provided by the PASSCAL program, and archiving of resulting data sets is facilitated by IRIS DMC. Personnel of Tibetan branch of China Earthquake Administration made challenging fieldwork possible. The work of FD and NS has been supported by Commissariat à l’Energie Atomique (France), by Agence Nationale de la Recherche (France) under contract ANR‐06‐CEXC‐005 (COHERSIS), and by a FP7 ERC advanced grant 227507 (WHISPER).
References
Armijo, R., P. Tapponnier, J. L. Mercier, and H. Tong‐Lin (1986), Quater-nary extension in southern Tibet: Field observations and tectonic impli-cations, J. Geophys. Res., 91(B14), 13,803–13,872.
Barmin, M. P., B. G. Bukchin, E. N. Its, A. V. Lander, A. L. Levshin, L. I. Ratnikova, and T. B. Yanovskaya (1989), Seismic Surface Waves in a Laterally Inhomogeneous Earth, Kluwer Acad., Dordrecht, Netherlands. Bassin, C., G. Laske, and G. Masters (2000), The current limits of resolu-tion for surface wave tomography in North America, Eos Trans. AGU, 81(48), Fall Meet. Suppl., Abstract S12A‐03.
Beaumont, C., M. H. Nguyen, R. A. Jamieson, and S. Ellis (2006), Crustal flow modes in large hot orogens, in Channel Flow, Ductile Extrusion and Exhumation in Continental Collision Zones, edited by R. D. Law, M. P. Searle, and L. Godin, Geol. Soc. Spec. Publ., 268, 91–145. Becker, T. W., B. Kustowski, and G. Ekstrom (2008), Radial seismic
anisotropy as a constraint for upper mantle rheology, Earth Planet. Sci. Lett., 267(1–2), 213–227.
Beghein, C., J. Trampert, and H. J. van Heijst (2006), Radial anisotropy in seismic reference models of the mantle, J. Geophys. Res., 111, B02303, doi:10.1029/2005JB003728.
Bendick, R., and L. Flesch (2007), Reconciling lithospheric deformation and lower crustal flow beneath central Tibet, Geology, 35(10), 895–898. Chen, Y., J. Badal, and Z. J. Zhang (2009), Radial anisotropy in the crust and upper mantle beneath the Qinghai‐Tibet plateau and surrounding regions, J. Asian Earth Sci., 36(4–5), 289–302.
Clark, M. K., and L. H. Royden (2000), Topographic ooze: Building the eastern margin of Tibet by lower crustal flow, Geology, 28(8), 703–706. Copley, A., and D. McKenzie (2007), Models of crustal flow in the India‐
Asia collision zone, Geophys. J. Int., 169(2), 683–698.
Davis, P., P. England, and G. Houseman (1997), Comparison of shear wave splitting and finite strain from the India‐Asia collision zone, J. Geophys. Res., 102(B12), 27,511–27,522.
Ekstrom, G., and A. M. Dziewonski (1998), The unique anisotropy in the Pacific upper mantle, Nature, 394(6689), 168–172.
England, P., and G. Houseman (1986), Finite strain calculations of conti-nental deformation: 2. Comparison With the India‐Asia collision zone, J. Geophys. Res., 91(B3), 3664–3676.
England, P., and G. Houseman (1989), Extension during continental convergence, with application to the Tibetan Plateau, J. Geophys. Res., 94(B12), 17,561–17,579.
England, P., and D. McKenzie (1982), A thin and viscous sheet model for continental deformation, Geophys. J. R. Astron. Soc., 70(2), 295–321. Flesch, L. M., W. E. Holt, P. G. Silver, M. Stephenson, C. Y. Wang, and
W. W. Chan (2005), Constraining the extend of crust‐mantle coupling in central Asia using GPS, geologic, and shear‐wave splitting data, Earth Planet. Sci. Lett., 238(1–2), 248–268.
Herrmann, R. B. (1987), Computer programs in seismology, Saint Louis Univ., St. Louis, Mo. (Available at http://www.eas.slu.edu/People/ RBHerrmann/CPS330.html)
Holt, W. E. (2000), Correlated crust and mantle strain fields in Tibet, Geology, 28(1), 67–70.
Houseman, G., and P. England (1993), Crustal thickening versus lateral expulsion in the Indian‐Asian continental collision, J. Geophys. Res., 98(B7), 12,233–12,249.
King, J., N. Harris, T. Argles, R. Parrish, B. Charlier, S. Sherlock, and H. F. Zhang (2007), First field evidence of southward ductile flow of Asian crust beneath southern Tibet, Geology, 35(8), 727–730. Klemperer, S. L. (2006), Crustal flow in Tibet: Geophysical evidence for
the physical state of the Tibetan lithosphere, and inferred pattern of active flows, in Channel Flow, Ductile Extrusion and Exhumation in Continental Collision Zones, edited by R. D. Law, M. P. Searle, and L. Godin, Geol. Soc. Spec. Publ, 268, 39–70.
Levin, V., S. Roecker, P. Graham, and A. Hosseini (2008), Seimic anisotropy indicators in Western Tibet: Shear wave splitting and receiver function analysis, Tectonophysics, 462(1–4), 99–108. Molnar, P., and H. Lyon‐Caen (1988), Some simple physical aspects of
the support, structure, and evolution of mountain belts, in Processes in Continental Lithospheric Deformation, edited by S. P. Clark Jr., B. C. Burchfiel, and J. Suppe, Geol. Soc. Am. Spec. Pap., 218, 179–207. Molnar, P., and P. Tapponnier (1978), Active tectonics of Tibet, J. Geophys.
Res., 83(B11), 5361–5375.
Mooney, W., G. Laske, and T. Masters (1998), CRUST 5.1: A global crustal model at 5° × 5°, J. Geophys. Res., 103(B1), 727–747. Moschetti, M. P., M. H. Ritzwoller, and F. C. Lin (2010), Seismic evidence
for widespread crustal deformation caused by extension in the western USA, Nature, 464(7290), 885–889.
Ozacar, A. A., and G. Zandt (2004), Crustal seismic anisotropy in central Tibet: Implications for deformational style and flow in the crust, Geophys. Res. Lett., 31, L23601, doi:10.1029/2004GL021096. Rapine, R., F. Tilmann, M. West, J. Ni, and A. Rodgers (2003), Crustal
structure of northern and southern Tibet from surface wave dispersion analysis, J. Geophys. Res., 108(B2), 2120, doi:10.1029/2001JB000445. Royden, L. (1996), Coupling and decoupling of crust and mantle in conver-gent orogens: Implications for strain partitioning in the crust, J. Geophys. Res., 101(B8), 17,679–17,705.
Royden, L. H., B. C. Burchfiel, and R. D. van der Hilst (2008), The geo-logical evolution of the Tibetan Plateau, Science, 321(5892), 1054–1058. Shapiro, N. M., and M. H. Ritzwoller (2002), Monte‐carlo inversion for a global shear‐velocity model of the crust and the upper mantle, Geophys. J. Int., 151(1), 88–105.
Shapiro, N. M., M. Campillo, A. Paul, S. K. Singh, D. Jongmans, and F. J. Sanchez‐Sesma (1997), Surface‐wave propagation accross the Mexican Volcanic Belt and the origin of the long‐period seismic‐wave amplification in the Valley of Mexico, Geophys.J. Int., 128(1), 151–166. Shapiro, N. M., M. H. Ritzwoller, P. Molnar, and V. Levin (2004), Thinning and flow of Tibetan crust constrained by seismic anisotropy, Science, 305(5681), 233–236.
Sherrington, H. F., G. Zandt, and A. Frederiksen (2004), Crustal fabric in the Tibetan Plateau based on waveform inversions for seismic anisotropy parameters, J. Geophys. Res., 109, B02312, doi:10.1029/2002JB002345. Wang, C. Y., L. M. Flesch, P. G. Silver, L. J. Chang, and W. W. Chan (2008), Evidence for mechanically coupled lithosphere in central Asia and resulting implications, Geology, 36(5), 363–366.
Zhang, Z. J., J. W. Teng, Y. K. Li, S. L. Klemperer, and L. Q. Yang (2004), Crustal structure of seismic velocity in southern Tibet and east‐westward escape of the crustal material—An example by wide‐angle seismic profile from Peigu Tso to Pumoyong Tso, Sci. China Ser. D, 47(6), 500–506.
Z. Cao, Tibetan Bureau, China Earthquake Administration, 22 Niangre Avenue, Lhasa 850000, China.
F. Duret and N. M. Shapiro, Laboratoire de Sismologie, Institut de Physique du Globe de Paris, 4 place Jussieu, Boite 89, F‐75252 Paris CEDEX 05, France. ([email protected]; [email protected])
V. Levin, Department of Earth and Planetary Sciences, Wright Geological Laboratory, Rutgers University, 610 Taylor Rd., Piscataway, NJ 08854‐8066, USA. ([email protected])
P. Molnar, Department of Geological Sciences, University of Colorado at Boulder, UCB 399, 2200 Colorado Ave., Boulder, CO 80309‐0399, USA. ([email protected])
S. Roecker, Department of Earth and Environmental Sciences, Rensselaer Polytechnic Institute, 110 8th St., Troy, NY 12180, USA.
DURET ET AL.: CRUSTAL RADIAL ANISOTROPY IN TIBET L16306