HAL Id: hal-02297095
https://hal.sorbonne-universite.fr/hal-02297095
Submitted on 25 Sep 2019
HAL is a multi-disciplinary open access
archive for the deposit and dissemination of
sci-entific research documents, whether they are
pub-lished or not. The documents may come from
teaching and research institutions in France or
abroad, or from public or private research centers.
L’archive ouverte pluridisciplinaire HAL, est
destinée au dépôt et à la diffusion de documents
scientifiques de niveau recherche, publiés ou non,
émanant des établissements d’enseignement et de
recherche français ou étrangers, des laboratoires
publics ou privés.
physiology of corals and coralline algae under ocean
acidification
S. Comeau, C. Cornwall, C. Pupier, T. Decarlo, C. Alessi, R. Trehern, T.
Mcculloch
To cite this version:
S. Comeau, C. Cornwall, C. Pupier, T. Decarlo, C. Alessi, et al.. Flow-driven micro-scale pH variability
affects the physiology of corals and coralline algae under ocean acidification. Scientific Reports, Nature
Publishing Group, 2019, 9, pp.12829. �10.1038/s41598-019-49044-w�. �hal-02297095�
flow-driven micro-scale pH
variability affects the physiology
of corals and coralline algae under
ocean acidification
S. comeau
1,2,3, C. E. cornwall
1,2,4, C. A. pupier
1,5,6, T. M. Decarlo
1,2, C. Alessi
1,
R. trehern
1& M. T. Mcculloch
1,2Natural variability in pH in the diffusive boundary layer (DBL), the discrete layer of seawater between bulk seawater and the outer surface of organisms, could be an important factor determining the response of corals and coralline algae to ocean acidification (OA). Here, two corals with different morphologies and one coralline alga were maintained under two different regimes of flow velocities, pH, and light intensities in a 12 flumes experimental system for a period of 27 weeks. We used a
combination of geochemical proxies, physiological and micro-probe measurements to assess how these treatments affected the conditions in the DBL and the response of organisms to OA. Overall, low flow velocity did not ameliorate the negative effect of low pH and therefore did not provide a refugia from OA. Flow velocity had species-specific effects with positive effects on calcification for two species. pH in
the calcifying fluid (pHcf) was reduced by low flow in both corals at low light only. pHcf was significantly
impacted by pH in the DBL for the two species capable of significantly modifying pH in the DBL. The
dissolved inorganic carbon in the calcifying fluid (DICcf) was highest under low pH for the corals and
low flow for the coralline, while the saturation state in the calcifying fluid and its proxy (FWHM) were generally not affected by the treatments. This study therefore demonstrates that the effects of OA will manifest most severely in a combination of lower light and lower flow habitats for sub-tropical coralline algae. These effects will also be greatest in lower flow habitats for some corals. Together with existing literature, these findings reinforce that the effects of OA are highly context dependent, and will differ greatly between habitats, and depending on species composition.
Ocean acidification (OA) is a major threat to many marine calcifying species, acting to reduce the calcification of ecologically important species such as reef-forming corals and coralline algae1. However, there is evidence that responses to OA are context-dependent, with interactions across species and the environment mediating the strength of responses2,3. One potentially important and still poorly studied controller of the direction and magnitude of responses is the seawater velocity that resident organisms are exposed to4,5. This is expected to be most important at the discrete boundary layer between marine organisms and ambient seawater, where flow is reduced to the point such that the movement of dissolved substances between the bulk seawater and the surface of the organism is dominated by molecular diffusion6. This layer, known as the diffusion/diffusive boundary layer (DBL), increases in thickness as seawater velocity decreases7,8.
There are three main reasons via which mass transfer limitation in the DBL could influence the response of calcifying organisms to OA: (1) by changing the pH environment at their surface9,10, (2) by limiting the transfer of essential nutrients and dissolved inorganic carbon11,12, (3) or by causing the build-up of waste substances, such 1The University of Western Australia, Oceans Graduate School and Oceans Institute, 35 Stirling Highway, Crawley,
6009, Western Australia, Australia. 2ARC Centre of Excellence for Coral Reef Studies, 35 Stirling Highway, Crawley,
6009, Western Australia, Australia. 3Sorbonne Université, CNRS-INSU, Laboratoire d’Océanographie de Villefranche,
181 chemin du Lazaret, F–06230, Villefranche-sur-mer, France. 4School of Biological Sciences, Victoria University
of Wellington, Wellington, New Zealand. 5Centre Scientifique de Monaco, 8 Quai Antoine Ier, MC-98000, Monaco,
Monaco. 6Sorbonne Université, Collège doctoral, F-75005, Paris, France. S. Comeau and C. E. Cornwall contributed
equally. Correspondence and requests for materials should be addressed to S.C. (email: [email protected]) Received: 23 November 2018
Accepted: 1 August 2019 Published: xx xx xxxx
as protons during calcification13. The concentration gradient within the DBL is directly related to its thickness and the metabolic activity of the organism5,14. Therefore, when water velocity decreases, it increases the thick-ness of the DBL which favours the increase of pH at the surface of photosynthetic organisms during the day, and decreases in pH at night due to respiration10,15. There has been significant discussion of whether such diurnal changes in DBL pH may ameliorate the impacts of OA, whereby pH during the day and mean pH encountered by the organism are increased relative to the overlying seawater16.
Conversely, reduced dissolved inorganic carbon or nutrients within thicker DBLs could have negative rami-fications under OA. In many temperate systems, reduced nutrient concentrations at the surface of the organism might not have great impacts, but in already nutrient-poor systems such as coral reefs, these effects could have large impacts on organism metabolism. These would act additively with the impacts of OA. Reduced export of protons from the calcifying fluid to the external seawater is another possible negative ramification of thicker DBLs that could alter responses to OA, following the proton flux hypothesis13. This would manifest by reducing pH in the calcifying fluid (pHcf), with the effects expected to be most pronounced under both OA and slow flow.
Only two studies have examined the interactive effects of water velocity and OA, finding contrasting effects. Cornwall et al.5 found that the effects of OA were ameliorated for a temperate articulate coralline alga under slow flow (interactive effects). Daily increases in pH within the DBL were greater under slow flow and OA than nightly decreases in pH, thereby increasing mean pH at the surface, corresponding to faster calcification rates. Conversely, Comeau et al.4 found that a coral reef community comprised of corals, crustose coralline algae (CCA) and carbonate sediments had lower calcification under both reduced pH and under slower flow (additive effects). Three logical explanations exist for the contrasting results due to: (1) differences between organism physiology; (2) environmental conditions; or (3) the inclusion of sediment in Comeau et al.’s study. Coral reef communities are more likely to display mass-transfer limitation than temperate macroalgae17, therefore any positive effects of pH modification in the DBL may be overwhelmed by the negative impacts of nutrient limitation during Comeau et al.4. Tropical corals (and even CCA) might therefore be expected to respond differently from temperate artic-ulate coralline algae. This could be due to the fact that the capacity of corals to modify pH at their surface might be much less than that of the coralline algae, or because their export of protons from their calcifying site might be differentially impacted by flow. Unfortunately, neither Cornwall et al.5 nor Comeau et al.4 measured pH
cf, nor did Comeau et al.4 measure pH in the DBL of the different species in their communities.
Here we attempt to gain a greater understanding of how seawater velocity will interact with OA for key calcify-ing species, corals and CCA, by testcalcify-ing two competcalcify-ing questions, based on the results of seemcalcify-ingly contradictory studies4,5. Will slow flow provide a refugia from OA for calcifying species16, or will faster flow reduce the impacts of OA? We tease out the physiological mechanisms responsible for both past results by growing corals and CCA under an interactive combination of slow/fast flow and low/ambient pH over a longer duration than used pre-viously (27 weeks), and measure pH both at the surface of all organisms within the DBL, and pH within their calcifying fluids. We do this by using both taxa (corals and CCA) and by also crossing the already complex design with two irradiance regimes, with both high and low light for each taxon. While light is known to influence cal-cification and photosynthesis rates of both taxa18,19, and can be particularly important in mediating the response of macroalgae to OA20, these regimes also allow us to have one condition where pH modification in the DBL is potentially high and another where it is low (i.e. high and low light respectively). We conduct these experiments under conditions where nutrient concentrations are similar to those in coral reef systems (low concentrations), to represent the natural conditions where the organisms were collected and to test whether mass transfer limitation could be responsible for past results21. We hypothesize (1) that if slow flow acts ubiquitously as a refugia, then day time pH in the DBL will be directly correlated to calcification rates and favourable calcifying fluid chemistry across all treatments, (2) that if the export of protons limits calcification under slow flow, then pHcf will be lower under slow flow for all taxa, particularly when combined with OA, and (3) if neither hypothesis is correct then mass-transfer limitation is responsible for the interactive effects.
Materials and Methods
Organism collection and preparation.
The experiment was carried out from February 15th until August 25th 2017 in the University of Western Australia’s Indian Ocean Marine Research Centre at Watermans Bay. Two weeks prior to the start of the experiment organisms were collected from Salmon Bay, Rottnest Island, WA, Australia (32°01′16.44″S, 115°31′16.60″E), which is located ~15 km offshore the marine laboratory (see Ross et al.22 for the site description). A total of 48 branches (~5 cm tall) of the coral Acropora yongei were hand-collected and 48 whole colonies (~5 cm in diameter) of the coral Plesiastrea versipora were chiselled out from the reef at ~1–2 m depth. Acropora branches were collected ~5 m apart to maximise genetic diversity. Additionally, 48 whole rhodoliths of the coralline alga (CCA) Sporolithon durum (~5–8 cm) were hand picked at ~1–2 m depth. Only S. durum with limited or no exposed skeleton were selected. Back at the laboratory, the corals were glued to plastic supports using epoxy glue and tags were attached to S. durum using nylon lines. Organisms were acclimated to the laboratory lighting, temperature, and flow conditions (similar to the one experienced in situ and then used during the experiment) in a flow trough system during two weeks under ambient pH (pHT ~ 8.1). At the end of the acclimation period, skeletons of the organisms were stained by placing the samples for 24 hours in a bath of seawater enriched with calcein at 50 mg l−1 with pH adjusted to 8.1 by addition of NaOH. The stain line was used during the geochemical analyses as a visual indicator to select portion of the skeleton grown under the experi-mental conditions (i.e. section above the stain line).Experimental set-up.
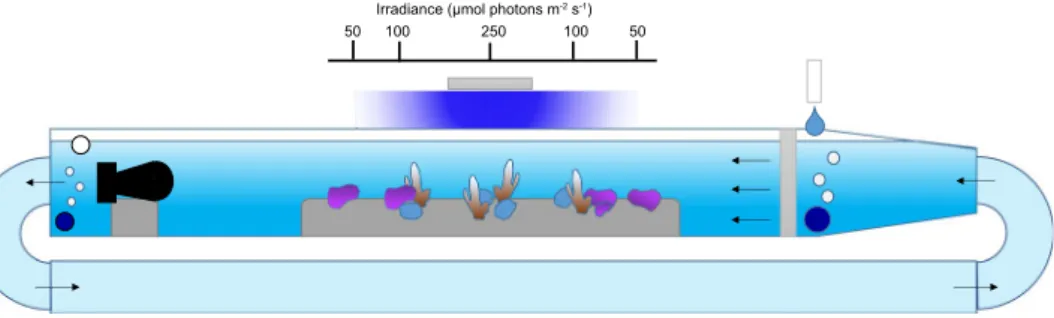
Twelve custom-made flumes were used to maintain the organisms under controlled conditions of flow, temperature, light and pH. The 90 L flumes consisted of a 1.5 m × 0.2 m × 0.2 m working sec-tion. Seawater was circulated at the upstream side of the flume through a 0.3 m long transition chamber mounted with flow straighteners made of stacked PVC pipes (diameter of 1.5 cm) covered by a shade cloth to obtain aunidirectional semi-laminar flow. The return section was made of 0.1 m diameter PVC pipes. The organisms were maintained at two flow velocities of 0.025 m s−1 (Slow Flow) and 0.08 m s−1 (Fast Flow) that were obtained using two types of underwater pumps (D1 and D3 – DC wave maker pumps, Macro Aqua, China). Flow velocities were chosen to remain within ecologically relevant conditions. Flow velocity was determined at ~15 cm depth, where the organisms were placed, and adjusted for each flume using an Acoustic Doppler Velocimeter (Nortek Vectrino, Norway).
The flume experiments were designed to test the interactive effects of two regimes of flow velocities (0.025 and 0.08 m s−1), pH (ambient pH: pH
T = 8.05 and low pH: pHT = 7.65) between flumes, and light levels (Fig. 1). For clarity, in the following sections the ambient pH treatment is described as ‘pH 8.0’ and the low pH treatment as ‘pH 7.6’. Treatments of flow and pH were randomly assigned to obtain three flumes per combination of flow and pH. Light levels were controlled by the relative position of organisms within the flumes. Organisms directly under the light received ~250 µmol quanta m−2 s−1 at midday (High light treatment for corals only), while organisms on the side received either ~100 µmol quanta m−2 s−1 (Low light for corals, High light for CCA) at midday or ~50 µmol quanta m−2 s−1 at midday (Low light for CCA only). The light levels corresponded to light intensities reg-ularly experienced by organisms in Salmon Bay22. Prior experimentation determined that these light conditions were optimal for growing these species in the laboratory23,24. Four corals per species were randomly placed under 250 or 100 µmol quanta m−2 s−1 (n = 2 per light treatments for each flume). Four coralline algae were randomly placed under 100 or 50 µmol quanta m−2 s−1 (n = 2 per light treatments for each flume). With this design, 6 organisms of each species were exposed to each combination of treatments.
Temperature was maintained constant at ~20.5 °C, which is the mean in situ temperature at the collection site25, during the experiment. Light was provided by 150 W LED (Malibu LED, Ledzeal) that followed a diel cycle. Light was gradually ramped-up in the morning, commencing from 6:00 h until 10:00 am to reach maximum intensity, remained at maximum intensity for four hours, and then ramped down until total darkness at 18:00 h. pH was manipulated in the flumes using pH-controllers (AquaController, Neptune systems, USA) that control the bubbling of pure CO2. Ambient air was continuously bubbled in each flume to maintain the O2 and ambient pH constant. The flumes worked as a flow through system with sand-filtered seawater (porosity ~25 µm) delivered continuously at ~0.5 L min−1.
Carbonate chemistry measurement and calculations.
Seawater pH and temperature were measuredevery ~1–2 d in each flume using a pH meter calibrated every 2 d on the total scale using Tris/HCl buffers made following26. Total alkalinity (AT) was measured weekly in all the flumes using an open cell potentiometric method (Mettler Toledo, T50). AT was calculated using a modified Gran function and titrations of certified reference materials (CRM, batch 161) provided by A.G. Dickson lab yielded AT values within 5 μmol kg−1 of the certified value. AT, pHT, temperature, and salinity were used to calculate the carbonate chemistry parameters using the seacarb package running in R.
Physiological measurements.
Calcification was measured over the 27-week experimental duration using the buoyant weight method27. Net calcification was determined on each organism by converting the difference in weight between the beginning and the end of the incubation period to dry weight using an aragonite density of 2.93 g cm−3 (for the corals) and a calcite density (for the CCA) of 2.73 g cm−3. Net calcification was normalized to the surface area determined using the foil method28 for P. versipora and S. durum, and the relationship between skeleton weight and surface area for A. yongei determined by CT scanning.Light short-term incubations were carried out after 2 months of exposure to the treatments to assess the response of photosynthesis and respiration. Incubations were conducted at this time to ensure adequate acclima-tion to the growing condiacclima-tions. Each individual was placed into an incubaacclima-tion chamber filled with seawater orig-inating from its respective flume. Flow and light were manipulated to approximate the respective conditions in the flumes. Organisms were chosen randomly for a total of 4 replicates of each species per treatment combination (96 individuals total) and controls with only flume seawater were run during each incubation. Incubations lasted
250 100 100
50 50
Irradiance (µmol photons m-2 s-1)
Figure 1. Diagram representing the experimental set-up used to maintain the corals and coralline algae for 27 weeks. The organisms were maintained under two flow velocities created by pumps placed at the end (left of the diagram) of the flumes. pH was regulated independently in each flume using a pH controller. Positions of the organisms within the flumes were used to control light levels. Organisms directly under the light received ~250 µmol quanta m−2 s−1 at midday (High light treatment for corals), while organisms on the side received either ~100 µmol quanta m−2 s−1 (Low light for corals, High light for CCA) at midday or ~50 µmol quanta m−2 s−1 at midday (Low light for CCA).
~1.5–2 h and changes in dissolved oxygen (using an A323 dissolved oxygen portable meter, Orion Star, Thermo Scientific, USA) and temperature between the beginning and end of each incubation were determined. All rates were normalized to surface-area of the organisms.
Calcifying fluid pH
cfand Dic
cf.
Calcifying fluid pH (pHcf) for all organisms and DIC (DICcf) for corals was calculated using the δ11B proxy method for pHcf and the δ11B and B/Ca method for DICcf29. Geochemical meas-urements were done on the material representing the average calcium carbonate deposited during the 27 weeks of incubation (as confirmed by calcein staining)23,24. The portions of the skeleton grown under the experimental conditions were sampled using cutting pliers (for A. yongei) or a dental drill (for S. durum and P. versipora).
All powders of selected material were processed in the clean laboratory of the Advanced Geochemical Facility for Indian Ocean Research [AGFIOR, University of Western Australia (UWA)] for dissolution and dilution to 10-ppm Ca solutions. Ten mg of each sample was placed in 6.25% NaClO for 15 mins, rinsed in MilQ water 3 times and then dried for 24 h. Samples were then dissolved in 0.51 N HNO3, and the boron was quantitatively separated on ion exchange columns. δ11B was measured on a multicollector inductively coupled plasma mass spectrometry (NU II). Measurements of the international carbonate standard JCp-1 yielded a mean value of 24.35 ± 0.13‰ (mean ± SE, n = 5), which was similar to the nominal value of 24.33 ± 0.11‰ (SE) reported pre-viously30. Calculations of pH
cf based on δ11B were made using the calculations of31:
= − δ − δ α δ − δ + α − − − pH pK log ( B B ) ( B B 1000 ( 1)) (1) cf B 11 SW 11 carb (B3 B4)11 carb 11 SW (B3 B4)
where pKB is the dissociation constant dependent on temperature and salinity, δ11Bsw = 39.6132, and αB3-B4 is the boron isotopic fractionation factor for the pH dependent equilibrium of the borate (B(OH)4−) relative to the boric acid (B(OH)3) species in the calcifying fluid, with a value of 1.027233.
B/Ca ratios and δ11B measured on the same material was utilized to determine [CO
32−] and then [DIC] at the site of calcification [DIC]cf following29,34. B/Ca ratios were determined on the same aliquot of the solution used for pHcf estimates, and DICcf was calculated from estimates of CO32− using the following equations described in29:
=
− −
[CO ]32 cf K [B(OH) ] /(B/Ca)D 4 cf CaCO3 (2)
Where KD = KD.0 exp(−kKD[H+]T) with = 2.97 ± 0.17 × 10⁻³ (±95% CI), kKD = 0.0202 ± 0.042. The concentration
of DICcf was then calculated from estimates of pHcf and [CO32−]cf using the R package seacarb.
Raman spectroscopy.
We utilized confocal Raman spectroscopy to determine sample mineralogy (arag-onite versus calcite) and as a proxy of calcifying fluid saturation state (Ω). Measurements were conducted on a WITec Alpha300RA + using a 785 nm laser, 1200 mm−1 (~1.3 cm−1 spectral resolution), and a 20x objective with 0.5 numerical aperture following35. The wavenumber was routinely calibrated with a silicon chip (nominal peak at 520.5 cm−1). Topography maps were made with the TrueSurface module for skeleton samples placed on glass slides (powders for corals, and cut sections for CCA). The topography maps were then followed with an auto-mated stage while conducting Raman measurements to ensure the optics remained in focus. For each sample, 100 spectra were collected in a square grid, 300 µm by 300 µm using 1 s integrations for corals and 1 mm by 1 mm using 2 s integrations for CCA. Spectra with poor signal (<100 arbitrary intensity units or signal/noise ratio of ~10) or contaminated by cosmic rays were excluded.Sample mineralogy was evaluated by first confirming each sample is CaCO3 based on the v1 peak at ~1085– 1090 cm−1. Next, each sample was distinguished between aragonite and calcite based on the shape and position of the v4 peak between 700–720 cm−1, where a double peak <710 cm-1 is indicative of aragonite and a single peak >710 cm−1 is indicative of calcite. We found only aragonite in our coral samples and only high-Mg calcite in our CCA samples, confirming the mineralogy expected for each species.
The widths of the v1 peaks were used as proxy measures of calcifying fluid Ω19. We used the abiogenic arag-onite calibration equation of35 to calculate Ωa for the two coral species from the v1 full width at half maximum intensity (FWHM). Although there is no published abiogenic high-Mg calcite Ω calibration, we used the Mg concentration-normalized peak widths as relative indicators of Ω for CCA36,37. The effect of Mg on v1 FWHM was accounted for using the equations of38, where [Mg] is determined from v1 wavenumber, and the residual v1 FWHM is determined for qualitative calcite Ω interpretations
Calcifying fluid Ca
2+ cf.
[Ca2+]cf was calculated as:= Ω + ⁎K − [Ca ]2 cf Ar sp/[CO ]32 cf (3) where [CO ]− 3 2
cf and ΩArag cf are derived from boron systematics and Raman spectroscopy, respectively.
Micro-sensor measurements.
The DBL pH was determined after 16–27 weeks of incubations using aUnisense microprofiling system (Unisense A/S, Denmark). Measurements were made directly in the flumes on the organisms maintained under their respective conditions of light, pH, and flow. pHT of the flumes bulk sea-water was measured following the method described above before each profile determinations. pH in the DBL was measured with a pH-50 microelectrode with a 40–60 μm tip diameter and an external reference electrode (Radiometer analytical). The pH microelectrode was calibrated using NBS buffers every day, and standardised to the total scale based on Tris mV prior to any further measurements.
A Unisense manual micro-manipulator and a hand-held magnifying glass were used to position the sen-sors. For A. yongei, micro pH electrodes were positioned between polyps as close as possible to the surface of the organisms, while for P. versipora the probes were positioned inside the gap made by their large polyps. For S. durum, the sensors were placed as close as possible to the surface in the gap between protuberances. After a 45 min acclimation period, measurements of pH were made every 100 μm above the organisms (50 μm for the first 4 steps) surface up to 1800 μm, with a final measurement at 2800 μm. At each step, measurements were col-lected for 2 min. The difference in pH between the surrounding seawater and the diffusion boundary layer (DBL) were determined on at least three P. versipora and S. durum for each experimental treatment. Measurements on A. yongei were only done on three individuals because it was not possible to detect a consistent change in pH in the DBL. pH in the DBL in the dark was also determined on two P. versipora., two S. durum and one A. yongei. A 2-month period was necessary to perform all the measurements so they could be conducted roughly at the same time of day.
Statistical analyses.
Factorial ANOVA models were used to detect differences in calcification, pho-tosynthesis, pHcf, DICcf, Ca2+cf, Ωcf, and DBL pH for the corals, and calcification, photosynthesis, pHcf, B/Ca, Raman-derived FWHM and DBL pH for S. durum. pH, flow and light were fixed factors in the models, where flume of origin was also included as a random factor. The random factor was dropped from the analyses when it was not significant (p < 0.25). All data conformed to normality and homogeneity of variance. All analyses were done in R. All data will be archived in the Pangaea database.Results
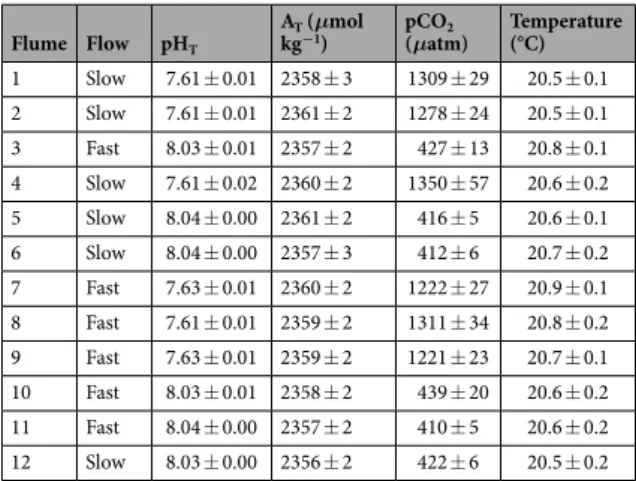
During the 27 weeks of the experiment, carbonate chemistry was successfully maintained constant across the treatments (Table 1). pH was maintained on average at 8.04 ± 0.02 (mean ± SE, n = 384) in the pH 8.0 treatment and 7.62 ± 0.03 (mean ± SE, n = 384) in the pH 7.6 treatments, corresponding to respective pCO2 of 421 ± 26 and 1282 ± 83 μatm. Over the course of the experiment, the nutrient concentrations were: NH4+ = 3.07 ± 2.6 μg l−1 (n = 8), NOx = 0.83 ± 1.42 μg l−1, and PO4 = 6 ± 1.42 μg l−1. No bleaching or mortality of corals as a function of the treatment was found, though 7 CCA experienced mortality (not linked to the treatment) and were subse-quently excluded from further analysis.
Calcification.
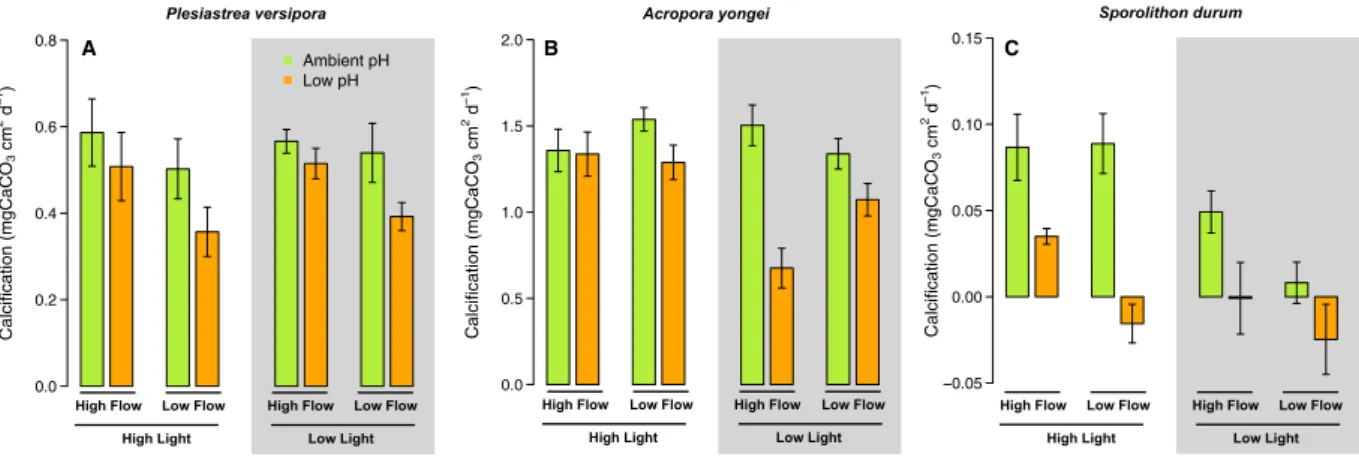
For P. versipora, the highest calcification was found in the pH 8.0 - Fast Flow conditions under High and Low Light, while calcification was the slowest in the pH 7.6, High Light, Slow Flow treatment (Fig. 2A). Calcification was significantly affected by pH (p = 0.011, Table S1), but there was no significant effect of Light (p = 0.675). Flow significantly affected calcification (p = 0.034) that was on average higher at Fast Flow than Slow Flow. There was no significant interactive effect between the tested parameters.For A. yongei, the highest mean net calcification was measured in the pH 8.0 – High Light – Slow Flow treatment and the lowest in the pH 7.6 – Low Light –Fast Flow (Fig. 2B). Net calcification was affected by pH (p < 0.001, Table S1), Light (p = 0.003), and their interaction (p = 0.007) with calcification on average higher at pH 8.0 and High Light compare to pH 7.6 and Low Light. Flow did not impact calcification (p = 0.293), but there was a significant interaction between pH, Light and Flow because the negative effects of flow were larger at Low Light and pH 7.6 (p < 0.016).
Calcification of the CCA S. durum was fastest in the High Light treatment at pH 8.0 (for the Fast and Slow Flow) and negative in the two pH 7.6 - Slow Flow treatments (Fig. 2C). CCA calcification was significantly affected by pH (p < 0.001), Light (p < 0.001), and Flow (p = 0.019). However, there were no statistically signifi-cant interactive effects.
Flume Flow pHT
AT (μmol
kg−1) pCO(μatm)2 Temperature (°C) 1 Slow 7.61 ± 0.01 2358 ± 3 1309 ± 29 20.5 ± 0.1 2 Slow 7.61 ± 0.01 2361 ± 2 1278 ± 24 20.5 ± 0.1 3 Fast 8.03 ± 0.01 2357 ± 2 427 ± 13 20.8 ± 0.1 4 Slow 7.61 ± 0.02 2360 ± 2 1350 ± 57 20.6 ± 0.2 5 Slow 8.04 ± 0.00 2361 ± 2 416 ± 5 20.6 ± 0.1 6 Slow 8.04 ± 0.00 2357 ± 3 412 ± 6 20.7 ± 0.2 7 Fast 7.63 ± 0.01 2360 ± 2 1222 ± 27 20.9 ± 0.1 8 Fast 7.61 ± 0.01 2359 ± 2 1311 ± 34 20.8 ± 0.2 9 Fast 7.63 ± 0.01 2359 ± 2 1221 ± 23 20.7 ± 0.1 10 Fast 8.03 ± 0.01 2358 ± 2 439 ± 20 20.6 ± 0.2 11 Fast 8.04 ± 0.00 2357 ± 2 410 ± 5 20.6 ± 0.2 12 Slow 8.03 ± 0.00 2356 ± 2 422 ± 6 20.5 ± 0.2
Table 1. Mean carbonate chemistry in the flumes during the 27 weeks experiment. pCO2 was calculated using
measured pHT, total alkalinity (AT), temperature and a salinity of 36.3 (SE < 0.1). All values are mean ± SE (n = 64).
Calcifying fluid pH.
For Plesiastrea, the lowest pHcf was found in the pH 7.6 – Low Light – Fast Flow treatment and the highest in the pH 8.0 under High Light at both flows. As a result, there was an effect of pH (p < 0.001, Table S2), Light (p = 0.001), and the interaction between Light and Flow (p ~0.048) (Fig. 3A).For A. yongei, estimates of pHcf were the highest in the pH 8.0 - Fast Flow treatments under both Light condi-tions (Fig. 3B). There was a significant effect of pH (p < 0.001, Table S2) and Flow (p = 0.034) as well as an inter-active effect between Flow and pH (p = 0.017) with pHcf being reduced by slow flow rates under seawater pH 8.0. pHcf of the coralline S. durum ranged from 8.64 (pH 7.6 – Low Light – Slow Flow) to 8.78 (pH 8.0 – High Light – Slow Flow and pH 8.0 – Low Light- Fast Flow). pHcf was only affected by pH (p < 0.001, Table S2) with the lowest values recorded in all the pH 7.6 treatments (Fig. 3C).
Calcifying fluid DIC.
For P. versipora, DICcf was affected by pH (p = 0.001, Table S3) and Light (p = 0.044). The interaction between pH, Light and Flow (p = 0.044) was also significant because the effects of Flow and pH were reversed at Low Light (Fig. 4A). Estimates of DICcf for A. yongei were only affected by pH (p = 0.003, Table S3) with DICcf more elevated on average in the pH 7.6 treatments (Fig. 4B).B/Ca of S. durum, which is expected to be indicative of DICcf, was the highest under the pH 7.6 – Slow Flow conditions and was similar in all the pH 8.0 treatments (Fig. 4C). Flow significantly affected B/Ca (p = 0.039, Table S3) and there was a trend towards a significant interactive effect of Flow and pH (p = 0.063) because B/Ca was more elevated at pH 7.6 only under Slow Flow.
High Flow Low Flow
High Light Low Light High Flow Low Flow Sporolithon durum Calcification (mgCaC O3 cm 2 d 1) 0.05 0.00 0.05 0.10 0.15
High Flow Low Flow
High Light Low Light
High Flow Low Flow High Flow Low Flow
High Light Low Light High Flow Low Flow
Plesiastrea versipora Acropora yongei
Calcification ( mg Ca CO 3 cm 2 d 1) 0.0 0.5 1.0 1.5 2.0 Calcification ( mgCaCO 3 cm 2 d 1) 0.0 0.2 0.4 0.6 0.8 Ambient pH Low pH A B C
Figure 2. Effects of pH, flow and light on the surface-area normalized net calcifcation rates of the corals Plesiastrea versipora and Acropora yongei and the coralline alga Sporolithon durum. Calcification was measured on organisms grown in flumes for 27 weeks. pH was maintained at ambient pH (green bars, pH = 8.1) and low pH (orange bars, pH = 7.65). Seawater velocity was adjusted to high flow (8 cm s−1) and low flow (2.5 cm s−1). Light levels were manipulated within the flumes to high light (250 μmol photon m−2 s−1 for corals and 100 μmol photon m−2 s−1 for the CCA) and low light (100 μmol photon m−2 s−1 for corals and 50 μmol photon m−2 s−1 for the CCA) levels. Values displayed are mean ± SE (n = 6).
Low pH
High Flow Low Flow
High Light Low Light High Flow Low Flow Sporolithon durum pH cf 8.4 8.5 8.6 8.7 8.8 8.9 9.0
High Flow Low Flow
High Light Low Light
pH cf 8.4 8.5 8.6 8.7 8.8 Ambient pH Low pH
High Flow Low Flow High Flow Low Flow
High Light Low Light High Flow Low Flow
Plesiastrea versipora Acropora yongei
pH cf 8.40 8.45 8.50 8.55 8.60 8.65 A B C
Figure 3. Estimates of pH in the calcifying fluid (pHcf) derived from δ11B for the corals Plesiastrea versipora
and Acropora yongei and the coralline alga Sporolithon durum. pHcf was determined at the end of the 27 week incubation period on organisms maintained at ambient pH (green bars, pH = 8.1) and low pH (orange bars, pH = 7.65). Seawater velocity was adjusted to high flow (8 cm s−1) and low flow (2.5 cm s−1). Light levels were manipulated within the flumes to high light (250 μmol photon m−2 s−1 for corals and 100 μmol photon m−2 s−1 for the CCA) and low light (100 μmol photon m−2 s−1 for corals and 50 μmol photon m−2 s−1 for the CCA) levels. Values displayed are mean ± SE (n = 6).
Ω
cfand residual FWHM.
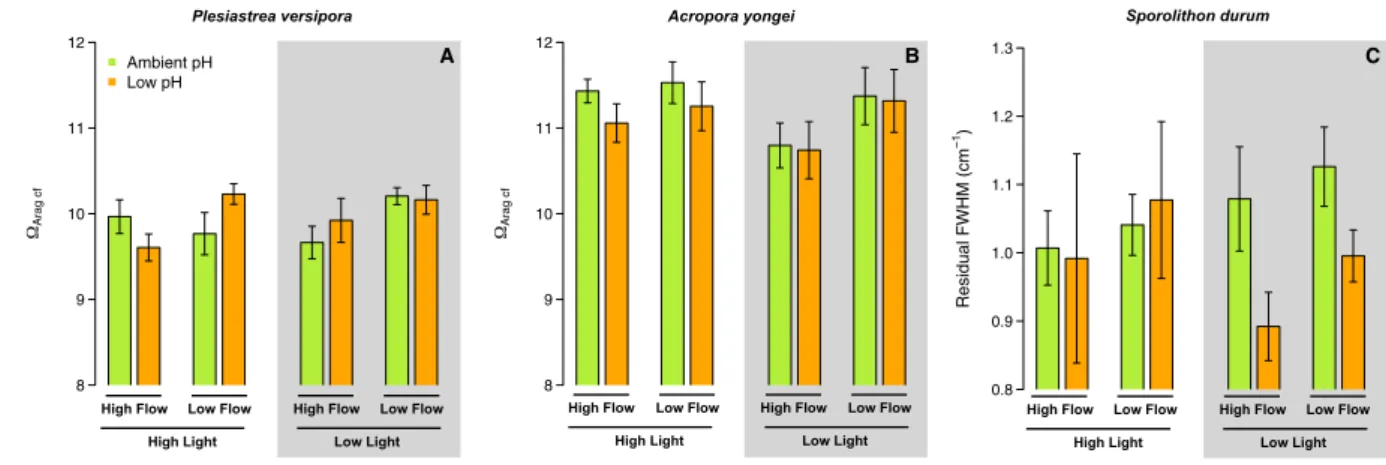
For P. versipora, Ωcf was affected by Flow (p = 0.034, Table S4) because Ωcf was onaverage more elevated under low flow. However, there were no effects of pH and Light on P. versipora Ωcf (Fig. 5A, Table S4). The Ωcf of A. yongei was not significantly affected by any treatment (Fig. 5B).
The treatments did not significantly affect the residual FWHM (indicator of the high-Mg calcite saturation state in the calcifying fluid) of S. durum (Fig. 5C, Table S4).
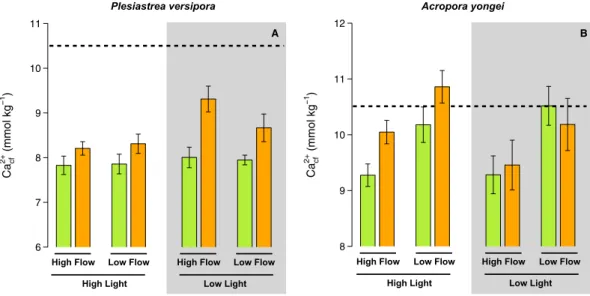
Calcifying fluid Ca
2+.
Ca2+cf in P. versipora was significantly affected by pH (p < 0.001, Table S5) and Light (p = 0.014). Ca2+cf was more elevated under low pH and low light (Fig. 6A). For A. youngei, Ca2+cf was only affected by flow, with the highest values measured under low flow (Fig. 6B).Photosynthetic rates.
Net photosynthetic rates of P. versipora were only affected by Light (p = 0.043), with lower rates recorded in the Low Light treatment. For A. yongei, net photosynthetic rates were only significantly affected by Flow (p = 0.042) because of lower rates under Low Flow (Fig. 7B, Table S6). Net photosynthetic rates of S. durum were not affected by the treatments (Fig. 7C, Table S6).Metabolic alteration of pH in the DBL.
Delta pH (pH values recorded near the organism surface with micro-sensors minus mainstream seawater pH) in the DBL in the light was not successfully measured on A. yon-gei because the changes in pH were too small. The only profile completed in the dark showed a strong decrease of ΔpH in the DBL of 0.7 unit. For, P. versipora, there was a significant effect of pH (p = 0.050, Table S6), Flow (p = 0.002), and their interaction (p = 0.002) on ΔpH. This interactive effect was due to greater ΔpH in the low pH treatments under low flow (Fig. 8A). As a consequence pH in the DBL was similar between pH treatments under low flow (Fig. S1). Light (p < 0.001) and the interaction between Light and pH (p = 0.021) also affected ΔpH. This was caused by higher ΔpH under high light, particularly in the low pH treatment. The two measure-ments of ΔpH in the dark in the pH 8.0 – Fast Flow treatmeasure-ments showed a decrease in pH in the DBL of ~0.6 unit.High Flow Low Flow
High Light Low Light High Flow Low Flow Sporolithon durum B/Ca ( µ mo lm ol 1) 300 350 400 450 500 550
High Flow Low Flow
High Light Low Light
High Flow Low Flow High Flow Low Flow
High Light Low Light High Flow Low Flow
Plesiastrea versipora Acropora yongei
DI Ccf ( µ mol kg 1) 2400 2600 2800 3000 3200 3400 Ambient pH Low pH DI Ccf ( µ mol kg 1) 2800 3000 3200 3400 3600 3800 4000 A B C
Figure 4. Estimates of DIC in the calcifying fluid (DICcf) derived from δ11B and B/Ca for the corals Plesiastrea
versipora and Acropora yongei. B/Ca is used here as a proxy of DICcf for the coralline alga Sporolithon durum. Note that an increase in B/Ca indicates a decrease in DICcf. Values displayed are mean ± SE (n = 6).
High Flow Low Flow
High Light Low Light High Flow Low Flow Sporolithon durum S Residual FWHM (cm 1) 0.8 0.9 1.0 1.1 1.2 1.3
High Flow Low Flow
High Light Low Light
High Flow Low Flow High Flow Low Flow
High Light Low Light High Flow Low Flow
Plesiastrea versipora Acropora yongei
Arag cf 8 9 10 11 12 Arag cf 8 9 10 11 12 Ambient pH Low pH A B C
Figure 5. Estimates of the aragonite saturation state in the calcifying fluid (Ωarag cf) for the corals Plesiastrea
versipora and Acropora yongei. Ωarag cf was estimated using Raman microscopy. Residual FWHM is directly used as a proxy of Ωcalc cf for the coralline alga Sporolithon durum because no empirical relationship between residual FWHM and Ωcalc exist. Values displayed are mean ± SE (n = 6).
For S. durum, only Light had a significant effect on ΔpH in the DBL (p = 0.006), with higher ΔpH in the high light treatments. There was also a trend toward an interaction between pH and Flow (p = 0.061) because ΔpH was higher at pH 8.0 in the Slow Flow conditions. In the dark, ΔpH in the DBL was 0.07 and 0.05 for the two test measurements made on S. durum from the pH 8.0 – Fast Flow treatments.
Discussion
Understanding the role played by different physical parameters is necessary to explain the large range of responses to OA measured in past studies, and to accurately predict how OA will manifest across habitats with differing environmental conditions. We demonstrate here that flow, light, and pH and their interactions are critical factors impacting organisms’ physiology, internal chemistry, and conditions in the DBL. As a result of these complex interactions, calcification responded differently to the treatments in all the tested organisms because of mor-phological and physiological differences. In contrast to our initial hypotheses (1) low flow conditions did not alleviate the negative effects of OA on calcification and (2) the export of protons is likely not the main driver of calcification in all species, because there was not a consistent effect of flow on pHcf. In contrast, our results suggest that mass-transfer limitation of nutrients or night-time dissolution play an important role in the control of net calcification rates.
Low flow does not provide a general refugia from OA.
In the present experiment, low flow did not alleviate the effect of OA for the three species. These results are in contrast to Cornwall et al.5, who showed that low flow conditions ameliorate the negative effect of OA on calcification of the temperate articulate coralline alga Arthrocardia corymbosa. Here, the coralline alga exhibited negative rates of calcification under both irradiances under low flow and low pH conditions. The discrepancy between the two studies can likely be explained by two non-exclusive hypotheses. First, the present study was performed on sub-tropical algae that were grown in low nutrient concentrations similar to undisturbed coral reefs39, while Cornwall et al.5 used temperate algae grown under higher nutrient concentrations. It is therefore likely that under low flow S. durum were nutrient limited, which in turn limited their calcification rates. Nutrient uptake in oligotrophic waters is indeed dependent on flow21 and can have large impacts on calcification rates. Second, it is possible that the increase of pH in the DBL measured here was not sufficient to limit the effect of OA on calcification. Despite a linear relationship between pH in the DBL and calcification in S. durum (Fig. S2), the increase in pH in the DBL was not sufficient to amelio-rate the effect of OA. Here, the relatively low photosynthetic activity of coralline algae in all the treatments and the flow velocities used (minimum of 2.5 cm s−1) can explain the limited increase of pH in the DBL under OA. Furthermore, it is possible that the increase in pH during the day was not sufficient to counteract the lower pH at night in the DBL, and therefore that mean DBL pH was not elevated on average over a 24 hours cycle under slow flow. Unfortunately, pH in the DBL at night was not measured because of logistical and experimental constraints.Our results are partially in agreement with Comeau et al.4 who found that calcification of coral communities is enhanced by faster flow under ambient and OA conditions. Here, this is true for one of the two coral species, as the effects of OA on calcification of P. versipora were ameliorated under high flow. However, this was not true for A. yongei. These species-specific responses were likely driven by different morphologies (branching vs mound-ing) and different physiologies. The mounding physiology of P. versipora, with deep polyps, likely created areas with alternatively low and thick DBL. However, enhanced pH in the DBL during the day was not associated with increased calcification in P. versipora. Calcification was the lowest in the low flow and low pH treatments where the largest DBL ΔpH was measured. This result indicates a control of calcification by either bulk seawater pH
High Flow Low Flow
High Light Low Light
High Flow Low Flow High Flow Low Flow
High Light Low Light
High Flow Low Flow
Plesiastrea versipora Acropora yongei
Ca cf 2+ (mmol kg 1 ) 6 7 8 9 10 11 Ca cf 2+ (mmol kg 1 ) 8 9 10 11 12 A B
Figure 6. Estimates of the calcium concentration in the calcifying fluid (Ca2+cf) for the corals Plesiastrea
versipora and Acropora yongei. Ca2+cf was calculated from estimates of Ωarag cf and estimates of DICcf. Values displayed are mean ± SE (n = 6). The horizontal dashed line shows the approximate [Ca] in seawater during the experiment. Values displayed are mean ± SE (n = 6).
(lower calcification recorded in the low pH treatment), nutrient concentrations (lower nutrient available at low flow) and/or low pH in the DBL at night. The few measurements of pH in the DBL in the dark for P. versipora showed a negative delta pH of similar magnitude to the light ΔpH, which could indicate that the positive effect of higher pH during the day is balanced by the negative effects of lower pH at night under slow flow. However, further studies will be necessary to confirm this observation.
The export of protons is not the main driver of calcification in all species.
Our results demonstrate that the chemistry at the site of calcification is strongly impacted by the physical and chemical conditions in which the organisms are living. The relationship between pHcf and seawater pH is species-specific in corals and CCA24,40,41. This trend was repeated here with the three tested taxa exhibiting different pHcf. For example, mean pHcf in the ambient seawater pH treatments was 8.68, 8.51, and 8.78 for P. versipora, A. yongei, and S. durum respectively. These values are within the range of what has been reported previously using a variety of techniques such as micro-electrodes42, pH-sensitive dye43, and boron isotope proxies44. In addition, the present study also demonstrates that pHcf, and the general chemistry at the site of calcification (DICcf, Ca2+cf, Ωcf), is also modulated by flow and/or light depending on the species. This has important repercussions, as it demonstrates that using pHcf or DICcf as indicators of the seawater chemistry45 can be confounded by other physical parameters. This result also suggests that seasonal variation in pHcf and DICcf29 could be partly driven by seasonal variations in both light and flow, which should now be measured in the future in situ proxy research to improve accuracy of any reconstructions of the physical or chemical environment.High Flow Low Flow
High Light Low Light
High Flow Low Flow Plesiastrea versipora Net photosynthesis ( µ mo lO 2 h 1cm 2) 0 20 40 60 80 100
High Flow Low Flow
High Light Low Light
High Flow Low Flow Acropora youngei Net photosynthesis ( µ mo lO 2 h 1cm 2) 0 20 40 60 80
High Flow Low Flow
High Light Low Light
High Flow Low Flow Sporolithon durum Net photosynthesis ( µ mo lO 2 h 1cm 2) 0 2 4 6 8 10 12 14 Ambient pH Low pH Acropora yongei Net photosynthesis ( µ g O2 h 1cm 2) Net photosynthesis ( µ g O2 h 1cm 2) Net photosynthesis ( µ gO 2 h 1cm 2) A B C
Figure 7. Net Photosynthesis rates determined on the corals P. versipora and A. yongei and the coralline alga S. durum. Net photosynthesis was determined during incubations performed after 2 months in the experimental treatments. Values displayed are mean ± SE (n = 6).
High Flow Low Flow
High Light Low Light
High Flow Low Flow Plesiastrea versipora
High Flow Low Flow
High Light Low Light
High Flow Low Flow Sporolithon durum Ambient pH Low pH pH (pH DBL pH b ulk sea w ater) 0.0 0.2 0.4 0.6 0.8 1.0 1.2 pH (pH DBL pH b ulk sea w ater) 0.0 0.1 0.2 0.3 0.4 0.5 0.6 0.7 A B
Figure 8. Maximal differences in pH between the diffusive boundary layer (DBL) and the bulk seawater in the light for the corals Plesiastrea versipora and the coralline alga Sporolithon durum. Values displayed are mean ± SE (n = 3).
Generally, seawater pH was the main driver of pHcf in the three tested species, while the effects of flow and light were species-specific and subtler. Light had the strongest effects on P. versipora, with pHcf being lower within low light treatments. This could have been driven by generally lower DBL ΔpH under low light for P. versipora. The linear relationship between DBL ΔpH and pHcf for P. versipora and S. durum (Fig. S3) suggests that the eleva-tion of pH at the surface of the organisms can slightly modify pHcf and favour the export of protons from the site of calcification by reducing the proton gradient between the calcifying fluid and the mainstream seawater. This indicates that pH near the surface of the organism could be more important than bulk seawater pH in influenc-ing pHcf, particularly for mounding species. However, this is not found in all the corals, as it was not possible to link pHcf and DBL ΔpH in A. yongei, because DBL ΔpH was nearly impossible to measure (i.e. close to 0) here, something which has been recently repeated with another Acropora species46. We also did not find any direct rela-tionships between calcification and pHcf for the two corals (Fig. S4). This is in agreement with our previous work that showed that pHcf does not always drive calcification23,37,47. For S. durum, there was also no linear relationship between pHcf and calcification but calcification and pHcf were the lowest in the low pH treatments.
Chemistry in the calcifying fluid.
[Ca2+]cf of P. versipora increased at lower seawater pH, though it remained lower than seawater [Ca2+], as found previously in Pocillopora damicornis48. This could be one of the mechanisms used by this species to maintain elevated Ωcf and calcification under low pH. A. youngei [Ca2+]cf also showed similar patterns to that observed previously in this species, as [Ca2+]cf was not affected by seawater pH48. In contrast, the higher [Ca2+]cf of A. youngei under low flow conditions were not correlated with higher calci-fication rates. Together with previous observations42, this collectively demonstrates that [Ca2+]cf is both driven by environmental parameters and is highly species-specific. Nevertheless, [Ca2+]cf and [CO32−]cf were linearly correlated in both species (Fig. S5), demonstrating that increasing [Ca2+]cf can be used by both species as a com-pensatory mechanism in response to declining [CO32−]cf.There were strong species-specific effects of the experimental conditions on DICcf. The few studies that have investigated DICcf have assumed that DICcf was driven by photosynthesis, seawater pH, or seawater DIC29,47,49,50. Here we also show that flow and light can have complex effects on DICcf and that these effects are pH dependent. The relationship between B/Ca and the employed treatments for the coralline alga was also complex. Under high flow, B/Ca was lower (DICcf higher) at low seawater pH, which is similar to the effects of seawater pH on corals51. However, here the opposite was found for S. durum at low flow, demonstrating that seawater carbonate chemistry is not the only driver of CCA DICcf. This lower B/Ca could be the result of the very low consumption of DIC by calcification in the low flow, low pH treatments where the lowest rates of calcification were measured.
The overall lack of an effect of the treatment on Ωarag cf or FWHM while calcification varied between treat-ments is indicative of three processes. First, Ωarag cf and FWHM represents the chemical condition in the calcifying fluid when the precipitation of calcium carbonate occurred. Here, our results show that corals and CCA need to reach a certain species-specific threshold Ωarag cf (or FWHM) to initiate the precipitation process (i.e., Ωarag cf ~ 11 for A. yongei and ~10 for P. versipora, FWHM ~ 1.0 for S. durum), regardless of the external conditions of flow, light and pH. Second, Ωarag cf (or FWHM) does not provide information on the bulk rate of calcification (i.e. the instantaneous precipitation rate integrated over time and surface area). Finally, the discrepancy between Ωarag cf (or FWHM) and calcification could be the sign that dissolution in some treatments played a role, as this would decrease calcification without affecting the chemistry at the site of calcification during calcification.
Conclusion
The present study shows that light, flow, and pH have complex species-specific effects on corals and coralline algae. Slow flow conditions did not provide refugia from ocean acidification, and in contrast it had no effect or negative effects on calcification. Nor did elevated seawater velocity show clear evidence of increased proton export. Here we clearly demonstrate the role of flow is context and species-specific. This highlights the necessity of assessing hypotheses regarding how climate change will manifest across multiple species under a variety of envi-ronmental conditions, while at the same time evaluating the physiological effects of these parameters. Further, the strong effects of irradiance and flow on the carbonate chemistry within the calcifying fluid confirm the difficulties associated with using skeletal proxies to estimate environmental and physiological conditions23,45,51. Therefore, caution must be applied to assuming constant offsets of these parameters from seawater carbonate chemistry across different sites, even within the same species. Most importantly however, we demonstrate here that the effects of ocean acidification will manifest differently between habitats with differences in light and seawater velocity. These differences are complex, difficult to predict based on existing hypotheses regarding the impacts of seawater velocity, and are species-specific. This indicates the need for more targeted research that further assesses the impacts of seawater velocity; based on our findings further work should couple similar research with assess-ment of dissolution and/or manipulations of nutrient concentrations.
References
1. Hoegh-Guldberg, O. et al. Coral Reefs Under Rapid Climate Change and Ocean Acidification. Science 318, 1737–1742 (2007). 2. Anthony, K. R. N., Diaz-Pulido, G., Verlinden, N., Tilbrook, B. & Andersson, A. J. Benthic buffers and boosters of ocean acidification
on coral reefs. Biogeosciences 10, 4897–4909 (2013).
3. Evensen, N. R. & Edmunds, P. J. Interactive effects of ocean acidification and neighboring corals on the growth of Pocillopora. Mar.
Biol. 163, 1–11 (2016).
4. Comeau, S., Edmunds, P. J., Lantz, C. A. & Carpenter, R. C. Water flow modulates the response of coral reef communities to ocean acidification. Sci. Rep. 4, 6681 (2014).
5. Cornwall, C. E. et al. Diffusion Boundary Layers Ameliorate the Negative Effects of Ocean Acidification on the Temperate Coralline Macroalga Arthrocardia corymbosa. Plos One 9, e97235 (2014).
6. Vogel, S. Life in moving fluids. (Princeton University Press, 1994).
8. Nishihara, G. N. & Ackerman, J. D. On the determination of mass transfer in a concentration boundary layer. Limnol. Oceanogr.
Methods 5, 88–96 (2009).
9. Cornwall, C. E., Hepburn, C. D., Pilditch, C. A. & Hurd, C. L. Concentration boundary layers around complex assemblages of macroalgae: Implications for the effects of ocean acidification on understory coralline algae. Limnol. Oceanogr. 58, 121–130 (2013). 10. Hofmann, L. C., Koch, M. & Beer, Dde Biotic Control of Surface pH and Evidence of Light-Induced H+ Pumping and Ca2+-H+
Exchange in a Tropical Crustose Coralline Alga. Plos One 11, e0159057 (2016).
11. Atkinson, M. J. & Bilger, R. W. Effects of water velocity on phosphate uptake in coral reef-hat communities. Limnol. Oceanogr. 37, 273–279 (1992).
12. Cornelisen, C. D. et al. Patterns in the δ13C and δ15N signature of Ulva pertusa: Interaction between physical gradients and nutrient
source pools. Limnol. Oceanogr. 52, 820–832 (2007).
13. Jokiel, P. L. Ocean Acidification and Control of Reef Coral Calcification by Boundary Layer Limitation of Proton Flux. Bull. Mar. Sci.
87, 639–657 (2011).
14. Hurd, C. L. & Pilditch, C. A. Flow-Induced Morphological Variations Affect Diffusion Boundary-Layer Thickness of Macrocystis
pyrifera (heterokontophyta, Laminariales)1. J. Phycol. 47, 341–351 (2011).
15. Larkum, A. W. D., Koch, E.-M. W. & Kühl, M. Diffusive boundary layers and photosynthesis of the epilithic algal community of coral reefs. Mar. Biol. 142, 1073–1082 (2003).
16. Hurd, C. L. Slow-flow habitats as refugia for coastal calcifiers from ocean acidification. J. Phycol. 51, 599–605 (2015).
17. Comeau, S. & Cornwall, C. E. Contrasting Effects of Ocean Acidification on Coral Reef “Animal Forests” Versus Seaweed “Kelp Forests”. In Marine Animal Forests 1–25, https://doi.org/10.1007/978-3-319-17001-5_29-1 (Springer, Cham, 2016).
18. Chalker, B. E., Barnes, D. J., Dunlap, W. C. & Jokiel, P. L. Light and Reef-Building Corals. Interdiscip. Sci. Rev. 13, 222–237 (1988). 19. Chisholm, J. R. M. Calcification by crustose coralline algae on the northern Great Barrier Reef, Australia. Limnol. Oceanogr. 45,
1476–1484 (2000).
20. Zweng, R. C., Koch, M. S. & Bowes, G. The role of irradiance and C-use strategies in tropical macroalgae photosynthetic response to ocean acidification. Sci. Rep. 8, 9479 (2018).
21. Atkinson, M. J., Kotler, E. & Newton, P. Effects of Water Velocity on Respiration, Calcification, and Ammonium Uptake of a Porites
compressa Community (1994).
22. Ross, C. L., Falter, J. L., Schoepf, V. & McCulloch, M. T. Perennial growth of hermatypic corals at Rottnest Island, Western Australia (32°S). PeerJ 3, e781 (2015).
23. Comeau, S., Cornwall, C. E. & McCulloch, M. T. Decoupling between the response of coral calcifying fluid pH and calcification to ocean acidification. Sci. Rep. 7, 7573 (2017).
24. Cornwall, C. E., Comeau, S. & McCulloch, M. T. Coralline algae elevate pH at the site of calcification under ocean acidification. Glob.
Change Biol. 23, 4245–4256 (2017).
25. Ross, C. L., Falter, J. L. & McCulloch, M. T. Active modulation of the calcifying fluid carbonate chemistry (δ11B, B/Ca) and seasonally
invariant coral calcification at sub-tropical limits. Sci. Rep. 7, 13830 (2017).
26. Dickson, A. G., Sabine, C. L. & Christian, J. R. Guide to best practices for Ocean CO2 measurements. 3 (2007).
27. Davies, P. S. Short-term growth measurements of corals using an accurate buoyant weighing technique. Mar. Biol. 101, 389–395 (1989).
28. Marsh, J. A. Primary Productivity of Reef-Building Calcareous Red Algae. Ecology 51, 255–263 (1970).
29. McCulloch, M. T., D’Olivo, J. P., Falter, J., Holcomb, M. & Trotter, J. A. Coral calcification in a changing World and the interactive dynamics of pH and DIC upregulation. Nat. Commun. 8, 15686 (2017).
30. Foster, G. L. et al. Interlaboratory comparison of boron isotope analyses of boric acid, seawater and marine CaCO3 by MC-ICPMS
and NTIMS. Chem. Geol. 358, 1–14 (2013).
31. Trotter, J. et al. Quantifying the pH ‘vital effect’ in the temperate zooxanthellate coral Cladocora caespitosa: Validation of the boron seawater pH proxy. Earth Planet. Sci. Lett. 303, 163–173 (2011).
32. Foster, G. L., Pogge von Strandmann, P. A. E. & Rae, J. W. B. Boron and magnesium isotopic composition of seawater. Geochem.
Geophys. Geosystems 11, Q08015 (2010).
33. Klochko, K., Kaufman, A. J., Yao, W., Byrne, R. H. & Tossell, J. A. Experimental measurement of boron isotope fractionation in seawater. Earth Planet. Sci. Lett. 248, 276–285 (2006).
34. Holcomb, M., DeCarlo, T. M., Gaetani, G. A. & McCulloch, M. Factors affecting B/Ca ratios in synthetic aragonite. Chem. Geol. 437, 67–76 (2016).
35. DeCarlo, T. M. et al. Coral calcifying fluid aragonite saturation states derived from Raman spectroscopy. Biogeosciences 14, 5253–5269 (2017).
36. Comeau, S., Cornwall, C. E., Carlo, T. M. D., Krieger, E. & McCulloch, M. T. Similar controls on calcification under ocean acidification across unrelated coral reef taxa. Glob. Change Biol. 0 (2018).
37. Cornwall, C. E. et al. Resistance of corals and coralline algae to ocean acidification: physiological control of calcification under natural pH variability. Proc R Soc B 285, 20181168 (2018).
38. Perrin, J. et al. Raman characterization of synthetic magnesian calcites. Am. Mineral. 101, 2525–2538 (2016).
39. Szmant, A. M. Nutrient enrichment on coral reefs: Is it a major cause of coral reef decline? Estuaries 25, 743–766 (2002). 40. McCulloch, M., Falter, J., Trotter, J. & Montagna, P. Coral resilience to ocean acidification and global warming through pH
up-regulation. Nat. Clim. Change 2, 623–627 (2012).
41. Cai, W.-J. et al. Microelectrode characterization of coral daytime interior pH and carbonate chemistry. Nat. Commun. 7, 11144 (2016). 42. Al-Horani, F. A., Al-Moghrabi, S. M. & Beer, Dde The mechanism of calcification and its relation to photosynthesis and respiration
in the scleractinian coral Galaxea fascicularis. Mar. Biol. 142, 419–426 (2003).
43. Venn, A. A. et al. Impact of seawater acidification on pH at the tissue–skeleton interface and calcification in reef corals. Proc. Natl.
Acad. Sci. 110, 1634–1639 (2013).
44. Holcomb, M. et al. Coral calcifying fluid pH dictates response to ocean acidification. Sci. Rep. 4, 5207 (2014).
45. D’Olivo, J. P., McCulloch, M. T., Eggins, S. M. & Trotter, J. Coral records of reef-water pH across the central Great Barrier Reef, Australia: assessing the influence of river runoff on inshore reefs. Biogeosciences 12, 1223–1236 (2015).
46. Schoepf, V. et al. Impacts of coral bleaching on pH and oxygen gradients across the coral concentration boundary layer: a microsensor study. Coral Reefs. 37, 1169–1180 (2018).
47. Comeau, S., Cornwall, C. E., DeCarlo, T. M., Krieger, E. & McCulloch, M. T. Similar controls on calcification under ocean acidification across unrelated coral reef taxa. Glob. Change Biol. 24, 4857–4868
48. DeCarlo, T. M., Comeau, S., Cornwall, C. E. & McCulloch, M. T. Coral resistance to ocean acidification linked to increased calcium at the site of calcification. Proc R Soc B 285, 20180564 (2018).
49. Allison, N. et al. Corals concentrate dissolved inorganic carbon to facilitate calcification. Nat. Commun. 5, 5741 (2014).
50. Allison, N. et al. The effect of ocean acidification on tropical coral calcification: Insights from calcification fluid DIC chemistry.
Chem. Geol. 497, 162–169 (2018).
51. Schoepf, V., Jury, C. P., Toonen, R. J. & McCulloch, M. T. Coral calcification mechanisms facilitate adaptive responses to ocean acidification. Proc R Soc B 284, 20172117 (2017).
Acknowledgements
A.-M. Nisumaa-Comeau and J.-P. D’Olivo provided vital laboratory support. M.T.M. was supported by an ARC Laureate Fellowship (LF120100049), S.C. was supported by an ARC DECRA (DE160100668). The authors acknowledge the facilities, and the scientific and technical assistance of the Australian Microscopy & Microanalysis Research Facility at the Centre for Microscopy, Characterisation & Analysis, The University of Western Australia, together with access to the newly established Watermans Facility, facilities funded by the University, State and Commonwealth Governments.
Author Contributions
S.C., C.E.C. and M.T.M. designed the research. S.C. and C.E.C. wrote the paper. All co-authors edited the paper. S.C., C.E.C., C.P., A.C. and R.T. ran the experiment. S.C., C.E.C. and T.M.D. performed geochemical and statistical analysis.
Additional Information
Supplementary information accompanies this paper at https://doi.org/10.1038/s41598-019-49044-w.
Competing Interests: The authors declare no competing interests.
Publisher’s note: Springer Nature remains neutral with regard to jurisdictional claims in published maps and institutional affiliations.
Open Access This article is licensed under a Creative Commons Attribution 4.0 International License, which permits use, sharing, adaptation, distribution and reproduction in any medium or format, as long as you give appropriate credit to the original author(s) and the source, provide a link to the Cre-ative Commons license, and indicate if changes were made. The images or other third party material in this article are included in the article’s Creative Commons license, unless indicated otherwise in a credit line to the material. If material is not included in the article’s Creative Commons license and your intended use is not per-mitted by statutory regulation or exceeds the perper-mitted use, you will need to obtain permission directly from the copyright holder. To view a copy of this license, visit http://creativecommons.org/licenses/by/4.0/.