HAL Id: lirmm-01362397
https://hal-lirmm.ccsd.cnrs.fr/lirmm-01362397
Submitted on 8 Sep 2016
HAL is a multi-disciplinary open access
archive for the deposit and dissemination of
sci-entific research documents, whether they are
pub-lished or not. The documents may come from
teaching and research institutions in France or
abroad, or from public or private research centers.
L’archive ouverte pluridisciplinaire HAL, est
destinée au dépôt et à la diffusion de documents
scientifiques de niveau recherche, publiés ou non,
émanant des établissements d’enseignement et de
recherche français ou étrangers, des laboratoires
publics ou privés.
Exploiting Social and Mobility Patterns for Friendship
Prediction in Location-Based Social Networks
Jorge Valverde-Rebaza, Mathieu Roche, Pascal Poncelet, Alneu De, Andrade
Lopes
To cite this version:
Jorge Valverde-Rebaza, Mathieu Roche, Pascal Poncelet, Alneu De, Andrade Lopes. Exploiting Social
and Mobility Patterns for Friendship Prediction in Location-Based Social Networks. ICPR:
Interna-tional Conference on Pattern Recognition, Dec 2016, Cancun, Mexico. �lirmm-01362397�
Exploiting Social and Mobility Patterns for
Friendship Prediction in Location-Based Social
Networks
Jorge Valverde-Rebaza
ICMC
Univ. of São Paulo, Brazil [email protected]
Mathieu Roche
TETIS & LIRMM Cirad, Montpellier, France
Pascal Poncelet
LIRMM
Univ. of Montpellier, France [email protected]
Alneu de Andrade Lopes
ICMC
Univ. of São Paulo, Brazil [email protected]
Abstract—Link prediction is a “hot topic” in network analysis and has been largely used for friendship recommendation in social networks. With the increased use of location-based services, it is possible to improve the accuracy of link prediction methods by using the mobility of users. The majority of the link prediction methods focus on the importance of location for their visitors, disregarding the strength of relationships existing between these visitors. We, therefore, propose three new methods for friendship prediction by combining, efficiently, social and mobility patterns of users in location-based social networks (LBSNs). Experiments conducted on real-world datasets demonstrate that our proposals achieve a competitive performance with methods from the liter-ature and, in most of the cases, outperform them. Moreover, our proposals use less computational resources by reducing considerably the number of irrelevant predictions, making the link prediction task more efficient and applicable for real world applications.
Index Terms—Link prediction, Location-based social networks, Friendship prediction, Mobility patterns, User behavior.
I. INTRODUCTION
Online social networking sites are web platforms that pro-vide different services to facilitate the connection of individ-uals with similar interests and behaviors [1]. Online social networks that provide location-based services for users to check-in in a physical place are called as Location-Based Social Networks (LBSNs). This new kind of complex network characterized by its heterogeneity, consists of at least two types of nodes (users and locations), and three kinds of links (user-user, location-location, and user-location) [2].
Recently, LBSNs have attracted million of users because, in addition to the possibility to establish new friendships, they can also share their locations with friends as well as sending messages, tips or other information related to visited
places [2], [3]. The main example of LBSN is Foursquare1,
which involves more than 45 million users, more than 65 million places, and more than 8 billion check-ins. Due to these service properties, users can access and share information about friends and places within their social graph. The user-location link is mutually reinforced by its actors, making it possible to take advantage of geographic mobility as an
1https://foursquare.com
additional information source of information to analyze user behavior [4]–[6].
Link prediction addresses the issue of predicting the ex-istence of future links between disconnected nodes and has become a “hot topic” in recent years [1], [7]. We call friend-ship prediction the task that consists of predicting social links (i.e. user-user links) in a social network. Intuitively, the more similar the users are, the more likely they will be friends [1], [5], [8]. Therefore, one of the first challenges in link prediction is to establish the patterns that can be used to characterize properly these similarities [4], [8].
Several methods have been proposed to cope with this challenge. Most of them assign a score to quantify the sim-ilarity between pairs of users by using a simsim-ilarity measure [7], [8]. Therefore, various user behavior patterns have been identified and used to improve the accuracy of friendship prediction methods, highlighting among them those based on topological or social patterns [8]–[10], communities or social groups patterns [1], [11]–[13], and mobility patterns [3], [4], [6], [14]–[17].
A common characteristic of the friendship prediction meth-ods, is that they use individual user behavior pattern separately [8], [9], [3], [6]. Although there are methods that efficiently combine neighborhood and social groups patterns [11], [12], to the best of our knowledge there is no method combining patterns on both mobility and other kind of user behaviors.
Another important challenge faced by link prediction is the prediction space size. The prediction space of a link prediction method is constituted of the “universe” of pairs of users with potential to establish relationships. This universe is formed by a small amount of pairs of users that really will connect and a huge amount of pairs of users that will never establish a connection. The extremely skewed distribution of classes of pairs of users in the prediction space impairs on the performance of friendship prediction methods [3]. Therefore, the prediction space challenge consists in not only reducing the number of irrelevant predicted links but also increasing the number of correctly predicted links.
In the context of LBSNs, the challenge is how to exploit efficiently the information given by the geographic mobility
and social neighborhood patterns of two users, who do not have a connection but who have visited the same places, to predict if they will become friends. Therefore, in this paper we propose three new friendship prediction methods exploring both social and mobility patterns and combining them efficiently. Our experiments have been conducted with data from well-known LBSNs, Gowalla and Brightkite. We propose to compare the performance, in terms of accuracy and prediction space size, of our proposals with other techniques described in the literature, considering both unsupervised and supervised contexts.
The remainder of this paper is organized as follows. In Section II, we describe the notation to be used and different properties of LBSNs. In Section III, we present formally the link prediction issue and some methods from literature. In Section IV, we present and explain our proposals. In Section V, we detail our experimental results. Finally, in Section VI, the main contributions of this work are summarized.
II. LOCATION-BASEDSOCIALNETWORKS
In this section the main properties of LBSNs are described focusing on the mobility behavior of users.
A. Notation
Formally, given a network G(V, E, L), where V is the set of nodes representing the users, E is the set of edges representing the social links among users, and L is the set of different locations visited by all the users. The size of each set is represented by |V |, |E|, and |L|, respectively. Multiple links and self-connections are not allowed.
Locations play an important role in the establishment of new relationships because users visiting the same places demon-strate similar mobility behavior [6]. This behavior can be analyzed when the time and geographic information about the location visited are record. This event is called a check-in [2], [3]. User check-ins provide an ideal environment to understand human behavior through the analysis of geographical and social ties [5].
We use the Location Data Record (LDR) to represent a check-in made by a user. A LDR is defined by a tuple ✓ = (x, t, `), where x 2 V , t is the check-in time, and ` 2 L. The set of all LDRs in G is defined as , and the size of this set, | |, defines the total number of check-ins [3], [14].
B. Properties
The social, movement, and temporal properties of LBSNs have been studied by several researchers [5], [6], [18]. They have used different names and notation to define the same network properties.
Considering a user x 2 V and a location ` 2 L, and based on the LDR notation, we define the main LBSNs properties as follows: i) Check-ins of a user x, defined as
(x) = {(x, t, `) | 8x 2 V ^ (x, t, `) 2 }; ii)
Check-ins at a location `, defined as (`) = {(x, t, `) | 8` 2
L ^ (x, t, `) 2 }; iii) Locations visited by a user x, defined
as L(x) = {` | (x, t, `) 2 (x)}; iv) Check-ins of a user
xat a location `, defined as (x, `) = {(x, t, `) | (x, t, `) 2
(x) ^ ` 2 L(x)}; and, v) Visitors of a location `, defined
as V(`) ={x | (x, t, `) 2 (x) ^ ` 2 L(x)}.
Another property very useful to quantify the strength of relationship of a location and its visitors is the place entropy,
which is defined as E`= Px2 V(`)
| (x,`)| | (`)| log(
| (x,`)| | (`)| )[3].
Locations with higher place entropy might result in less social links among their visitors than those with lower values.
III. LINKPREDICTIONPROBLEM
In this section we describe formally the link prediction issue and its associated evaluation measures. Also, we describe some representative methods from the literature.
A. Problem Description
The link prediction problem aims at predicting, among all possible pairs of nodes that have not established any connec-tion in the past, those that will have a future associaconnec-tion. This association can be a friendship between two users in a social network [8], [1], [6], [14]. In machine learning field, the link prediction problem can be instanced into both unsupervised and supervised strategies.
1) Unsupervised Link Prediction: Originally proposed in [8] and widely used in the literature [1], [6], [7], [11], [19]. Consider as a potential link any pair of users (x, y) such that (x, y) /2 E. The universal set, U, is the set containing all the potential links between pair of nodes in V . A missing link is any potential link in the set of nonexistent links U E. Thus, the fundamental link prediction task into the unsupervised context is to find out the missing links in the set of nonexistent links, scoring each link in this set. A predicted link is any potential link that has received a score, higher than zero, by any link prediction method. The higher the score, the higher the connection probability, and vice versa [1], [6], [8], [7].
2) Supervised Link Prediction: Link prediction is an unsu-pervised learning problem, but it is possible to consider it as a supervised one. For that, network information such as the user behavior patterns are used to build a set of features vectors for both linked and not linked pairs of nodes. After, any classifier can be used to learn a model from this set of feature vectors and determine the class label of new instances [9], [10], [14]. B. Evaluation Measures
To quantify the performance of any link prediction method in unsupervised context it is necessary to investigate the adequacy of some standard evaluation measures. Assuming we know the set of future new connections that truly will appear
between pair of nodes, E0, where E0⇢ U E. We call as a
new link any missing link in E0. In addition, we consider as
true positive (T P ) all predicted link that also is a new link, as false positive (F P ) all predicted link that is not a new link, and as false negative (F N) all new link that is not a predicted link.
Therefore, evaluation measures as the precision, defined
as precision = T P
T P +F P, and recall, defined as recall = T P
harmonic mean, the F-measure, defined as F -measure = 2 ⇥ precisionprecision + recall⇥ recall [20]. Most of the researches in link prediction put more emphasis on precision due to that they focus on obtain a high number of correct predictions, even at the price of a non negligible number of false negatives [6]. In our work, we consider both precision and recall, as well as the F-measure.
However, in the unsupervised link prediction context, these measures do not give a clear judgment of the quality of predictions. For example, a correctly predicted link could not be considered as a true positive if it has a lower score than a threshold. Considering this fact, two standard evaluation measures are used, AUC and precisi@n [7].
For n independent comparisons among predicted links, if
n0 times for the links correctly predicted are given higher
scores than for links wrongly predicted whilst n00 times for
both correctly and wrongly predicted links are given equal
scores, the AUC is defined as AUC = n0+0.5n00
n . Different
from AUC, precisi@L only focuses on the L links with highest scores. Thus, precisi@L is defined as the ratio between the
Lr correctly predicted links from the L top-ranked links, i.e.
precisi@L = Lr
L.
By using the supervised link prediction it is possible to use different validation techniques, such as k-fold cross-validation. Also, we can use the traditional evaluation measures, such as accuracy, precision, recall, F-measure, AUC, and others, to compare the classifier performance [10], [12].
C. Methods
The main focus of our work is to explore the predictive power of mobility compared and combined with social pat-terns, we therefore selected some of the more representative methods which have been performed reasonably well in pre-vious studies.
1) Social Methods: They constitute the state-of-the-art of link prediction methods and are based on exploring the user-user links. Considering that the basic definition for a user-user x 2
V is its set of neighbors, defined as (x) = {y | (x, y) 2
E _ (y, x) 2 E}. The size of this set, | (x)|, is called as user degree. The average of user degree of all users in G, is called as average degree, hki. Also, for a pair of disconnected users
x and y, its set of common neighbors is defined as ⇤x,y =
(x)\ (y).
Based on these definitions, different social methods have been proposed [7], [8], and, in this paper, we will consider five of the most used in the literature: i) Common Neighbors (CN),
defined as sCN
x,y = |⇤x,y|, which refers to the size of set of
common neighbors of two users x and y, ii) Jaccard (Jac), de-fined as sJac
x,y =|⇤x,y|/| (x)[ (y)|, which indicates whether
two users have a significant number of common neighbors regarding their total neighbors, iii) Adamic-Adar (AA), defined
as sAA
x,y =
P
z2⇤x,y1/ log(| (z)|), which refines the simple
counting of common neighbors by assigning more weight to the less-connected neighbors, iv) Resource Allocation (RA),
defined as sRA
x,y = Pz2⇤x,y1/| (z)|, and, v) Preferential
Attachment (PA), defined as sP A
x,y =| (x)| ⇥ | (y)|.
2) Location Methods: Users visiting the same places show similar preferences with respect to trips or walks around a geographical area. When the frequency of these visits is high in a period of time, these users may have many chances to be in contact with each other and, therefore, to establish new relationships between them [5], [6], [15].
Different methods aiming to explore the mobility patterns to quantify the similarity of two users have been proposed [3], [4], [6], [13], [14], [17]. Let the set of common visited places of a pair of disconnected users x and y, which is defined
as L(x, y) = L(x)\ L(y), in this paper we consider
five of the most used location methods in the literature: i) Collocations (Co), which refers to the count of common check-ins made at a specific time period, it is defined as sCo
x,y = | (x) \ (y)|; ii) Preferential Attachment of Places
(PAP), defined as the product of the number of different visited places, i.e. sP AP
x,y =| L(x)|⇥| L(y)|; iii) Common Locations
(CL), which expresses the number of common places visited,
it is defined as sCL
x,y = | L(x, y)|; iv) Jaccard of Places
(JacP), based on traditional Jac measure, it is defined as sJacP
x,y = | L(x, y)|/| L(x)[ L(y)|; and, v) Adamic-Adar
of Entropy (AAE), it apply the traditional AA measure for the common visited places, but using the place entropy, i.e.
sAAE
x,y =
P
`2 L(x,y)= 1/ log(E`).
IV. PROPOSALS
We will examine to the strength of the relationships that exist among visitors of a place, and will consider previ-ous studies that combined social patterns with social groups or communities patterns [11]–[13]. We propose three new methods combining social and mobility patterns. They are referred to as Within and Outside of Common Places, Common Neighbors of Places, and Total and Partial Overlapping of Places, and defined as follows.
A. Within and Outside of Common Places (WOCP)
We redefine the set of common neighbors of a pair of users as ⇤x,y = ⇤W CPx,y [ ⇤OCPx,y , where ⇤W CPx,y = {z 2
⇤x,y | L(x, y)\ L(z)} is the set of common neighbors
within common visited places, and ⇤OCP
x,y = ⇤x,y ⇤W CPx,y , is
the set of common neighbors outside common visited places. From these sets, we define WOCP as:
sW OCP x,y = |⇤W CP x,y | |⇤OCP x,y | (1) WOCP measures the relation between common friends visiting common and different places. Therefore, two users are more likely to establish a friendship if they have more common friends visiting the same places visited by them than if have more common friends visiting distinct places.
B. Common Neighbors of Places (CNP)
We define the set of common neighbors of places as ⇤L
x,y =
{z 2 ⇤x,y | L(x)\ L(z)6= ? _ L(y)\ L(z)6= ?}.
The size of this set defines the CNP as stated in Eq. 2.
CNP indicates that a pair of users x and y more likely have a future friendship if have more common friends visiting places also visited by x or y.
C. Total and Partial Overlapping of Places (TPOP)
We redefine the set of common neighbors of places as ⇤Lx,y = ⇤T OPx,y [ ⇤P OPx,y , where ⇤T OPx,y ={z 2 ⇤Lx,y | L(x)\
L(z) 6= ? ^ L(y)\ L(z) 6= ?} is the set of common
neighbors with total overlapping of places, and ⇤P OP
x,y =
⇤L
x,y ⇤T OPx,y is the set of common neighbors with partial
overlapping of places. Thus, we define the TPOP as: sT P OPx,y = |⇤T OP x,y | |⇤P OP x,y | (3) TPOP indicates that two user x and y could establish a friendship if they have more common friends visiting places also visited by both x and y, than places visited only by x or only by y.
V. EXPERIMENTS
To evaluate the performance of our proposals, in this sec-tion, we report the results of experimental evaluation carried out using two real-world datasets: Brightkite and Gowalla. A. Datasets description
Brightkite and Gowalla are two discontinued LBSNs in which users made check-ins to report visits to specific physical locations. For our experiments, we have used public datasets
collected from April 2008 to October 2010, for Brightkite2,
and from February 2009 to October 2010, for Gowalla3.
Brightkite has 58, 228 users and 214, 078 links, and an average degree of hki = 7.35. Approximately, 85% of users made at least one check-in in some of the 772, 788 distinct locations. Therefore, with a total of 4, 491, 144 check-ins registered in all the network, we find out that, in average, each user made at least 88 check-ins, and visited at least 5 different locations.
Similarly, Gowalla has 196, 591 users and 950, 327 links, and an average degree of hki = 9.66. A little more than 54% of users made at least one check-in in some of the 1, 280, 969 distinct locations. A total of 6442892 check-ins are registered, so, in average, each user made at least 60 check-ins, and visited at least 5 different locations.
B. Experimental setup
For a network G, the set E is divided into a training set, ET, and a probe set, EP. For Brightkite, links formed by users
who made check-ins from April 2008 to January 2010 are used to construct the training set, whilst links formed by users who made check-ins from February 2010 to October 2010 are used to the probe set. For Gowalla, the training set is constructed with links formed by users made check-ins from February 2009 to April 2010, and the probe set is constructed with
2http://snap.stanford.edu/data/loc-brightkite.html 3http://snap.stanford.edu/data/loc-gowalla.html
links formed by users’ check-ins from May 2010 to October 2010.
For links formed by users’ check-ins in both training and probe periods, we selected randomly two-third of them for training set and the remaining for probe set. Moreover, links formed by users with a degree lesser than the average degree or by users with lesser than two check-ins, are not considered neither for training nor for probe sets.
After that, the link prediction process begins in both un-supervised and un-supervised contexts. In unun-supervised context, the connection likelihood is calculated for each pair of
discon-nected nodes that are two hops away and are in ET. In
super-vised context, we use decision tree (J48), naïve Bayes (NB), multilayer perceptron with backpropagation (MLP), support vector machine (SMO), Bagging (Bag), and Random Forest
(RF) classifiers from Weka4. For each network, we compute a
set of features vectors formed by randomly selected pairs of disconnected nodes. For each pair taken, we compute different link prediction methods and consider the scores obtained from each one as the respective features of vector representing that link. If a pair of nodes is in EP, then the respective feature
vector takes the positive class (existent link), otherwise takes the negative class (nonexistent link). Thus, for Brightkite we select a total of 20, 000 links, from which 5, 000 represent the positive class and 15, 000 the negative one, and for Gowalla we select a total of 48, 000 links, being 12, 000 of them of positive class and the remaining 36, 000 of negative one.
For each network, we created seven different datasets formed by features vectors constituted by scores calculated from different link prediction methods: i) VSocial, formed by social methods: CN, AA, Jac, RA, and PA; ii) VLocations, formed by locations methods from literature: CCo, PAP, DCo, JacP, and AAP; iii) VProposals, formed by our proposals: WOCP, CNP, and TPOP; iv) VSocial-Locations, formed by the junction of VSocial and VLocation; v) VSocial-Proposals, formed by the junction of VSocial and VProposals; vi) VLocations-Proposals, formed by the junction of VLocations and VProposals; and, vii) VTotal, formed by the junction of VSocial, VLocations, and VProposals.
C. Experiment results
To validate the performance of our proposals, we carried out experiments in both unsupervised and supervised contexts. For both cases we have applied the appropriate evaluation measures on five social methods, five location methods, and our three proposals.
1) Unsupervised results: For the two LBSNs analyzed, Table I summarizes different performance results for each eval-uated method. Each value in this table is obtained by averaging over 10 run over 10 independent partitions of training and probe sets. Values emphasized in bold correspond to the best results achieved for each evaluation measure: Precision, Recall and F-measure, calculated considering the total of predicted links of each link prediction method, and AUC, calculated considering n = 5000.
Table I
PERFORMANCE COMPARISON OF DIFFERENT METHODS FOR INFERRING
SOCIAL LINKS ON UNSUPERVISED DOMAIN.
Method Precision Recall F-measure AUC Precision Recall F-measure AUC CN Brightkite 0.143E-6 0.496 0.287E-6 0.814 Go w alla 0.128E-6 0.300 0.256E-6 0.732 Jac 0.138E-6 0.484 0.276E-6 0.706 0.128E-6 0.298 0.256E-6 0.354 AA 0.145E-6 0.498 0.290E-6 0.853 0.128E-6 0.299 0.256E-6 0.883 RA 0.145E-6 0.498 0.290E-6 0.842 0.128E-6 0.299 0.256E-6 0.881 PA 0.141E-6 0.493 0.282E-6 0.675 0.128E-6 0.298 0.256E-6 0.781 Co 0.030 0.205 0.052 0.658 0.685E-6 0.143 0.137E-5 0.618 PAP 0.142E-6 0.494 0.285E-6 0.797 0.126E-6 0.292 0.251E-6 0.483 CL 0.039 0.286 0.069 0.715 0.682E-6 0.142 0.136E-5 0.609 JacP 0.033 0.293 0.060 0.486 0.684E-6 0.142 0.137E-5 0.681 AAE 0.142E-6 0.494 0.284E-6 0.363 0.125E-6 0.292 0.251E-6 0.351 WOCP 0.055 0.209 0.087 0.547 0.092 0.081 0.086 0.533 CNP 0.246E-6 0.427 0.492E-6 0.777 0.333E-6 0.215 0.667E-6 0.687 TPOP 0.040 0.291 0.070 0.651 0.062 0.128 0.084 0.585
In Table I, compared with traditional social and location methods, the precision of our proposals outperform most of them. With regard to recall, social methods outperform both traditional location methods and our proposals. This indicates that, social methods reach a considerably number of correctly predicted links but in the other hand they calculate a larger number of wrong predictions. Our proposals calculate a lower number of correctly predicted links but a much smaller number of wrongly predicted links. This skewed distribution is the reason of low values obtained for Precision, Recall and F-measure. Figure 1 shows the total number of predicted links of all evaluated methods as an indicator of prediction space size occupied by each method and its relevance for practical implementations. G1 G2 G3 105 107 109 1011 1013 # of new links Number of predicted links correctly wrongly (a) G1 G2 G3 105 107 109 1011 1013 # of new links Number of predicted links correctly wrongly (b)
Figure 1. Number of correctly and wrongly predicted links for social (G1),
location (G2), and proposed (G3) methods for (a) Brightkite, and (b) Gowalla.
The dashed horizontal line indicates the number of truly new links (links into the probe set). Results averaged over the 10 analyzed partitions.
Because some link prediction methods show high perfor-mance in Precision and others in Recall, we use the F-measure to investigate the predictive power of all evaluated methods. We observe that our proposals, except CNP, outperform all the other methods under F-measure. Thus, we can asseverate that, under a quantitative analysis performed considering all the predicted links, our proposals have a better performance than other evaluated methods.
When analyzing qualitatively the results, from Table I, we observe that social methods outperform all other evaluated methods, including our proposals, under AUC. Since there is no consensus in both quantitative and qualitative performance of methods, we apply the Friedman and Nemenyi post-hoc tests [21] on the average rank of F-measure and AUC results of Table I to determine which are the methods with best overall performance.
The critical value of the F-statistics with 12 and 36 degrees of freedom and at 95 percentile is 2.03. Hence, according to the Friedman test using the F-statistics, the null-hypothesis that all algorithms behave similarly should not be rejected. Figure 2(a) presents the Nemenyi test results, where the critical difference (CD) value for comparing the mean-ranking of two different methods at 95 percentile is 9.12, as showed on the top of the diagram. In the axis of the diagram are showed all the evaluated methods. The lowest (best) ranks are in the left side of the axis. Nemenyi post-hoc test results show that all the evaluated methods have no significant difference, so they are connected by a bold line. The names of our proposals are highlighted in bold. CD 1 2 3 4 5 6 7 8 9 10 11 12 13 AA RA CNP CN WOCP TPOP AAE Jac PAP JacP Co CL PA (a) CD 1 2 3 4 5 6 7 VTotal VSocial-Proposals VSocial-Locations VLocations VProposals VLocations-Proposals VSocial (b)
Figure 2. Nemenyi post-hoc test diagrams obtained from (a) unsupervised and (b) supervised experiment results showed in Tables I and II, respectively.
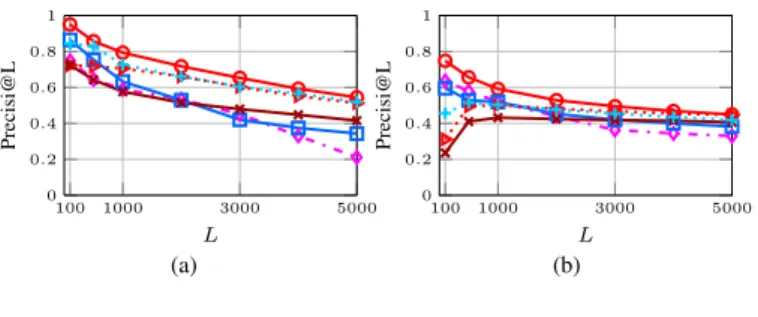
From Figure 2(a), we observe that three of social methods, AA, RA, and CN, and our proposals, CNP, WOCP, and TPOP, are positioned in the top five, i.e. these methods have the best overall performance. Although CNP is third, and WOCP and TPOP are tied in the fifth, they proved to be as competitive as the best social methods and to have a better performance than all traditional location methods evaluated. However, for recommending to users some links as possible new relationships, we can just select the links with the highest scores. Figure 3 shows the precisi@L results only for the top five methods. Different values of L are used. Most of the methods reach their maximum performance for L = 100 with a declining performance after this L value, further, one of our proposals, CNP, outperforms all the methods evaluated in all
L values in both LBSNs analyzed.
100 1000 3000 5000 0 0.2 0.4 0.6 0.8 1 L Precisi@L (a) 100 1000 3000 5000 0 0.2 0.4 0.6 0.8 1 L Precisi@L (b) WOCP CNP TPOP AA RA CN
Figure 3. Precisi@L performance of the top five methods considering different Lvalues for (a) Brightkite, and (b) Gowalla.
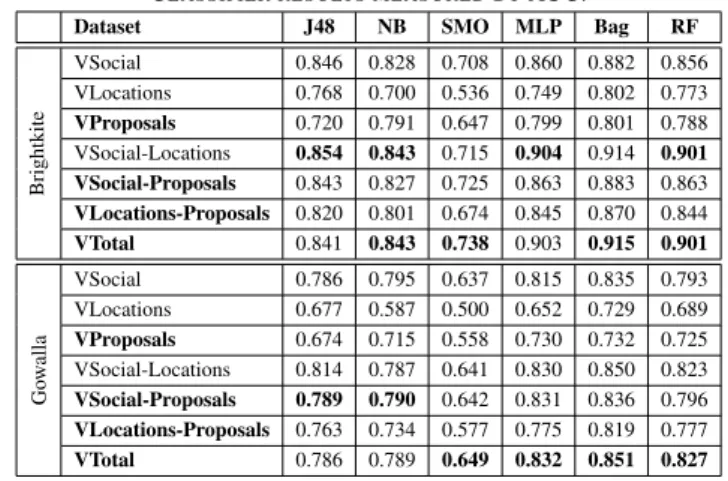
2) Supervised results: Due to the presence of an imbal-anced class distribution in the datasets, we have employed the AUC to analyze the results of supervised link prediction process. The average values for AUC considering a 10-fold cross validation process for the classifiers used are shown in
Table II. Values emphasized in bold correspond to the highest results among the evaluated data sets for each classifier.
In order to observe the impact of the combination of different link prediction methods to make friendship pre-diction under a supervised context, we considered that the performance of each classifier obtained in each dataset is due to the contribution of the features that constitutes such dataset [11], [12]. Thus, from Table II we observe that in most cases the best AUC is obtained by VTotal, but in some cases VSocial-Locations and VSocial-Proposals achieve the best performance. Also, in any network analyzed neither VLocations nor VProposals were able to overcome VSocial, but VProposals clearly outperforms VLocations.
Table II
CLASSIFIER RESULTS MEASURED BYAUC.
Dataset J48 NB SMO MLP Bag RF
Brightkite VSocial 0.846 0.828 0.708 0.860 0.882 0.856 VLocations 0.768 0.700 0.536 0.749 0.802 0.773 VProposals 0.720 0.791 0.647 0.799 0.801 0.788 VSocial-Locations 0.854 0.843 0.715 0.904 0.914 0.901 VSocial-Proposals 0.843 0.827 0.725 0.863 0.883 0.863 VLocations-Proposals 0.820 0.801 0.674 0.845 0.870 0.844 VTotal 0.841 0.843 0.738 0.903 0.915 0.901 Go w alla VSocial 0.786 0.795 0.637 0.815 0.835 0.793 VLocations 0.677 0.587 0.500 0.652 0.729 0.689 VProposals 0.674 0.715 0.558 0.730 0.732 0.725 VSocial-Locations 0.814 0.787 0.641 0.830 0.850 0.823 VSocial-Proposals 0.789 0.790 0.642 0.831 0.836 0.796 VLocations-Proposals 0.763 0.734 0.577 0.775 0.819 0.777 VTotal 0.786 0.789 0.649 0.832 0.851 0.827
To analyze the overall performance of all combinations of link prediction methods, we also applied the Friedman and Nemenyi post-hoc tests. The critical value of the F-statistics with 6 and 30 degrees of freedom and at 95 percentile is 2.42, so, according to the Friedman test, the null-hypothesis that all combinations of link prediction methods perform similarly should be rejected. Figure 2(b) shows the Nemenyi post-hoc test diagram for all data sets of the two LBSNs analyzed. The CD value calculated at 95 percentile is 3.68. Combination of methods that have no significant difference are connected by a bold line in the diagram. The names of combinations considering our proposals are highlighted in bold.
From Figure 2(b) we observe: first, there is a significant difference between VTotal and VSocial-Proposals with VLo-cations and VProposals. Second, the combination of all link prediction methods works better than any other, so VTotal is better ranked followed by Proposals and VSocial-Locations, i.e. the combination of methods based on social patterns with methods based on mobility behaviors is conve-nient, especially when considering our proposals.
Supplementary material related to the experiments, such as figures and source code, is available at http://goo.gl/jhfSav.
VI. CONCLUSION
In this paper, we proposed three new link prediction meth-ods for friendship prediction in location-based social networks. Our proposals consider that a pair of disconnected users are
more likely to become friends if they have many common friends visiting the same places, so they combine social and mobility patterns to improve the link prediction accuracy. Our experimental results on two real datasets showed the prediction power of our proposals individually and combined with other methods. The future directions of our work will focus on location prediction, which will be used to recommend places that users could visit.
ACKNOWLEDGMENTS
This research was partially supported by grants 2015/14228-9, 2013/12191-5, and 2011/22749-8 from FAPESP and 302645/2015-2 from CNPq and CAPES.
REFERENCES
[1] J. Valverde-Rebaza and A. Lopes, “Exploiting behaviors of communities of Twitter users for link prediction,” SNAM, vol. 3, pp. 1063–1074, 2013. [2] Y. Zheng, Computing with Spatial Trajectories. Springer New York,
2011, ch. 8.
[3] S. Scellato, A. Noulas, and C. Mascolo, “Exploiting place features in link prediction on location-based social networks,” in ACM KDD, 2011, pp. 1046–1054.
[4] H. Luo, B. Guo, Z. W. Yu, Z. Wang, and Y. Feng, “Friendship prediction based on the fusion of topology and geographical features in lbsn,” in HPCC-EUC. IEEE, 2013, pp. 2224–2230.
[5] E. Cho, S. A. Myers, and J. Leskovec, “Friendship and mobility: User movement in location-based social networks,” in ACM KDD, 2011, pp. 1082–1090.
[6] D. Wang, D. Pedreschi, C. Song, F. Giannotti, and A.-L. Barabasi, “Human mobility, social ties, and link prediction,” in ACM KDD, 2011, pp. 1100–1108.
[7] L. Lü and T. Zhou, “Link prediction in complex networks: A survey,” Physica A, vol. 390, no. 6, pp. 1150 – 1170, 2011.
[8] D. Liben-Nowell and J. Kleinberg, “The link-prediction problem for social networks,” JASIST, vol. 58, no. 7, pp. 1019–1031, 2007. [9] R. N. Lichtenwalter, J. T. Lussier, and N. V. Chawla, “New perspectives
and methods in link prediction,” in ACM KDD, 2010, pp. 243–252. [10] M. A. Hasan, V. Chaoji, S. Salem, and M. Zaki, “Link prediction
using supervised learning,” in SDM ’06 Workshop on Link Analysis, Counterterrorism and Security, 2006.
[11] J. Valverde-Rebaza and A. Lopes, “Link prediction in online social networks using group information,” in ICCSA, 2014, pp. 31–45. [12] J. Valverde-Rebaza, A. Valejo, L. Berton, T. Faleiros, and A. Lopes, “A
naïve bayes model based on overlapping groups for link prediction in online social networks,” in ACM SAC, 2015, pp. 1136–1141. [13] A. E. Bayrak and F. Polat, “Contextual feature analysis to improve link
prediction for location based social networks,” in SNAKDD’14. ACM, 2014, pp. 7:1–7:5.
[14] O. Mengshoel, R. Desail, A. Chen, and B. Tran, “Will we connect again? machine learning for link prediction in mobile social networks,” in ACM workshop on Mining and Learning with Graphs, 2013.
[15] J. Bao, Y. Zheng, D. Wilkie, and M. Mokbel, “Recommendations in location-based social networks: A survey,” Geoinformatica, vol. 19, no. 3, pp. 525–565, Jul. 2015.
[16] Y. Zhang and J. Pang, “Distance and friendship: A distance-based model for link prediction in social networks,” in APWeb’15. Springer International Publishing, 2015, pp. 55–66.
[17] G. Xu-Rui, W. Li, and W. Wei-Li, “Using multi-features to recommend friends on location-based social networks,” Peer-to-Peer Networking and Applications, pp. 1–8, 2016.
[18] M. Allamanis, S. Scellato, and C. Mascolo, “Evolution of a location-based online social network: Analysis and models,” in ACM IMC, 2012, pp. 145–158.
[19] J. Zhang, X. Kong, and P. S. Yu, “Transferring heterogeneous links across location-based social networks,” in WSDM, 2014, pp. 303–312. [20] M. Fatourechi, R. K. Ward, S. G. Mason, J. Huggins, A. Schlogl,
and G. E. Birch, “Comparison of evaluation metrics in classification applications with imbalanced datasets,” in ICMLA, 2008, pp. 777–782. [21] J. Demšar, “Statistical comparisons of classifiers over multiple data sets,”