HAL Id: hal-00301761
https://hal.archives-ouvertes.fr/hal-00301761
Submitted on 9 Sep 2005HAL is a multi-disciplinary open access
archive for the deposit and dissemination of sci-entific research documents, whether they are pub-lished or not. The documents may come from teaching and research institutions in France or abroad, or from public or private research centers.
L’archive ouverte pluridisciplinaire HAL, est destinée au dépôt et à la diffusion de documents scientifiques de niveau recherche, publiés ou non, émanant des établissements d’enseignement et de recherche français ou étrangers, des laboratoires publics ou privés.
Measurements of CO2, its stable isotopes, O2/N2, and
222Rn at Bern, Switzerland
P. Sturm, M. Leuenberger, F. L. Valentino, B. Lehmann, B. Ihly
To cite this version:
P. Sturm, M. Leuenberger, F. L. Valentino, B. Lehmann, B. Ihly. Measurements of CO2, its stable isotopes, O2/N2, and 222Rn at Bern, Switzerland. Atmospheric Chemistry and Physics Discussions, European Geosciences Union, 2005, 5 (5), pp.8473-8506. �hal-00301761�
ACPD
5, 8473–8506, 2005 CO2 and associated tracers at Bern P. Sturm et al. Title Page Abstract Introduction Conclusions References Tables Figures J I J I Back Close Full Screen / EscPrint Version Interactive Discussion
EGU Atmos. Chem. Phys. Discuss., 5, 8473–8506, 2005
www.atmos-chem-phys.org/acpd/5/8473/ SRef-ID: 1680-7375/acpd/2005-5-8473 European Geosciences Union
Atmospheric Chemistry and Physics Discussions
Measurements of CO
2
, its stable isotopes,
O
2
/N
2
, and
222
Rn at Bern, Switzerland
P. Sturm, M. Leuenberger, F. L. Valentino, B. Lehmann, and B. Ihly
Climate and Environmental Physics, Physics Institute, University of Bern, Bern, Switzerland Received: 20 May 2005 – Accepted: 1 July 2005 – Published: 9 September 2005
Correspondence to: M. Leuenberger ([email protected]) © 2005 Author(s). This work is licensed under a Creative Commons License.
ACPD
5, 8473–8506, 2005 CO2 and associated tracers at Bern P. Sturm et al. Title Page Abstract Introduction Conclusions References Tables Figures J I J I Back Close Full Screen / EscPrint Version Interactive Discussion
EGU
Abstract
A one-year time series of continuous atmospheric CO2 measurements from Bern, Switzerland is presented. O2/N2and Ar/N2ratios as well as stable carbon and oxygen isotopes of CO2 and δ29N2, δ34O2 and δ36Ar were measured periodically in a con-tinuous way during a one year period. Additionally, the 222Rn activity was measured 5
during three months in the winter 2004. Using the correlation from short term fluctua-tions of CO2and222Rn we estimated a mean CO2flux density between February 2004 and April 2004 in the region of Bern of 95±39 tC km−2month−1. The continuous ob-servations of carbon dioxide and associated tracers shed light on diurnal and seasonal patterns of the carbon cycle in an urban atmosphere. There is considerable variance in 10
nighttime δ13C and δ18O of source CO2throughout the year, however, with generally lower values in winter compared to summertime. The O2:CO2 oxidation ratio during the nighttime build-up of CO2 varies between −0.96 and −1.69 mol O2/mol CO2. Fur-thermore, Ar/N2 measurements showed that artifacts like thermal fractionation at the air intake are relevant for high precision measurements of atmospheric O2.
15
1. Introduction
We present continuous records of atmospheric CO2and associated tracers measured in the city of Bern, Switzerland. At this urban site, anthropogenic CO2emissions (e.g., car exhausts, heating) mix with the background and biogenic CO2components, which are influenced by circulation, photosynthesis and respiration. Local sources and sinks 20
in the catchment area of Bern and changing meteorological conditions are expected to lead to large short-term variations of the observed tracers. In order to be able to interpret and apportion these observations high-resolution measurements of multiple tracers are needed.
Stable carbon and oxygen isotopes in atmospheric CO2can be used to measure the 25
ACPD
5, 8473–8506, 2005 CO2 and associated tracers at Bern P. Sturm et al. Title Page Abstract Introduction Conclusions References Tables Figures J I J I Back Close Full Screen / EscPrint Version Interactive Discussion
EGU cycle. Photosynthetic uptake of CO2, plant and soil respiration, and fossil fuel burning
lead to carbon and oxygen isotope signals of atmospheric CO2, which can be used as a tracer at various temporal and spatial scales (Friedli et al.,1987;Keeling et al.,1989; Ciais et al.,1997a). Hesterberg(1990) has measured δ13C and δ18O of CO2 in Bern during a one-year period in 1988/89. His measurements of flask samples collected 5
twice a week showed seasonal differences in the δ13C and δ18O signals (Fig.1). Another approach involves measuring changes of the atmospheric oxygen (O2) con-centration. O2and CO2are inversely coupled by photosynthesis, respiration and com-bustion. However, the different processes have different O2:CO2exchange ratios and thus can be distinguished from each other. The high precision of O2 measurements 10
that is necessary to constrain such carbon fluxes, has given new insights into gas handling procedures and fractionation effects (Bender et al.,1994;Keeling et al.,1998; Langenfelds,2002). Though continuous on-line measurements circumvent any storage related effects as observed in some flask sampling programs (Sturm et al.,2004), they are still susceptible to diffusive fractionation processes. Fractionation of O2/N2 at the 15
intake as well as at tees have first been observed byManning(2001) and have been at-tributed to molecular thermal diffusion. Yet, the exact cause of the fractionation and the points at which it can occur in the flow path of air are still not well established. Molecular thermal diffusion results from temperature gradients. Heavier molecules generally ac-cumulate in the colder region hence leading to concentration changes (Severinghaus 20
et al.,1996;Chapman and Cowling,1970).
Radon-222 is a radioactive noble gas with a half-life T1/2of 3.82 days. It is produced in all soils as part of the natural uranium-radium α-decay series and it emanates into the soil air and diffuses to the atmosphere where it is diluted by atmospheric transport and radioactive decay. The 222Rn flux from ocean surfaces is about two orders of 25
magnitude smaller than from continents (Wilkening and Clements, 1975). Because 222
Rn emissions from soils turned out to be rather homogeneous in a restricted region and relatively constant in time,222Rn is a useful tracer to parameterize transport and dilution in the atmospheric boundary layer.
ACPD
5, 8473–8506, 2005 CO2 and associated tracers at Bern P. Sturm et al. Title Page Abstract Introduction Conclusions References Tables Figures J I J I Back Close Full Screen / EscPrint Version Interactive Discussion
EGU This paper first summarizes sampling and analysis techniques and reports on tests
we have performed to assess fractionation effects at the air intake. Results for CO2, its stable isotopes, O2/N2 and 222Rn over roughly a one-year period are described and possible mechanisms for these observations are discussed.
2. Sampling and analysis techniques
5
2.1. Sampling site
The city of Bern (about 127 000 inhabitants) is situated on the Swiss Plateau. The measurements were made at the Physics Institute, University of Bern (PIUB), which is located on the eastern edge and about 20 m above the city center. The building is surrounded by residential and urban areas. The air is collected from the roof of the 10
building (46◦5700400N, 7◦2602000E, 575 m a.s.l.) about 15 m above local ground. Mete-orological measurements were made by the Institute for Applied Physics, University of Bern. The weather station is located at the same height about 10 m away from the air intake. The sample air is sucked through a ∼40 m long 6 mm outer diameter Dekabon tube into our laboratory. We use a diaphragm pump (KNF Neuberger, Switzerland, 15
N86KNDC with EPDM diaphragm). The flow rate is between 100 and 300 mL min−1 depending on which instruments are connected to the air stream. The air is dried cryo-genically at −70◦C. The total volume of the cold trap (about 250 mL) restricts the time resolution of the measurements to about 2 min.
2.2. CO2mixing ratio 20
The CO2 mixing ratio was measured by non-dispersive infrared adsorption (NDIR) technique. In the beginning the CO2 measurements were performed by a S710 UNOR CO2 analyzer (SICK MAIHACK GmbH, Germany). From March 2004 a LI-7000 CO2/H2O analyzer (LI-COR, USA), was used. The flow rate of the sample gas
ACPD
5, 8473–8506, 2005 CO2 and associated tracers at Bern P. Sturm et al. Title Page Abstract Introduction Conclusions References Tables Figures J I J I Back Close Full Screen / EscPrint Version Interactive Discussion
EGU is about 100 mL min−1 and every minute the mean CO2 mixing ratio is recorded. The
CO2data are reported on the WMO CO2 mole fraction scale. Primary standards from NOAA/CCGG, Boulder, CO, USA, are used to calibrate the working and secondary standards. However, the CO2mixing ratio of these primary standards lies in the range of 192 to 363 ppm. The calibration of our CO2scale above 363 ppm is therefore based 5
on extrapolation. Still, the accuracy of the CO2 data is estimated to be better than ±0.5 ppm for mixing ratios below 400 ppm and better than ±1 ppm for 400 to 450 ppm.
2.3. δ13C and δ18O of CO2
The carbon and oxygen isotopes of CO2 were determined by a combined Gas Chromatography Mass Spectrometric technology (GC/MS) in a semi-continuous way. 10
Every 12 min an air parcel of about 0.5 mL STP was cryogenically trapped in a glass capillary. The small air amount is then released into a low helium stream (1 mL min−1). This gas stream is additionally split into three similar fluxes entering capillaries of dif-ferent lengths. A multi-port valve handles the flow path such that the three gas portions are injected one after another via an open split device to an isotope ratio mass spec-15
trometer (DELTAplusXL, Thermo Electron, Bremen, Germany), where the m/z ratios 45/44 and 46/44 of the CO2are measured (Leuenberger et al.,2003). The precision of this method estimated by the pooled standard deviations of the triplicate measure-ments is about ±0.08‰ for δ13C and P ±0.12‰ for δ18O. Constant N2O corrections of −0.23‰ and −0.35‰ are applied to the δ13C and δ18O data, respectively. Varia-20
tions in the N2O/CO2 concentration ratio of the sample air would lead to varying N2O corrections, but such effects are expected to be small compared to the measurement precision. Carbon and oxygen isotopic compositions are expressed on VPDB-CO2 scale.
δ18O measurements from flask sampling often face additional experimental prob-25
lems, due to the risk of isotopic exchange of CO2with water, that may occur anywhere in the sample treatment from the moment of sampling until the input of the sample in
ACPD
5, 8473–8506, 2005 CO2 and associated tracers at Bern P. Sturm et al. Title Page Abstract Introduction Conclusions References Tables Figures J I J I Back Close Full Screen / EscPrint Version Interactive Discussion
EGU the mass spectrometer (Gemery et al.,1996). For example, isotope exchange during
flask storage of CO2with water, that permeates through the flask seals (Sturm et al., 2004), interferes with any real atmospheric signal. Our flask measurements of δ18O from Jungfraujoch, Puy de D ˆome and Griffin (Sturm et al.,2005b,a) are therefore be-lieved not to represent the true isotopic composition of atmospheric CO2. Therefore 5
the advantage of the continuous analysis method used here, apart from the high time resolution, is that such storage related effects can largely be circumvent.
2.4. Elemental and isotopic ratios of air
The elemental ratios O2/N2 and δAr/N2 as well as the isotopic ratios δ29N2, δ34O2 and δ36Ar are analyzed by an isotope ratio mass spectrometer (DELTAplusXP, Thermo 10
Electron, Bremen, Germany) and expressed in the δ-notation as per meg deviation from our local PIUB reference gas. A glass capillary at a tee takes about 0.2 mL min−1 of the flow to the gas inlet system (Leuenberger et al.,2000;Sturm,2001) of the IRMS. One measurement comprises eight standard/sample cycles and takes about 12 min. Hence one data point represents a mean concentration of the last 12 min.
15
2.5. 222Rn activity
The specific222Rn activity is measured by an alpha-decay detector (Alphaguard 2000 Pro, Genitron Instruments, Frankfurt, Germany). The instrument was placed on the roof of the PIUB building, about 10 m next to the air intake. Using digital signal process-ing for pulse shape analysis the detection limit of the detector in a 10 min measurprocess-ing 20
ACPD
5, 8473–8506, 2005 CO2 and associated tracers at Bern P. Sturm et al. Title Page Abstract Introduction Conclusions References Tables Figures J I J I Back Close Full Screen / EscPrint Version Interactive Discussion
EGU
3. Results and discussion
3.1. Temperature dependent fractionation at the air intake
The Ar/N2 ratio can be measured simultaneously with O2/N2 and is a useful tracer to reveal fractionation effects. Only the temperature dependence of the gas solubil-ity in seawater leads to seasonal variations in air-sea fluxes and small changes in 5
atmospheric Ar/N2 ratio (Keeling et al.,2004). On diurnal timescales, however, the atmospheric Ar/N2 ratio is expected to be constant, because no biogeochemical pro-cesses influence these inert gases. However, our Ar/N2measurements revealed large variability. Diurnal variations of δAr/N2and outdoor temperature are shown as an ex-ample in Fig.2. The outdoor temperature was measured by a HOBO H8 data logger 10
(Onset Computer Corporation, MA, USA) placed at the bottom of the intake pole. The air intake is a Dekabon tube with 4 mm inner diameter (ID) and the flow rate was about 250 mL min−1. The higher the air temperature is, the lower the δAr/N2gets.
To assess the causes of the observed δAr/N2 variations and to better quantify this effect, we conducted tests with different intake tubes and sampling flows. In addition 15
to the Dekabon tube with flow rates of 250 mL min−1 and 35 mL min−1, also a stain-less steel tube with 0.8 mm ID and a flow rate of 155 mL min−1 was used. The cor-relation of δAr/N2 and outdoor temperature for different types of air intakes is shown in Fig. 3. Remarkably, the temperature records lag the δAr/N2 variations by 90 to 150 min. This is probably due to a slow response of the temperature logger used 20
for these tests and the fact that the temperature sensor was not exposed to sun-light in contrast to the air intake. This time shift was applied in the calculations of Fig. 3 to obtain the best correlation. The temperature sensitivities obtained by ge-ometric mean regression are −17.5±0.6 per meg/◦C (R2=0.70), −7.2±0.2 per meg/◦C (R2=0.71) and −3.6 ± 0.2 per meg/◦C (R2=0.51) for the “4 mm ID/35 mL min−1”, “4 mm 25
ID/250 mL min−1” and “0.8 mm ID/155 mL min−1” experiments, respectively. As shown in Fig.4, the temperature sensitivities of δAr/N2mainly depend on the gas velocity at the air intake.
ACPD
5, 8473–8506, 2005 CO2 and associated tracers at Bern P. Sturm et al. Title Page Abstract Introduction Conclusions References Tables Figures J I J I Back Close Full Screen / EscPrint Version Interactive Discussion
EGU Variations of the laboratory temperature can also potentially influence the δAr/N2
measurements. Especially in summer there is a diurnal cycle of the laboratory tem-perature with amplitudes of 2 to 3◦C. However, the most striking feature of the diurnal temperature variations in the laboratory is a rapid drop of about 3◦C at midnight caused by the air-conditioning. Because in these experiments no change in δAr/N2can be ob-5
served at midnight, the variations in δAr/N2are indeed mainly caused by fractionation at the air intake. This supposition was further confirmed by actively heating the intake tube, which resulted in large δAr/N2 deviations. An explanation is that during the day especially when the sun heats the black coating of the Dekabon tube, there builds up a small temperature gradient between the intake tube and the surrounding air. This leads 10
to thermal diffusion with preferential accumulation of the lighter molecules in regions with higher temperatures. A thermal diffusion factor for Ar in N2of α=0.071 (Grew and Ibbs, 1952) would lead to a steady state fractionation of 240 per meg/◦C. However, a steady state is not achieved at the intake because of the continuous flow of gas. Even though, the lower the flow velocity the more the air can approach a steady state. The 15
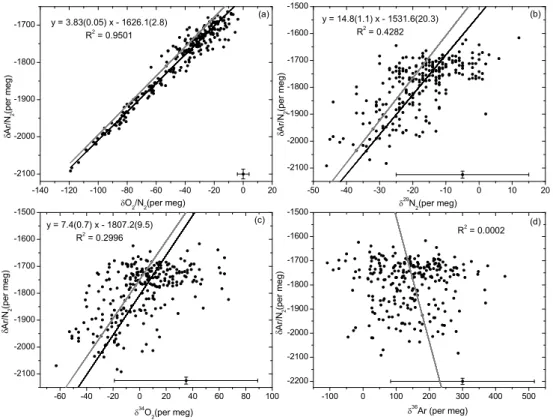
slope of the correlation plot of δAr/N2 versus O2/N2 for the “4 mm ID/35 mL min−1” and the intake heating experiments gives 3.8±0.1 (Fig.5a) and is in good accordance with what is expected from thermal fractionation (Grew and Ibbs,1952;Keeling et al., 2004).
The isotopic ratios δ29N2, δ34O2and δ36Ar show also small variations that are cor-20
related with the temperature, providing compelling evidence of diffusive fractionation. However the signal-to-noise ratio relative to measurement precision is much higher for Ar/N2 than for δ29N2, δ34O2or δ36Ar, because Ar/N2 is more sensitive to mass-dependent fractionation processes owing to the comparatively large mass difference between Ar and N2. Figure 5b, c and d show the correlation plots of δAr/N2 versus 25
δ29N2, δ34O2 and δ36Ar for the “4 mm ID/35 mL min−1” experiment. The mass spec-trometric uncertainty is indicated by error bars in the lower right corner of each plot. Regression lines (black lines) were calculated in Fig.5a, b and c using a measurement error model which accounts for the relative magnitude of the errors in both variables
ACPD
5, 8473–8506, 2005 CO2 and associated tracers at Bern P. Sturm et al. Title Page Abstract Introduction Conclusions References Tables Figures J I J I Back Close Full Screen / EscPrint Version Interactive Discussion
EGU (Fuller,1987). There is no correlation between δAr/N2and δ36Ar (Fig.5d). The
ther-mal diffusion factors α of29N2-28N2,34O2-32O2and36Ar-40Ar at 20◦C are about 0.0045, 0.0099 and −0.0137, respectively (Lang,1999). The expected correlation slopes for thermal diffusion obtained from these diffusion factors are shown as grey lines in Fig.5. Measurements of the isotopic composition of N2, O2 and Ar are further discussed in 5
Sect.3.4.
Experiments showed that the thermal fractionation at the intake could be reduced if instead of Dekabon other types of tubing are used. Intakes both made of transparent plastic and stainless steel significantly reduced this effect, presumably because of a smaller influence of solar heating. However, thermal fractionation could also be ob-10
served on days with overcast sky. Shading of the intake from sunlight can therefore only reduce but not eliminate this effect. High flow velocities at the intake either by large sampling flows or by intake tubes with small inner diameters may be most helpful for reducing thermal diffusion at the intake.
Additional tests with sample air from a high pressure cylinder showed that there is 15
also a measurable influence of the laboratory temperature on δAr/N2. A cylinder was placed outside the laboratory where only small and not abrupt temperature variations occur to exclude any fractionation related to the cylinder or the pressure regulator. Then, the measured δAr/N2 showed to be positively correlated with the laboratory temperature (in contrast to the negative temperature sensitivity for fractionation at the 20
intake). Different sources of thermal fractionation inside the laboratory may lead to these effects: a) The cold trap which is partly immersed in silicon oil at −70◦C. Be-cause of the relatively large volume (∼250 mL) and the large temperature gradient (∼90◦C) thermal diffusion is likely to occur inside this cold trap. Changing temperature gradients due to varying room temperatures could therefore lead to thermal effects. b) 25
Temperature dependent fractionation at tees (Manning,2001), and c) Fluctuations of the working gas due to thermally induced effects at the high-pressure gas cylinders. We favor explanation b) based on first tests of divided air fluxes by tees showing a clear thermal diffusion effect.
ACPD
5, 8473–8506, 2005 CO2 and associated tracers at Bern P. Sturm et al. Title Page Abstract Introduction Conclusions References Tables Figures J I J I Back Close Full Screen / EscPrint Version Interactive Discussion
EGU 3.2. The CO2record
The prevalent local wind directions are the northern and western wind sector. High wind speeds occur with winds coming from north-east to east (45 to 90◦) and from west to south-west (225 to 270◦), which are the predominant mesoscale wind directions on the Swiss Plateau. Generally, there is a good correlation between CO2and 222Rn for 5
all wind directions. Also, no significant correlation between wind direction and CO2 mixing ratio was found, indicating that no distinct CO2 sources are in the immediate vicinity of the sampling site.
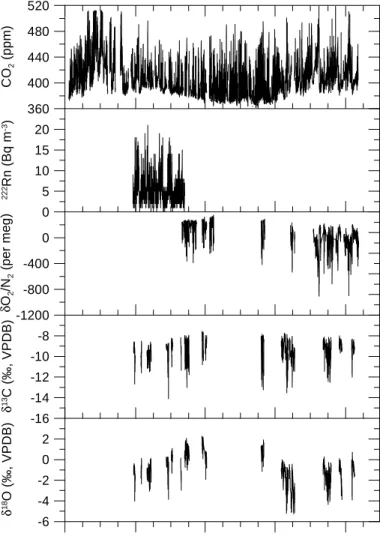
An overview of atmospheric records of CO2,222Rn, O2/N2, δ13C and δ18O of CO2at Bern between October 2003 and February 2005 is given in Fig.6. The diurnal variability 10
is much larger than the seasonal variability and is mainly caused by local sources and sinks and by diurnal changes of atmospheric mixing conditions in the boundary layer.
CO2 mixing ratios were highest in the wintertime with nighttime maximum values reaching more than 500 ppm. During atmospheric inversion events, characterized by persistent fog in autumn and winter, the CO2mixing ratio was clearly above 400 ppm 15
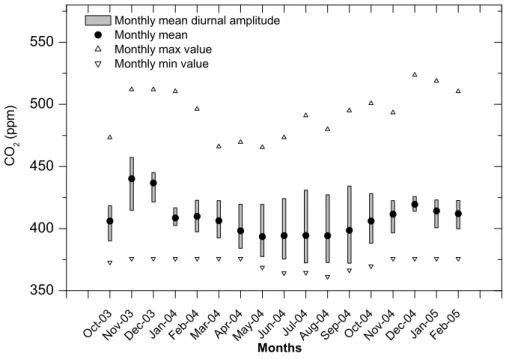
over a period of several days. Afternoon values in the spring and summer were com-monly close to the background value as measured for example at Jungfraujoch (Sturm et al.,2005b). Figure 7shows the monthly mean diurnal amplitudes and the monthly mean of the CO2mixing ratio for the months October 2003 to February 2005. Diurnal variations of CO2 show a minimum in the afternoon followed by an increase towards 20
the maximum in the early morning hours. The diurnal CO2 amplitudes are largest in summer (55 to 60 ppm peak) and smallest in winter (15 to 25 ppm peak-to-peak) but the monthly amplitudes (i.e. the difference between the monthly maximum and the monthly minimum) are smallest in summer (118 to 128 ppm peak-to-peak) and largest in winter (120 to 148 ppm peak-to-peak) due to inversion events as mentioned 25
above.
The222Rn activity was measured during a three month period between 27 January and 26 April 2004. The specific activity ranged from 0 to 20 Bq m−3. Elemental ratios
ACPD
5, 8473–8506, 2005 CO2 and associated tracers at Bern P. Sturm et al. Title Page Abstract Introduction Conclusions References Tables Figures J I J I Back Close Full Screen / EscPrint Version Interactive Discussion
EGU (O2/N2, Ar/N2) and carbon and oxygen isotopes of CO2 (δ13C, δ18O) could only be
measured periodically, especially on weekends when no other applications and mea-surements were running on the analyzers. The O2/N2, δ13C and δ18O showed also large diurnal variations corresponding to changes in CO2mixing ratio.
3.3. δ13C of CO2, δ18O of CO2and O2/N2measurements 5
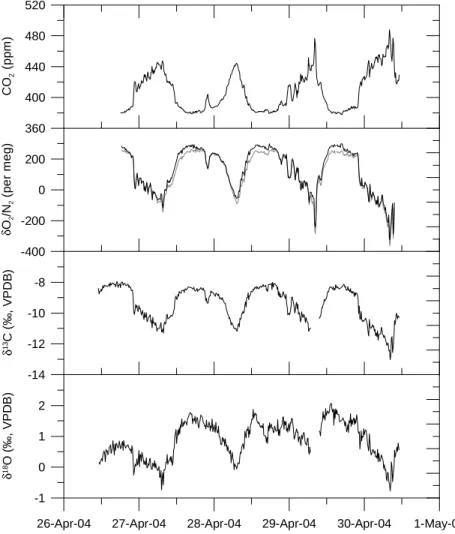
Figure8 shows an example for typical diurnal cycles of CO2, O2/N2, δ13C and δ18O records between 26 April and 1 May 2004. The O2/N2, δ13C and δ18O measurements mirror the CO2 variations. The influence of thermal fractionation on O2/N2 was cor-rected using the δAr/N2measurements. In a first step, the biogenic and anthropogenic components of O2/N2variations were removed by subtracting the CO2 record scaled 10
by the observed O2:CO2 ratio. Variations in the residual O2/N2 are then expected to represent thermal fractionation effects. Secondly, the fractionation ratio of O2/N2and
δAr/N2 was determined by the correlation between the residual O2/N2 and δAr/N2. The slope of this correlation varies between 3.9 and 1.7 (R2=0.8 to 0.4), which either reflects mixed influences of laboratory and outdoor temperature fractionation or di ffer-15
ent flow conditions in the inlet system depending on the measurement setup or the low signal to noise ratio. With this O2/N2-Ar/N2 fractionation ratio, the δAr/N2variations are then used to finally subtract the thermally induced O2/N2 variations from the orig-inal O2/N2 to obtain the corrected O2/N2. In Fig. 8the original (shaded line) as well as the corrected O2/N2(black line) are shown. The correction is less than 5% of the 20
measured O2/N2signal.
A representative Keeling plot of δ13C and δ18O (Keeling,1958,1961) and the cor-responding O2–CO2correlation during the night of 27/28 April 2004 is shown in Fig.9. Only nighttime values (18:00 to 06:00 LT) have been used to match the Keeling plot as-sumptions, i.e., a constant background CO2concentration and a constant isotopic sig-25
nature of the source or sink, as accurately as possible. Still, the δ13Csource, δ18Osource and O2:CO2ratios mostly represent a flux weighted average of more than one source
ACPD
5, 8473–8506, 2005 CO2 and associated tracers at Bern P. Sturm et al. Title Page Abstract Introduction Conclusions References Tables Figures J I J I Back Close Full Screen / EscPrint Version Interactive Discussion
EGU and/or sink. Varying proportions of CO2 sources containing distinct isotope ratios
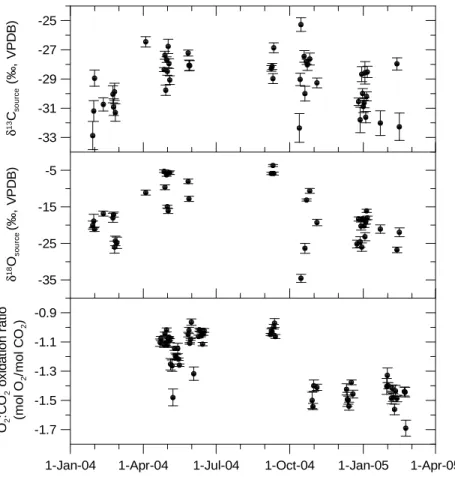
vi-olate the assumptions of the 2-ended mixing model, and are more common with oxy-gen than carbon isotopes, causing poorer relationships between δ18O and 1/CO2. In Fig. 10 the nighttime buildup of CO2 was used to derive daily values of δ13Csource,
δ18Osource and O2:CO2 by the Keeling plot intercept method. The correlations were 5
calculated by geometric mean regression and error bars are the standard deviation of the slopes. Only nights with more than 25 measurements, correlation coefficients larger than R2=0.9 for δ13C and O2:CO2and larger than R2=0.7 for δ18O were consid-ered. The nighttime δ13Csource varies between −33‰ and −25‰ with generally lower values in the winter months than during the rest of the year. This likely represents the 10
larger influence of fossil fuel combustion in wintertime. The large variability from one night to the next may be caused by different weather conditions resulting in advection of different air masses or changes in the CO2source distribution. A similar picture can be seen for the nighttime δ18Osource. The values range from −34‰ to −3‰ with the depleted (more negative) signatures again occurring in wintertime and highly enriched 15
(more positive) values in the spring and summer. This seasonal variation of δ18Osource is somewhat larger than the variations of about −21‰ to −11‰ observed byPataki et al. (2003) in a similar study. The δ18O signal of atmospheric CO2 is a signal dom-inated by CO2 exchange with the terrestrial biosphere (Ciais et al.,1997a,b;Keeling, 1995). Fractionation of the oxygen isotopes of CO2 occurs in plants owing to di ffer-20
ential diffusion of C18O16O and C16O16O and to isotope effects in oxygen exchange with chloroplast water. The higher δ18O values in summer compared to winter are most probably caused by strong photosynthetic activity and an associated exchange of18O with leaf water in plants, which is generally enriched in δ18O if compared to the ground water due to evapotranspiration (Dongmann et al.,1974). Furthermore, CO2 25
from combustion has a δ18O value similar to the δ18O of atmospheric O2 at −18‰ on the VPDB-CO2scale, corresponding to 23.5‰ on the SMOW scale (Kroopnick and Craig, 1972). Thus a larger fossil fuel CO2 component in winter leads to decreased
ACPD
5, 8473–8506, 2005 CO2 and associated tracers at Bern P. Sturm et al. Title Page Abstract Introduction Conclusions References Tables Figures J I J I Back Close Full Screen / EscPrint Version Interactive Discussion
EGU For a possible interpretation of the observed O2:CO2 ratios we consider a simple
model. If we assume that the diurnal variations can be described by biogenic and fossil fuel fluxes of carbon and oxygen in the catchment area of the sampling site, then the atmospheric mass balance for CO2and O2can be written
∆CO2= F + B (1)
5
and
∆O2= αFF + αBB, (2)
where ∆CO2 and ∆O2 are the observed changes in the atmospheric CO2 and O2 concentration, F and B are the fluxes of carbon to the atmosphere due to fossil fuel combustion and the terrestrial biosphere, respectively (positive for release to the at-10
mosphere). The coefficients αF and αB are average O2:CO2 exchange ratios for fossil fuel and land biota. We use αF=−1.4 mol O2/mol CO2 (Manning, 2001) and
αB=−1.1 mol O2/mol CO2 (Severinghaus, 1995). By combining Eqs. (1) and (2) and assuming that F and B are constant over the considered time period, we can estimate from the observed O2:CO2exchange ratio (∆O2/∆CO2) the proportion of the biogenic 15
flux in relation to the fossil fuel flux
B F = −
∆O2/∆CO2− αF ∆O2/∆CO2− αB
. (3)
The measured nighttime O2:CO2 oxidation ratios from April 2004 to February 2005 are between −0.96 and −1.69 (lowest panel in Fig.10). For nighttime air sampling it is assumed that respired CO2 is added to the atmosphere and both fluxes F and B are 20
positive. This would lead to O2:CO2 ratios between −1.1 and −1.4. However, almost half of the summer values are between −0.96 and −1.1. This could only be explained with a biogenic CO2 sink up to four times as strong as the fossil fuel source, which is obviously not the case, since the CO2 concentration is increasing and not decreas-ing durdecreas-ing the night. The same considerations can also be applied to the δ13Csource 25
ACPD
5, 8473–8506, 2005 CO2 and associated tracers at Bern P. Sturm et al. Title Page Abstract Introduction Conclusions References Tables Figures J I J I Back Close Full Screen / EscPrint Version Interactive Discussion
EGU data, where no conflicting picture can be seen. The measured δ13Csource are in the
range between an assumed δ13C of the biospheric component of about −26‰ and the more depleted values of the fossil fuel component. One possibility to explain these low O2:CO2 ratios would be an overestimation of the span of our CO2 scale by more than 10%. Comparison of our CO2data with CO2measurements from Laboratoire des 5
Science du Climat et de l’Environnement, CE Saclay, France, (Sturm et al., 2005a) and our internal measurements of the calibrated NOAA CO2 standards on the WMO CO2scale lead to the conclusion that this is highly unlikely. An underestimation of the O2/N2span of this magnitude can not be ruled out a priori, though. Since international intercomparison programs for O2/N2 measurements are being initiated only now, we 10
do not have any independent validation of our O2/N2scale yet. Measurement effects related to the mass spectrometric technique like cross contamination (Meijer et al., 2000) could potentially lead to an underestimation of the O2/N2 span. However, no such effects have been reported by other laboratories also measuring O2/N2by mass spectrometry so far. Another alternative to explain the observed O2:CO2ratios is that 15
processes with O2:CO2 exchange ratios of about −1.0 play a major role in nighttime build-up of CO2. Stephens et al. (2001) have also reported on O2:CO2 relationships that are considerably lower than theory would suggest, but potential atmospheric or physiological origins for such relationships are unknown.
3.4. δ29N2, δ34O2and δ36Ar of air 20
Measurements of the isotopic composition of N2, O2 and Ar are shown in Fig. 11. These isotopic ratios are as a first approximation constant within measurement preci-sion. The small variations of the mean appearing in Fig.11are due to changes in mass spectrometer performance. Owing to the relatively high sampling rate of 5 measure-ments per hour, there are also diurnal variations detectable. However, because of the 25
many gaps in the available record and the poor signal-to-noise ratio it is difficult to quan-tify these effects. As already mentioned in Sect.3.1, thermal diffusion fractionation at
ACPD
5, 8473–8506, 2005 CO2 and associated tracers at Bern P. Sturm et al. Title Page Abstract Introduction Conclusions References Tables Figures J I J I Back Close Full Screen / EscPrint Version Interactive Discussion
EGU the air intake is considered to be the dominant cause for such diurnal variations. An
as-sumed variation in δAr/N2of 200 per meg due to thermal diffusion would correspond to variations in δ29N2, δ34O2and δ36Ar of about 13, 28 and 39 per meg, respectively. This might be consistent with the observed variations in δ29N2 and δ34O2. For δ36Ar the measured amplitude of the variations are estimated to be larger (about 150 per meg), 5
thus δ36Ar is probably also influenced by other unidentified measurement artifacts. The δ18O of atmospheric O2(δ34O2) is affected by photosynthesis and respiration in the carbon/oxygen cycle and by the hydrological cycle, similar to the oxygen isotopic composition of CO2. Could we potentially detect biogeochemical variations of δ18O of atmospheric O2 in our record? The δ18O of atmospheric oxygen is enriched by 10
23.5‰ relative to average ocean water (Kroopnick and Craig,1972), which is known as the Dole effect. The δ18O produced by photosynthesis is similar to that of the water from which the oxygen isotopes originate, whereas respiration fractionates by about −20‰ relative to atmospheric O2(Guy et al.,1993). The δ18O of leaf water is elevated by 4 to 8‰ compared to oceanic water due to evapotranspiration (Dongmann,1974; 15
Farquhar et al.,1993). If we assume that a diurnal increase in atmospheric O2/N2 of 500 per meg is driven by the input of photosynthetic O2that is about 20‰ lower in δ18O than atmospheric O2, we would expect a change in δ18O of O2 of 10 per meg. The seasonal variability of O2/N2(∼150 per meg) leads to an even smaller signal in δ18O of O2 (∼3 per meg). The measurement precision defined as the standard deviation 20
of a single measurement is about 40 per meg for δ34O2. Thus, detecting such small variations is very difficult with current mass spectrometric measurements.
3.5. 222Rn tracer method to estimate regional CO2emissions
Examples of hourly mean values of CO2 and 222Rn, together with local wind speed and wind direction between 17 and 23 March 2004 and between 1 and 7 April 2004 25
are shown in Fig.12. During the first days of these periods wind speeds are low with frequently changing directions. The trace gas concentration records show a typical
ACPD
5, 8473–8506, 2005 CO2 and associated tracers at Bern P. Sturm et al. Title Page Abstract Introduction Conclusions References Tables Figures J I J I Back Close Full Screen / EscPrint Version Interactive Discussion
EGU diurnal pattern caused by nighttime inversion situations. On 19 March and 4 April,
re-spectively, winds change to westerly directions with persistently high wind speeds. The CO2and222Rn concentrations are then close to continental background level (Schmidt et al., 1996). The correlation between 222Rn and CO2 will be used to estimate CO2 fluxes for the catchment area of the sampling site.
5
The222Rn measurements can be used to infer CO2emission by using a simple one-dimensional approach. This method has been used for other greenhouse gases and at different sites and is described in detail bySchmidt et al.(2001). Assuming that each trace gas is released to the atmosphere at a constant rate ji and that it accumulates in a well-mixed boundary layer of height H(t), the short-term change in concentration 10 ∆ci(t) is then: ∆ci(t) ∆t = ji H(t). (4)
Since H(t) is the same for222Rn and CO2, we can eliminate H(t) by combining both tracers jCO 2 = jRn ∆cCO2 ∆cRn . (5) 15
The CO2flux can thus be calculated from the measured slope between CO2and222Rn variations and the222Rn exhalation rate. The radioactive decay of222Rn in the atmo-sphere during a typical nighttime inversion situation lasting about 12 h leads to a net 222
Rn loss of about 5%. Therefore a mean correction factor of 0.95 is applied when estimating222Rn-based CO2fluxes.
20
Daily CO2/222Rn correlations were determined using geometric mean regression. To derive a mean value for the period from February to April 2004 only those days were included for which more than 12 hourly mean values existed and which showed a correlation coefficient larger than R2=0.4. 33 days (39%) satisfy this criterion. The
ACPD
5, 8473–8506, 2005 CO2 and associated tracers at Bern P. Sturm et al. Title Page Abstract Introduction Conclusions References Tables Figures J I J I Back Close Full Screen / EscPrint Version Interactive Discussion
EGU mean CO2/222Rn slope is 5.2±1.7 ppm/Bq m−3. This is larger than estimates from
other European sites. Schmidt et al. (1996) have measured CO2–222Rn slopes at Schauinsland, Germany, in the range of 1.8 to 3.5 ppm/Bq m−3 for the winter months. A wintertime estimation for western Europe from the Mace Head record by Biraud et al. (2000) gives a slope of 1.4 to 2.1 ppm/Bq m−3 for all selected events and 4.7 to 5
6.8 ppm/Bq m−3for “polluted” events.
The222Rn flux emitted over continents is not strictly uniform, but depends mainly on the soil type and the hydrological conditions. There is no regional map of observed 222
Rn emissions available, but 222Rn flux measurement at different sites in Germany showed an average flux of about 50 Bq m−2h−1, corresponding to 0.7 atoms cm−2s−1 10
(D ¨orr and M ¨unnich, 1990; Schmidt et al., 2001). The uncertainty of the 222Rn ex-halation rate is estimated as ±25% (Schmidt et al., 2001). Using this estimation of the 222Rn exhalation rate one obtains a mean CO2 flux density during the pe-riod February/March/April 2004 for the Bern region of 11.0±4.5 mmole m−2h−1 or 95±39 tC km−2month−1. This CO2 flux includes both biogenic and fossil fuel fluxes. 15
The two main sources of uncertainty for this estimate, namely the222Rn flux and the CO2/222Rn correlation amount to an overall uncertainty of the CO2 flux estimate of ±41%. To reduce this uncertainty the exact source areas of both CO2 and
222 Rn should be known. This would require a explicit transport model, which can resolve the spacial and temporal patterns of the CO2and222Rn sources.
20
4. Summary and outlook
We summarize first results from on-going continuous measurements of CO2, its stable isotopes and O2/N2 in Bern. Concurrent Ar/N2measurements revealed that diffusive fractionation due to thermal gradients at the air intake is an important modifying pro-cess for high precision O2/N2 measurements. The CO2, O2/N2, δ13C and δ18O of 25
modu-ACPD
5, 8473–8506, 2005 CO2 and associated tracers at Bern P. Sturm et al. Title Page Abstract Introduction Conclusions References Tables Figures J I J I Back Close Full Screen / EscPrint Version Interactive Discussion
EGU lated by surface uptake and release by vegetation and soils, emissions from fossil fuel
combustion, and by the diurnal development of the atmospheric boundary layer. Both stable carbon and oxygen isotopes showed depletion in the winter and enrichment in the summer due to changes in the proportions of fossil fuel combustion and biogenic respiration at different times of the year. Additionally, 222Rn was used to estimate a 5
mean CO2 flux density in the catchment area of the sampling site. As the measure-ments go on and more data are available the CO2 isotope and mixing ratio data can be used to quantify with a mass balance calculation the proportional contribution of each component to the total CO2source. We also expect to observe inter-annual vari-ations of the seasonal cycle, and changes in CO2 mixing ratio relative to background 10
sites, such as Jungfraujoch. Comparison of boundary layer mixing ratios with back-ground mixing ratios should help to improve our understanding of atmosphere/surface exchange of CO2on the continental scale.
Acknowledgements. We thank P. Nyfeler for technical assistance, L. Martin (Institute of Applied
Physics, University of Bern, Switzerland) for providing the meteorological data and R.
Hester-15
berg for the δ13C and δ18O data of Fig. 1. This work was supported by the Swiss National Science Foundation, in particular the R’equip program, and the EU Projects AEROCARB and CARBOEUROPE-IP.
References
Bender, M. L., Tans, P. P., Ellis, T. J., Orchardo, J., and Habfast, K.: A high precision isotope
20
ratio mass spectrometry method for measuring the O2/N2ratio of air, Geochim. Cosmochim. Acta, 58, 4751–4758, 1994. 8475
Biraud, S., Ciais, P., Ramonet, M., Simmonds, P., Kazan, V., Monfray, P., O’Doherty, S., Spain, T. G., and Jennings, G. S.: European greenhouse gas emissions estimated from continuous atmospheric measurements and radon 222 at Mace Head, Ireland, J. Geophys. Res., 105,
25
1351–1366, 2000. 8489
Chapman, S. and Cowling, T. G.: The Mathematical Theory of Non-Uniform Gases, Cambridge Univ. Press, Cambridge, 1970. 8475
ACPD
5, 8473–8506, 2005 CO2 and associated tracers at Bern P. Sturm et al. Title Page Abstract Introduction Conclusions References Tables Figures J I J I Back Close Full Screen / EscPrint Version Interactive Discussion
EGU Ciais, P., Denning, A. S., Tans, P. P., Berry, J. A., Randall, D. A., Collatz, G. J., Sellers, P. J.,
White, J. W. C., Trolier, M., Meijer, H. A. J., Francey, R. J., Monfray, P., and Heimann, M.: A three-dimensional synthesis study of δ18O in atmospheric CO2, 1. Surface fluxes, J. Geo-phys. Res., 102, 5857–5872, 1997a. 8475,8484
Ciais, P., Tans, P. P., Denning, A. S., Francey, R. J., Trolier, M., Meijer, H. A. J., White, J. W. C.,
5
Berry, J. A., Randall, D. A., Collatz, G. J., Sellers, P. J., Monfray, P., and Heimann, M.: A three-dimensional synthesis study of δ18O in atmospheric CO2, 2. Simulations with the TM2 transport model, J. Geophys. Res., 102, 5873–5883, 1997b. 8484
Dongmann, G.: The contribution of land photosynthesis to the stationary enrichment of18O in the atmosphere, Radiat. Environ. Biophys., 11, 219–225, 1974. 8487
10
Dongmann, G., N ¨urnberg, H. W., F ¨orstel, H., and Wagner, K.: On the enrichment of H182 O in the leaves of transpiring plants, Radiat. Environ. Biophys., 11, 41–52, 1974. 8484
D ¨orr, H. and M ¨unnich, K. O.: 222Rn flux and soil air concentration profiles in West-Germany. Soil222Rn as tracer for gas transport in the unsaturated soil zone, Tellus, 42B, 20–28, 1990.
8489 15
Farquhar, G. D., Lloyd, J., Taylor, J. A., Flanagnan, L. B., Syvertsen, J. P., Hubick, K. T., Wong, S. C., and Ehleringer, J. R.: Vegetation effects on the isotope composition of oxygen in atmospheric CO2, Nature, 363, 439–443, 1993. 8487
Friedli, H., Siegenthaler, U., Rauber, D., and Oeschger, H.: Measurements of concentration,
13
C/12C and 18O/16O ratios of tropospheric carbon dioxide over Switzerland, Tellus, 39B,
20
80–88, 1987. 8475
Fuller, W. A.: Measurement Error Models, Wiley Series in Probability and Statistics, John Wiley & Sons, New York, 1987. 8481
Gemery, P. A., Trolier, M., and White, J. W. C.: Oxygen isotope exchange between carbon dioxide and water following atmospheric sampling using glass flasks, J. Geophys. Res., 101,
25
14 415–14 420, 1996. 8478
Grew, K. E. and Ibbs, T. L.: Thermal Diffusion in Gases, Cambridge Univ. Press, Cambridge, 1952. 8480
Guy, R. D., Fogel, M. L., and Berry, J. A.: Photosynthetic Fractionation of the Stable Isotopes of Oxygen and Carbon, Plant Physiol., 101, 37–47, 1993. 8487
30
Hesterberg, R.: Das Kohlendioxid und seine stabilen Isotope in Atmosph ¨are und Boden, Mas-ter’s thesis, Physics Institute, University of Bern, Bern, Switzerland, 1990. 8475,8495
ACPD
5, 8473–8506, 2005 CO2 and associated tracers at Bern P. Sturm et al. Title Page Abstract Introduction Conclusions References Tables Figures J I J I Back Close Full Screen / EscPrint Version Interactive Discussion
EGU Keeling, C. D.: The concentration and isotopic abundances of atmospheric carbon dioxide in
rural areas, Geochim. Cosmochim. Acta, 13, 322–334, 1958. 8483
Keeling, C. D.: The concentration and isotopic abundances of carbon dioxide in rural and ma-rine air, Geochim. Cosmochim. Acta, 24, 277–298, 1961. 8483
Keeling, C. D., Bacastow, R. B., Carter, A. F., Piper, S. C., Whorf, T. P., Heimann, M., Mook,
5
W. G., and Roeloffzen, H.: A three-dimensional model of atmospheric CO2transport based on observed winds: 1. Analysis of observational data, in: Aspects of Climate Variability in the Pacific and the Western Americas, edited by: Peterson, D. H., Geophys. Monogr. Ser., 55, 165–236, AGU, Washington D.C., 1989. 8475
Keeling, R.: The atmospheric oxygen cycle: The oxygen isotopes of atmospheric CO2and O2
10
and the O2/N2ratio, Rev. Geophys., Supplement, 1253–1262, 1995. 8484
Keeling, R. F., Stephens, B. B., Najjar, R. G., Doney, S. C., Archer, D., and Heimann, M.: Seasonal variations in the atmospheric O2/N2ratio in relation to the kinetics of air-sea gas exchange, Global Biogeochem. Cycles, 12, 141–163, 1998. 8475
Keeling, R. F., Blaine, T., Paplawsky, B., Katz, L., Atwood, C., and Brockwell, T.:
Measure-15
ment of changes in atmospheric Ar/N2 ratio using a rapid-switching, single-capillary mass spectrometer system, Tellus, 56B, 322–338, 2004. 8479,8480
Kroopnick, P. and Craig, H.: Atmospheric Oxygen: Isotopic Composition and Solubility Frac-tionation, Science, 175, 54–55, 1972. 8484,8487
Lang, C.: Bestimmung und Interpretation der Isotopen- und Elementverh ¨altnisse von Luft aus
20
polaren und alpinen Eisbohrkernen, insbesondere zur Temperaturrekonstruktion unter Aus-nutzung des Effekts der Thermodiffusion, PhD thesis, Physics Institute, University of Bern, Bern, Switzerland, 1999. 8481
Langenfelds, R. L.: Studies of the global carbon cycle using atmospheric oxygen and associ-ated tracers, PhD thesis, Univ. of Tasmania, Hobart, Tasmania, Australia, 2002. 8475 25
Lehmann, B. E., Ihly, B., Salzmann, S., Conen, F., and Simon, E.: An automatic static chamber for continuous220Rn and222Rn flux measurements from soil, Radiation Measurements, 38, 43–50, 2004. 8478
Leuenberger, M., Nyfeler, P., Moret, H. P., Sturm, P., and Huber, C.: A new gas inlet system for an isotope ratio mass spectrometer improves reproducibility, Rapid Commun. Mass
Spec-30
trom., 14, 1543–1551, 2000. 8478
Leuenberger, M., Eyer, M., Nyfeler, P., Stauffer, B., and Stocker, T. F.: High-resolution δ13C measurements on ancient air extracted from less than 10 cm3 of ice, Tellus, 55B, 138–144,
ACPD
5, 8473–8506, 2005 CO2 and associated tracers at Bern P. Sturm et al. Title Page Abstract Introduction Conclusions References Tables Figures J I J I Back Close Full Screen / EscPrint Version Interactive Discussion
EGU 2003. 8477
Manning, A. C.: Temporal variability of atmospheric oxygen from both continuous measure-ments and a flask sampling network: Tools for studying the global carbon cycle, PhD thesis, University of California, San Diego, California, USA, 2001. 8475,8481,8485
Meijer, H. A. J., Neubert, R. E. M., and Visser, G. H.: Cross contamination in dual inlet isotope
5
ratio mass spectrometers, International Journal of Mass Spectrometry, 198, 45–61, 2000.
8486
Pataki, D. E., Bowling, D. R., and Ehleringer, J. R.: Seasonal cycle of carbon dioxide and its isotopic composition in an urban atmosphere: Anthropogenic and biogenic effects, J. Geophys. Res., 108(D23), 4735, doi:10.1029/2003JD003865, 2003. 8484
10
Schmidt, M., Graul, R., Sartorius, H., and Levin, I.: Carbon dioxide and methane in continental Europe: a climatology, and222Radon-based emission estimates, Tellus, 48B, 457–473, 1996.
8488,8489
Schmidt, M., Glatzel-Mattheier, H., Sartorius, H., Worthy, D. E., and Levin, I.: Western Euro-pean N2O emissions: A top-down approach based on atmospheric observations, J.
Geo-15
phys. Res., 106, 5507–5516, 2001. 8488,8489
Severinghaus, J. P.: Studies of the terrestrial O2and carbon cycles in sand dune gases and in Biosphere 2, PhD thesis, Columbia University, New York, USA, 1995. 8485
Severinghaus, J. P., Bender, M. L., Keeling, R. F., and Broecker, W. S.: Fractionation of soil gases by diffusion of water vapor, gravitational settling, and thermal diffusion, Geochim.
20
Cosmochim. Acta, 60, 1005–1018, 1996. 8475
Stephens, B., Bakwin, P., Tans, P., and Teclaw, R.: Measurements of atmospheric O2variations at the WLEF tall-tower site, in Sixth International Carbon Dioxide Conference, Extended Abstracts, vol. I, pp. 78–80, Tohoku Univ., Sendai, Japan, 2001. 8486
Sturm, P.: Entwicklung eines neuen Einlasssystems f ¨ur die massenspektrometrische
Mes-25
sung des O2/N2Verh ¨altnisses, Master’s thesis, Physics Institute, University of Bern, Bern, Switzerland, 2001. 8478
Sturm, P., Leuenberger, M., Sirignano, C., Neubert, R. E. M., Meijer, H. A. J., Langenfelds, R., Brand, W. A., and Tohjima, Y.: Permeation of atmospheric gases through polymer O-rings used in flasks for air sampling, J. Geophys. Res., 109, D04309, doi:10.1029/2003JD004073,
30
2004. 8475,8478
Sturm, P., Leuenberger, M., Moncrieff, J., and Ramonet, M.: Atmospheric O2, CO2and δ13C measurements from aircraft sampling over Griffin Forest, Perthshire, UK, Rapid Commun.
ACPD
5, 8473–8506, 2005 CO2 and associated tracers at Bern P. Sturm et al. Title Page Abstract Introduction Conclusions References Tables Figures J I J I Back Close Full Screen / EscPrint Version Interactive Discussion
EGU Mass Spectrom., 19, 2399–2406, DOI:10.1002/rcm.2071, 2005a. 8478,8486
Sturm, P., Leuenberger, M., and Schmidt, M.: Atmospheric O2, CO2 and δ13C observations from the remote sites Jungfraujoch, Switzerland, and Puy de D ˆome, France, Geophys. Res. Lett., in press, 2005b. 8478,8482
Wilkening, M. H. and Clements, W. E.: Radon 222 From the Ocean Surface, J. Geophys. Res.,
5
ACPD
5, 8473–8506, 2005 CO2 and associated tracers at Bern P. Sturm et al. Title Page Abstract Introduction Conclusions References Tables Figures J I J I Back Close Full Screen / EscPrint Version Interactive Discussion
EGU
ACPD
5, 8473–8506, 2005 CO2 and associated tracers at Bern P. Sturm et al. Title Page Abstract Introduction Conclusions References Tables Figures J I J I Back Close Full Screen / EscPrint Version Interactive Discussion
EGU
28-Apr-04 30-Apr-04 2-May-04 4-May-04 -1680 -1640 -1600 -1560 -1520 δ Ar /N 2 (p er m e g) 24 20 16 12 8 4 Te m p er at u re (° C )
Fig. 2. Diurnal variations of δAr/N2(top) and outdoor temperature (bottom). Note the inverted
ACPD
5, 8473–8506, 2005 CO2 and associated tracers at Bern P. Sturm et al. Title Page Abstract Introduction Conclusions References Tables Figures J I J I Back Close Full Screen / EscPrint Version Interactive Discussion EGU 5 10 15 20 25 30 Temperature (°C) -2200 -2000 -1800 -1600 -1400 δ Ar /N 2 ( per m e g ) 0.8mm ID, 150ml/min 4mm ID, 250ml/min 4mm ID, 35ml/min
ACPD
5, 8473–8506, 2005 CO2 and associated tracers at Bern P. Sturm et al. Title Page Abstract Introduction Conclusions References Tables Figures J I J I Back Close Full Screen / EscPrint Version Interactive Discussion EGU 0 1 2 3 4 5 6 Flow velocity (m/s) -20 -16 -12 -8 -4 0 T e m p e rat ur e s e ns it iv it y of δ Ar /N 2 (pe r m e g/°C )
Fig. 4. Temperature sensitivity of δAr/N2depending on the gas velocity at the air intake for the
ACPD
5, 8473–8506, 2005 CO2 and associated tracers at Bern P. Sturm et al. Title Page Abstract Introduction Conclusions References Tables Figures J I J I Back Close Full Screen / EscPrint Version Interactive Discussion
EGU
4
P. Sturm et al.: CO
2and associated tracers at Bern
0 1 2 3 4 5 6 Flow velocity (m/s) -20 -16 -12 -8 -4 0 T e m p e ra tu re s e n s it iv it y o f δ A r/ N2 ( p e r m e g /° C )
Fig. 4. Temperature sensitivity of δAr/N
2depending on the gas
velocity at the air intake for the three experiments of Fig. 3.
tially influence the δAr/N
2measurements. Especially in
summer there is a diurnal cycle of the laboratory temperature
with amplitudes of 2 to 3
◦C. However, the most striking
feature of the diurnal temperature variations in the
labora-tory is a rapid drop of about 3
◦C at midnight caused by the
air-conditioning. Because in these experiments no change
in δAr/N
2can be observed at midnight, the variations in
δAr/N
2are indeed mainly caused by fractionation at the air
intake. This supposition was further confirmed by actively
heating the intake tube, which resulted in large δAr/N
2devi-ations. An explanation is that during the day especially when
the sun heats the black coating of the Dekabon tube, there
builds up a small temperature gradient between the intake
tube and the surrounding air. This leads to thermal diffusion
with preferential accumulation of the lighter molecules in
re-gions with higher temperatures. A thermal diffusion factor
for Ar in N
2of α = 0.071 (Grew and Ibbs, 1952) would lead
to a steady state fractionation of 240 per meg/
◦C. However, a
steady state is not achieved at the intake because of the
con-tinuous flow of gas. Even though, the lower the flow velocity
the more the air can approach a steady state. The slope of
the correlation plot of δAr/N
2versus O
2/N
2for the “4 mm
ID/35 mL min
−1” and the intake heating experiments gives
3.8 ± 0.1 (Fig. 5a) and is in good accordance with what is
expected from thermal fractionation (Grew and Ibbs, 1952;
Keeling et al., 2004).
The isotopic ratios δ
29N
2, δ
34O
2and δ
36Ar show also
small variations that are correlated with the temperature,
pro-viding compelling evidence of diffusive fractionation.
How-ever the signal-to-noise ratio relative to measurement
preci-sion is much higher for Ar/N
2than for δ
29N
2, δ
34O
2or
δ
36Ar, because Ar/N
2is more sensitive to mass-dependent
fractionation processes owing to the comparatively large
mass difference between Ar and N
2. Fig. 5b,c and d show
the correlation plots of δAr/N
2versus δ
29N
2, δ
34O
2and
δ
36Ar for the “4 mm ID/35 mL min
−1” experiment.
The
mass spectrometric uncertainty is indicated by error bars in
the lower right corner of each plot. Regression lines (black
lines) were calculated in Fig. 5a,b and c using a measurement
error model which accounts for the relative magnitude of the
errors in both variables (Fuller, 1987). There is no correlation
Fig. 5. Correlation plots of δAr/N
2versus O
2/N
2, δ
29N
2, δ
34O
2and δ
36Ar for the “4 mm ID/35 mL min
−1” experiment (see text).
Grey lines represent the expected correlation slopes obtained from
the ratios of the thermal diffusion factors for the respective isotopes
and elements. Black lines are the measured regression slopes using
the associated errors as shown in the bottom part of each graph.
between δAr/N
2and δ
36Ar (Fig. 5d). The thermal diffusion
factors α of
29N
2-
28N
2,
34O
2-
32O
2and
36Ar-
40Ar at 20
◦C
are about 0.0045, 0.0099 and −0.0137, respectively (Lang,
1999). The expected correlation slopes for thermal diffusion
obtained from these diffusion factors are shown as grey lines
in Fig. 5. Measurements of the isotopic composition of N
2,
O
2and Ar are further discussed in Section 3.4.
Experiments showed that the thermal fractionation at the
intake could be reduced if instead of Dekabon other types
of tubing are used. Intakes both made of transparent plastic
and stainless steel significantly reduced this effect,
presum-ably because of a smaller influence of solar heating.
How-ever, thermal fractionation could also be observed on days
with overcast sky. Shading of the intake from sunlight can
therefore only reduce but not eliminate this effect. High flow
velocities at the intake either by large sampling flows or by
intake tubes with small inner diameters may be most helpful
for reducing thermal diffusion at the intake.
Additional tests with sample air from a high pressure
cylinder showed that there is also a measurable influence
of the laboratory temperature on δAr/N
2. A cylinder was
placed outside the laboratory where only small and not
abrupt temperature variations occur to exclude any
fraction-ation related to the cylinder or the pressure regulator. Then,
the measured δAr/N
2showed to be positively correlated
with the laboratory temperature (in contrast to the negative
temperature sensitivity for fractionation at the intake).
Dif-ferent sources of thermal fractionation inside the laboratory
may lead to these effects: a) The cold trap which is partly
immersed in silicon oil at −70
◦C. Because of the relatively
large volume (∼ 250 mL) and the large temperature
gradi-Atmos. Chem. Phys., 0000, 0001–11, 2005
www.atmos-chem-phys.org/acp/0000/0001/
Fig. 5. Correlation plots of δAr/N2 versus O2/N2, δ29N2, δ34O2 and δ36Ar for the “4 mm
ID/35 mL min−1” experiment (see text). Grey lines represent the expected correlation slopes obtained from the ratios of the thermal diffusion factors for the respective isotopes and ele-ments. Black lines are the measured regression slopes using the associated errors as shown in the bottom part of each graph.
ACPD
5, 8473–8506, 2005 CO2 and associated tracers at Bern P. Sturm et al. Title Page Abstract Introduction Conclusions References Tables Figures J I J I Back Close Full Screen / EscPrint Version Interactive Discussion EGU -6 -4 -2 0 2 δ 18O (‰, VPD B) -1200 -800 -400 0 δ O2 /N 2 (per m e g ) 0 5 10 15 20 222 Rn (Bq m -3) 360 400 440 480 520 CO 2 (pp m ) -16 -14 -12 -10 -8 δ 13 C (‰, VPDB)
Fig. 6. Atmospheric records of CO2, 222Rn, O2/N2, δ13C and δ18O of CO2at Bern between
ACPD
5, 8473–8506, 2005 CO2 and associated tracers at Bern P. Sturm et al. Title Page Abstract Introduction Conclusions References Tables Figures J I J I Back Close Full Screen / EscPrint Version Interactive Discussion
EGU
P. Sturm et al.: CO
2and associated tracers at Bern
5
ent (∼ 90
◦C) thermal diffusion is likely to occur inside this
cold trap. Changing temperature gradients due to varying
room temperatures could therefore lead to thermal effects.
b) Temperature dependent fractionation at tees (Manning,
2001), and c) Fluctuations of the working gas due to
ther-mally induced effects at the high-pressure gas cylinders. We
favor explanation b) based on first tests of divided air fluxes
by tees showing a clear thermal diffusion effect.
3.2
The CO
2record
The prevalent local wind directions are the northern and
western wind sector. High wind speeds occur with winds
coming from north-east to east (45 to 90
◦) and from west
to south-west (225 to 270
◦), which are the predominant
mesoscale wind directions on the Swiss Plateau. Generally,
there is a good correlation between CO
2and
222Rn for all
wind directions. Also, no significant correlation between
wind direction and CO
2mixing ratio was found, indicating
that no distinct CO
2sources are in the immediate vicinity of
the sampling site.
An overview of atmospheric records of CO
2,
222Rn,
O
2/N
2, δ
13C and δ
18O of CO
2at Bern between October
2003 and February 2005 is given in Fig. 6. The diurnal
variability is much larger than the seasonal variability and
is mainly caused by local sources and sinks and by diurnal
changes of atmospheric mixing conditions in the boundary
layer.
CO
2mixing ratios were highest in the wintertime with
nighttime maximum values reaching more than 500 ppm.
During atmospheric inversion events, characterized by
per-sistent fog in autumn and winter, the CO
2mixing ratio was
clearly above 400 ppm over a period of several days.
Af-ternoon values in the spring and summer were commonly
close to the background value as measured for example at
Jungfraujoch (Sturm et al., 2005b).
Figure 7 shows the
monthly mean diurnal amplitudes and the monthly mean of
the CO
2mixing ratio for the months October 2003 to
Febru-ary 2005. Diurnal variations of CO
2show a minimum in the
afternoon followed by an increase towards the maximum in
the early morning hours. The diurnal CO
2amplitudes are
largest in summer (55 to 60 ppm peak-to-peak) and smallest
in winter (15 to 25 ppm peak-to-peak) but the monthly
am-plitudes (i.e. the difference between the monthly maximum
and the monthly minimum) are smallest in summer (118 to
128 ppm peak-to-peak) and largest in winter (120 to 148 ppm
peak-to-peak) due to inversion events as mentioned above.
The
222Rn activity was measured during a three month
period between 27 January and 26 April 2004. The
spe-cific activity ranged from 0 to 20 Bq m
−3. Elemental
ra-tios (O
2/N
2, Ar/N
2) and carbon and oxygen isotopes of
CO
2(δ
13C, δ
18O) could only be measured periodically,
es-pecially on weekends when no other applications and
mea-surements were running on the analyzers. The O
2/N
2, δ
13C
1-Oct-03 1-Feb-04 1-Jun-04 1-Oct-04 1-Feb-05 -6 -4 -2 0 2 δ 1 8O ( ‰ , V P D B ) -1200 -800 -400 0 δ O2 /N 2 ( p e r m e g ) 0 5 10 15 20 2 2 2R n ( B q m -3) 360 400 440 480 520 C O2 ( p p m ) -16 -14 -12 -10 -8 δ 1 3C ( ‰ , V P D B )
Fig. 6. Atmospheric records of CO
2,
222Rn, O
2/N
2, δ
13C and
δ
18O of CO
2at Bern between October 2003 and February 2005.
Fig. 7. Mean diurnal amplitudes (columns), monthly mean (black
circles) and monthly maximum and minimum (triangles) of CO
2for the months October 2003 to February 2005.
and δ
18O showed also large diurnal variations corresponding
to changes in CO
2mixing ratio.
www.atmos-chem-phys.org/acp/0000/0001/
Atmos. Chem. Phys., 0000, 0001–11, 2005
Fig. 7. Mean diurnal amplitudes (columns), monthly mean (black circles) and monthly maxi-mum and minimaxi-mum (triangles) of CO2for the months October 2003 to February 2005.
ACPD
5, 8473–8506, 2005 CO2 and associated tracers at Bern P. Sturm et al. Title Page Abstract Introduction Conclusions References Tables Figures J I J I Back Close Full Screen / EscPrint Version Interactive Discussion
EGU
26-Apr-04 27-Apr-04 28-Apr-04 29-Apr-04 30-Apr-04 1-May-04 -1 0 1 2 δ 18 O (‰ , VP D B ) -400 -200 0 200 δ O2 /N 2 (p e r m e g ) 360 400 440 480 520 CO 2 (p p m ) -14 -12 -10 -8 δ 13C ( ‰ , V P DB )
Fig. 8. Example of continuous CO2, O2/N2, δ13C and δ18O records between 26 April and 1
May 2004. For the O2/N2the original (shaded line) as well as the corrected values (black line) are shown (see text for explanation).
ACPD
5, 8473–8506, 2005 CO2 and associated tracers at Bern P. Sturm et al. Title Page Abstract Introduction Conclusions References Tables Figures J I J I Back Close Full Screen / EscPrint Version Interactive Discussion EGU 0.0022 0.0024 0.0026 1/CO2 (ppm-1) -0.5 0 0.5 1 1.5 2 δ 18 O o f C O2 ( ‰ , V P D B ) -11 -10.5 -10 -9.5 -9 -8.5 -8 δ 13 C of C O2 ( ‰ , V P D B ) -100 0 100 200 300 400 δ O2 /N 2 ( p er m e g) 380 400 420 440 CO2 (ppm) y = 7231(110) x - 27.4(0.3) R2 = 0.9874 y = 4247(222) x - 9.6(0.6) R2 = 0.7948 y = -5.00(0.05) x + 2170(18) R2 = 0.9931 27/28 April, 2004
Fig. 9. Representative Keeling plot of carbon and oxygen isotope ratios and O2:CO2oxidation
ratio during the night (18:00 to 06:00 LT) of 27/28 April 2004. The equations shown are derived from geometric mean regression (uncertainty in parentheses).