Achieving Six Sigma Printed Circuit
Board Yields
by Improving Incoming Component Quality and
Using a PCBA Prioritization Algorithm
ByDaniel Jacob Davis
B.S.E Mechanical Engineering, The University of Michigan, 2001
Submitted to the MIT Sloan School of Management and the Mechanical Engineering Department in Partial Fulfillment of the Requirements for the Degrees of
MASACH-SETS INSTRJTE
OF TECHNOLOGY
Master of Business Administration (
AND
JUN 2 5 2008
Master of Science in Mechanical Engineering
LIBRARIES
In conjunction with the Leaders for Manufacturing Program at the
Massachusetts Institute of Technology June 2008
C 2008 Massachus tts Institute of Technology. All rights reserved
Signature of Author
, .- f lhepartment of Mechanical Engineering & MIT Sloan School of Management
May 09, 2008
Certified by Certified by David Hardt, Thesis Supervisor
Ralph E. and Eloise F. Cross Professor of Mechanical Engineering
Certified by
Rq/ Welsch, Thesis Supervisor Professor of Statistics and "gement Science and Engineering Systems
Accepted by
Lallit Anand, ~ ate Committee Chairman Department of Mechanical Engineering
Accepted by
B Debbie Berechman
Achieving Six Sigma Printed Circuit Board Yields
by Improving Incoming Component Quality and
Using a PCBA Prioritization Algorithm
ByDaniel Jacob Davis
Submitted to the MIT Sloan School of Management and the
Mechanical Engineering Department on May 09, 2008 in Partial Fulfillment of the Requirements for the Degrees of Master of Business Administration and
Master of Science in Mechanical Engineering
ABSTRACT
Printed circuit board assemblies (PCBAs) are the backbone of the electronics industry. PCBA technologies are keeping pace with Moore's Law and will soon enable the convergence of video, voice, data, and mobility onto a single device. With the rapid advancements in product and component technologies, manufacturing tests are being pushed to the limits as consumers are demanding higher quality and more reliable electronics than ever before.
Cisco Systems, Inc. (Cisco) currently manufactures over one thousand different types of printed circuit board assemblies (PCBAs) per quarter all over the world. Each PCBA in Cisco's
portfolio has an associated complexity to its design determined by the number of interconnects, components, and other variables. PCBA manufacturing yields have historically been quite variable. In order to remain competitive, there is an imminent need to attain Six Sigma PCBA yields while controlling capital expenditures and innovating manufacturing test development and execution. Recently, Cisco kicked off the Test Excellence initiative to improve overall PCBA manufacturing yields and provided the backdrop to this work study.
This thesis provides a first step on the journey to attaining Six Sigma PCBA manufacturing yields. Using Six Sigma techniques, two hypotheses are developed that will enable yield
improvements: (1) PCBA yields can be improved by optimizing component selection across the product portfolio by analyzing component cost and quality levels, and (2) Using the Six Sigma DMAIC (define-measure-analyze-improve-control) method and the TOPSIS (Technique for Order Preferences by Similarity to Ideal Solutions) algorithm, PCBA yields will improve by optimally prioritizing manufacturing resources on the most important PCBAs first. The two analytical tools derived in this thesis will provide insights into how PCBA manufacturing yields can be improved today while enabling future yield improvements to occur.
Thesis Supervisor: Dave Hardt
Title: Ralph E. and Eloise F. Cross Professor of Mechanical Engineering
Thesis Supervisor: Roy Welsch
Acknowledgments
I am very fortunate to have worked with such great, smart people during my internship. I want to thank Cisco for giving me the opportunity to work on such an interesting project. Mike Lydon, my internship sponsor, and Gary Cooper, my supervisor were extremely instrumental in making my internship both inspiring and rewarding. Mike and Gary gave my project full support and visibility throughout Cisco. Without you both, my experience would not have been as
exciting, stimulating, challenging, or successful. I had a wonderful, truly invaluable experience.
During my internship, I had the honor to work with many other terrific people from Cisco. I want to especially thank Vah Erdekian, Greg Jordan, Roger Bhikha, Bill Eklow, Zoe Conroy, Erich Shaffer, Dave Towne, Hanbo Wang, Steve Nunamaker, Jim Leidigh, Paul Bennett, Raj Saxena, Derrick Kidani, Sachin Kothawade, Leslie Averbeck, Hitesh Merchant, Deepak Pathak, Ali Nouri, Peri Ryan, Charlotte Jackson-McCowan, and the rest of the Test Excellence team. You all were extremely influential in helping me create and shape my ideas for this thesis.
The MIT Leaders for Manufacturing (LFM) community at Cisco was also very helpful and supportive with my project. Jim Miller and Prentis Wilson, senior LFM leaders at Cisco, gave my project full support. The LFM network allowed me to get in touch with the key stakeholders, develop my ideas, and refine my solutions -thank you Miriam Park, Erik Stewart, Johnson Wu, Chris Pandolfo, and Julie Go. I also want to thank Chris Richard, my LFM mentor, for his advice, dedication, and support.
It was a pleasure to work with my two advisors: Professor Roy Welsch and Professor Dave Hardt. Professor Welsch was fully engaged in my internship, helping zero it in on a specific topic as he often called it "12 LFM internships in one." Professor Hardt was extremely influential in my project and helped refine my approach while always offering keen insights. Lastly, I want to give a huge thanks to Don Rosenfeld (aka "The Don"). I don't know how you do it year over year, but I really appreciate your efforts. Without the support from my MIT advisors and the MIT staff, I would have never been able to complete this work.
Lastly, I want to thank my very supportive family and especially, the most important person in the world to me, my future wife, Julie Glick. (sorry I missed that weekend in NYC -I had to write the thesis.) Julie is my inspiration! She is a woman with a tremendous personality that challenges me in everything I do, including every sentence written in this thesis.
Table of Contents
Acknowledgments ... 5 Table of Contents ... 7 Table of Figures .. ... 10 Table of Tables ... 11 Table of Equations ... 121. Chapter 1: PCBA Introduction, Cisco, and Motivation to Change ... 13
1.1. The Importance of Printed Circuit Board Assemblies ... 13
1.2. The Printed Circuit Board Assemblies Manufacturing Process ... 15
1.3. Introduction to Cisco Systems, Inc ... ... ... 17
1.4. Impetus for Change... 18
1.5. Printed Circuit Board Yields and Attaining a 6a Process... 20
1.6. Test Excellence Vision ... ... 21
1.7. My W ork-Study: One part Management, Two parts Engineering... . 22
1.7.1. One Part Management Opportunity ... 22
1.7.2. Two Parts Engineering Opportunity ... 22
1.8. Two Hypotheses... 23
1.8.1.1. Hypothesis 1 ... 23
1.8.1.2. Hypothesis 2... ... 23
1.9 . Sum m ary ... 23
1.10. Thesis Approach & Structure... ... 24
2. Chapter 2: Research Methodology... 27
2.1. Assess the Current Situation ... ... 28
2.2. Determine the Future State ... 28
2.3. Develop a Hypothesis ... ... 29
2.3.1. H ypothesis 1... ... 29
2.3.2. Hypothesis 2...30
2.4. Research and Literature Review ... 31
2.4.1. Component Quality Optimization Model ... 32
2.4.2. The PCBA Prioritization Algorithm ... 35
2.5. Summary ... 37
3. Chapter 3: Hypothesis 1 Results - The Component Quality Yield Optimization Model to achieve a 6a Yield Process ... 39
3.1. Introduction to PCBA Yield Calculation ... ... 46
3.3. The Component Quality Yield Optimization Model ... 49
3.3.1. Determine the 60 Budgets for Each Component ... 51
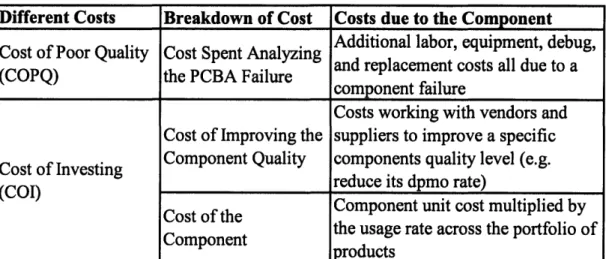
3.3.2. Calculated the Cost of Poor Quality (EI) for each PCBA... 57
3.3.3. Calculated the Cost of Investm ent ( 2) ... ... 57
3.3.4. Set up the Nonlinear Program and Optimize ... .... 59
3.4. Results and Application of the Component Quality Yield Optimization Model ... 62
3.5. Limitations of the Component Quality Yield Optimization Model ... 70
3.6. Future R esearch ... ... 7 1 3.7. Summary of the Component Yield Optimization Model... 72
4. Chapter 4: Hypothesis 2 Results - The PCBA Prioritization Algorithm using 6 ... 75
4.1. D efine: The Problem Statem ent... ... 75
4.2. Measure: The PCBA Prioritization Algorithm ... ... 77
4.2.1. Scoring each PCBA Based on Manufacturing Data ... 78
4.2.2. The Revenue & Demand Index Score (RDI) ... ... 82
4.2.2.1. RDI Factor 1 & 2 -Demand Forecast (a ) and Next Year (3) ... 82
4.2.2.2. RDI Factor 3 y , -Ratio of Volume to Cost ... 82
4.2.2.3. Putting the Revenue & Demand Index together ... 83
4.2.3. The Quality Index Score (QI) ... ... 85
4.2.3.1. QI Factor 1 -6 , The 60 OR Perfect Yield Delta ... 85
4.2.3.2. QI Factor 2 -E , The 6o OR Perfect Yield Delta 13 week Trend ... 86
4.2.3.3. QI Factor 3 -ý, The Cost of Poor Quality (COPQ) ... 86
4.2.3.4. QI Factor 4 -rl , Eliminating the Waste in the System ... 86
4.2.3.5. QI Factor 5 -0 , The Ratio of COPQ to Waste... 87
4.2.3.6. Other Costs to Consider ... ... 87
4.2.3.7. Putting the Quality Index together ... ... ... 87
4.2.4. The Customer & Management Index Score (CMI) ... 88
4.2.4.1. CMI Factor 1 -t, The Customer Experience... ... 89
4.2.4.2. CMI Factor 2 -K , The Market Importance ... 89
4.2.4.3. CMI Factor 3 -k, Quality Engineers' Expected Performance ... 90
4.2.4.4. Putting the Management and Customer Index together... 90
4.3. Analyze: Putting the PCBA Total Index Together using TOPSIS ... 92
4.3.1. TOPSIS-Step 1: Obtain PCBA Raw Scores & Determine the Ideal States...92
4.3.2. TOPSIS Step 2: Normalize the Raw Scores ... ... 94
4.3.3. TOPSIS Step 3: Weight the Normalized Scores ... .... 95
4.3.4. TOPSIS Step 4: Determine the Priority Index Based on the Ideal States...96
4.3.5. TOPSIS Step 5: Display the Index Scores ... ... 98
4.3.6. Apply General Priority Rules to the Total PCBA Index...99
4.3.8. Validate using 27 Extreme Corner Case Scenarios ... 104
4.3.9. Summary of the PCBA Prioritization Algorithm... 105
4.4. Improve: The PCBA Prioritization Algorithm and Overall PCBA Yields ... 106
4.4.1. Improvements using Different Weighting Scenarios...106
4.4.2. Improve PCBA Yields Today ... 10
4.5. Control: Monitor PCBA Metrics over Time ... 110
4.6. Summary... 111
5. Chapter 5: Organizational Design and Implementing Change ... 113
5.1. C om pany Intro ... 113
5.2. The Strategic Lens ... 115
5.3. The Political Lens ... 122
5.4. The Cultural Lens ... 126
5.5. Combining the Three Lenses ... 134
5.6. Sum m ary ... 135
6. Chapter 6: Conclusion ... 137
Table of Figures
Figure 1: General PCBA Manufacturing Process Flow... ... 15
Figure 2: Recent Cisco Acquisitions 2005 -2007 ... ... 17
Figure 3: Total Cost Curve and Associated Yield Fallout for Different Component Selections .68 Figure 4: PCBA Yield -Cost Efficient Frontier ... 68
Figure 5: Three Steps to Determine the Final PCBA Priority List ... 78
Figure 6: PCBA Prioritization Inputs ... ... 81
Figure 7: C alculating the R D I ... 84
Figure 8: C alculating the Q I ... ... ... 88
Figure 9: C alculating the C M I ... ... ... . 91
Figure 10: General Priority Rules ... 99
Table of Tables
Table 1: Select List of Components Used in Printed Circuit Board Assemblies... 39
Table 2: Costs Associated with Component Quality ... ... 41
Table 3: Component A's Quality Level and Cost for Each Quality Standard... 43
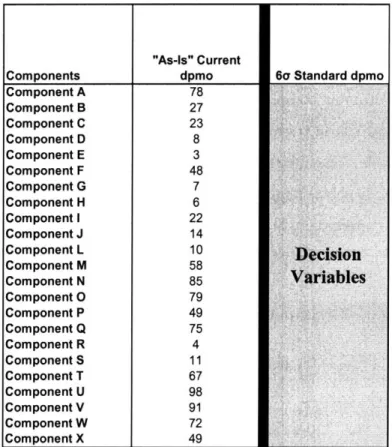
Table 4: Decision Variables to Determine 60 Component dpmo Budget ... 52
Table 5: Constraints for Determining 60 Component Budgets by Minimizing A2 ... 53
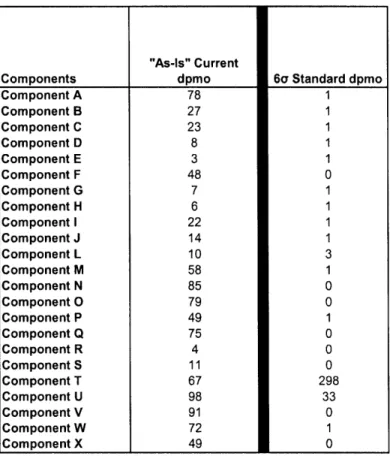
Table 6: 6c dpmo Budgets so Every PCBA Achieves a 60 Yield... 54
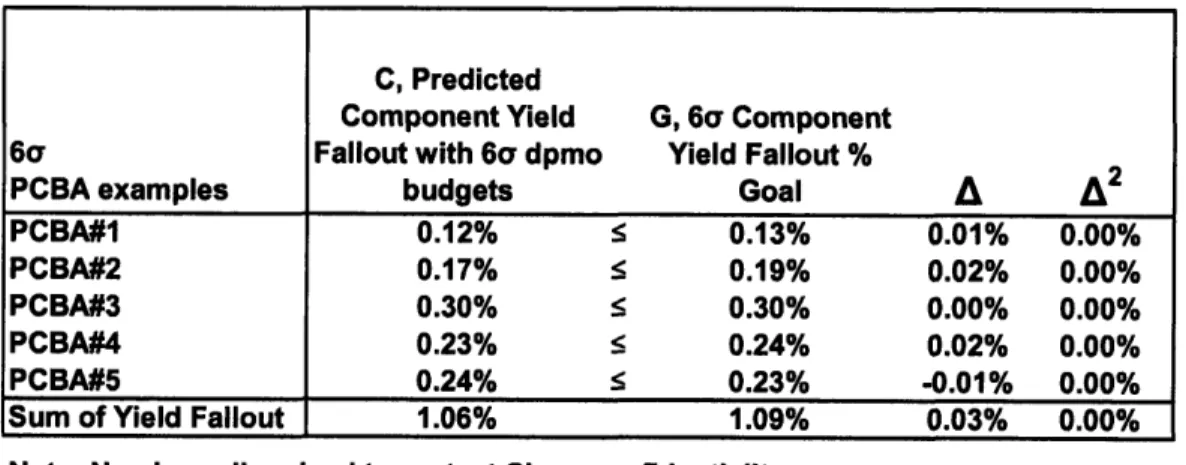
Table 7: Summary of "As-Is" dpmo Goals for 5 PCBA's Component Yield Fallout... 55
Table 8: Summary of the 60 dpmo Budgets for 5 PCBA's Component Yield Fallout ... 55
Table 9: Different Quality (dpmo) Levels for Each Component ... 56
Table 10: Cost of Investment, ' 2a Cost of Improving the Component Quality ... 58
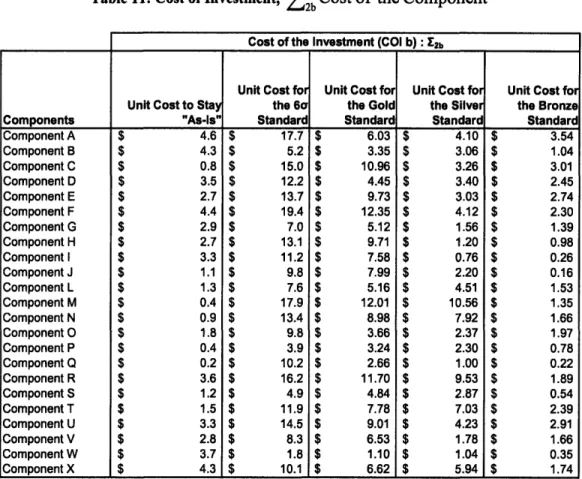
Table 11: Cost of Investment, ' 2b Cost of the Component ... ... 59
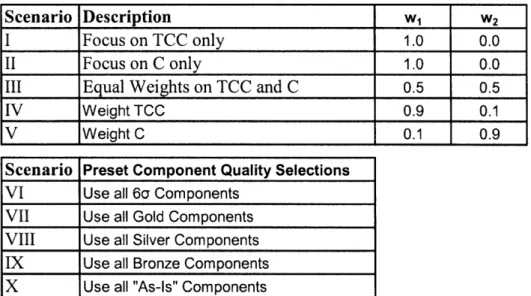
Table 12: Weighting Scenarios for the Objective Function... ... 60
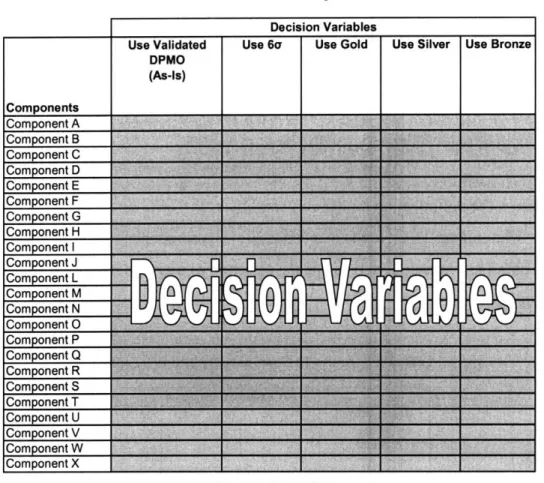
Table 13: Decision Variables for Optimization Model... ... 61
Table 14: Scenario I's Component Selection Results ... ... 62
Table 15: Summary of Scenario I's Optimization Results ... ... 63
Table 16: Scenario I's Component Yield Fallout Percentage by PCBA ... 63
Table 17: Scenario II's Component Selection Results ... ... 64
Table 18: Summary of Scenario II's Optimization Results... ... 65
Table 19: Scenario II's Component Yield Fallout Percentage by PCBA ... 65
Table 20: Summary of the Optimization Results for Scenarios I -V... 66
Table 21: Example of Manually Selecting All 60 Components ... 66
Table 22: Summary of the Results for Scenarios VI -X ... ... 67
Table 23: Important Manufacturing Factors Used to Calculate Each Index ... 80
T able 24 : Ideal States ... ... ... 93
Table 25: Ten PCBA Normalized Scores for Each Index ... ... 95
Table 26: Ten PCBA Weighted Scores for Each Index... ... 96
Table 28: Index Scores Based on the Priority Index... ... 98
Table 29: The PCBA Total Index with Comments ... 102
T ab le 30 : D O E M atrix ... ... 104
Table 31: DOE for 27 PCBAs ... 105
Table 32: 20 Randomized PCBA samples... 107
Table 33: Different Weighting Scenarios ... 108
Table 34: Different Weightings Scenarios Applied to 20 Randomly Sampled PCBAs... 108
Table 35: Weightings Scenarios Applied to 18 Revenue Generating DOE Extreme Cases ... 109
Table 36: Test Engineer Responsibilities within Different Manufacturing Departments ... 118
Table of Equations
Equation 1: Total Com ponent Cost... ... 41Equation 2: Functional Yield Equation for any PCBA... ... 47
Equation 3: Probability of PCBA Not Failing due to the ith Component ... 48
Equation 4: Calculating the Component Yield Fallout% using a Probabilistic Model ... 49
Equation 5: PCBA TCC Equation ... .... ... 49
Equation 6: C ost of Investm ent ... .. ... ... ... 50
Equation 7: Indices as a Function of the Factors ... .... .... ... ... 80
Equation 8: Normalizing Each Factor's Score ... ... 94
Equation 9: Calculating D ... .... ... .. ... 96
Equation 10: C alculating D + ... ... 97
1.
Chapter
1:
PCBA Introduction, Cisco, and Motivation to Change
1.1.
The
Importance
of Printed Circuit Board Assemblies
Imagine a world without electronics. No computers. No cell phones. No databases or social networks. No video games. Life would be very different. No e-mail. No e-Commerce. No Internet. No iPod. Companies like Google, Apple, Cisco, Intel, Microsoft, IBM, and Facebook would not exist as they do today. Life would be extremely different.
Today, our society greatly depends on electronics, and electronics greatly depend on printed circuit board technologies. As customers demand higher quality, more reliable products, manufacturing printed circuit boards at higher yield and quality levels will be much more critical. The invention of the microprocessor and the ability to compute and transfer data
circuitry gave birth to the information age and changed our world forever. The technology made it possible to deliver information amongst people, businesses, and governments at speeds faster than ever before. As Moore's Law drove better performing technologies at lower costs, new products took advantage and innovations rapidly occurred. People started to communicate in new ways: through bits and bytes, l's and O's, fiber optics, and satellites. Imagine how many industries, jobs, and markets electronic innovations have created. Software, hardware, networking, security, internet, search, mobile -and we are just getting started. Prices will continue to drop and future price decreases will stimulate future demand, and thus, increase innovation (Nystedt, 2008).
Printed circuit board assemblies (PCBAs) hold the fundamental circuitry to transmit analog, digital, or optical information. PCBAs enable information to be extracted, processed, analyzed, synthesized, displayed, and transferred amongst and between electronic devices such as
computers, cellular phones, mobile devices, modems, routers, internet switches, and digital cameras, allowing the world to stay connected while enabling innovations to occur faster than ever. PCBAs are the platforms that tie all these technologies together and are the central nervous system of electronics enabling the information age to rapidly expand and the world to flatten (Freidman, 2006). PCBAs are the fabric that has allowed the information age to exist and
expand, the digital revolution to occur and evolve, and Web2.0 technologies to be created and virally proliferate.
With more computing power available to more of the world, people, businesses, and
governments have been able to connect more easily while productivity has increased.' As PCBA technologies continue to keep pace with Moore's Law, PCBAs have become more complex and more powerful while decreasing in size and cost. This has allowed many new technologies to
start taking full advantage of current PCBA innovations -enabling the convergence of video, voice, data, and mobility into one single electronic device.
PCBAs are designed and manufactured for a variety of technologies and applications used around the world, and the electronics and information industries keep demanding better, higher quality products that are faster, cheaper, smaller, and greener. As products become smaller and demand more functionality, so to must the PCBAs. PCBAs evolve ahead of the product enabling new product innovations to occur. PCBAs continue to pack more technologies into a smaller and smaller area. As a result, PCBA complexity2 has dramatically increased and, therefore, so has
the number of defect opportunities (Oresjo, 2003). PCBA quality performance has been increasingly more important as the circuitry has become more complex requiring more components and solder joints than ever before. To remain competitive, PCBA manufacturing costs must remain low. Therefore, PCBA manufacturers must quickly learn how to produce more complex PCBAs at higher yields and lower costs (Tong, Tsung, & Yen, 2004).
Manufacturing these ever changing, increasingly complex PCBAs becomes more and more challenging as more sophisticated circuitry is introduced while the number of components per PCBA increases. Firms are constantly introducing new products and creating new markets with innovative products. Customers continue to demand higher quality products that are more reliable. Therefore, to remain competitive, PCBA manufacturing firms must produce a high yielding PCBA that translates into a high quality, highly reliable product. Utilizing the Six
1 Fine, Charles. MIT Lecture Notes. Spring 2008. Course 15.769: Operations Management.
Sigma (6c) philosophy of achieving 3.4 defects per million opportunities (dpmo), techniques such as DMAIC (define-measure-analyze-improve-control) will assist in improving PCBA yields (Bafiuelas & Antony, 2005, p. 251). The research and ideas for this thesis stem from a seven month work-study at Cisco Systems, Inc (Cisco) in San Jose, California. This thesis addresses methods that will help bring all PCBA yields one step closer to meeting the 60 yield goal. We will discuss Cisco and achieving a 6c process in more detail in sections 1.3 to 1.5, but first, let's quickly review the PCBA manufacturing process.
1.2.
The Printed Circuit Board Assemblies Manufacturing Process
PCBAs are designed and manufactured all around the globe. For instance, Cisco Systems is a networking company that designs, manufactures, and packages solutions that use multiple combinations of different types of PCBAs. PCBAs are manufactured and tested in several process steps simplified below in Figure 1.
Figure 1: General PCBA Manufacturing Process Flow
Place Solder
Manufacture
Components
Components
Test PCBA
PCB circuitryon PCB on PCB / to PCBto PC
First, on a non-conductive substrate, the printed circuit board (PCB) circuitry is manufactured, establishing the highways for electrons to travel between components. Next, components are placed in the correct position and orientation on the PCB. After correct placement, the components are securely soldered to the board to ensure they have proper connection to the circuitry. This printed circuit board assembly (PCBA) is then subjected to multiple tests. Several types of tests exist in manufacturing to determine the health of the manufacturing process. These tests can be classified as structural tests or functional tests.
These tests will determine if the PCBAs are made correctly, verify if the PCBA is properly assembled, both structurally and functionally, testing for as many opportunities that may cause the PCBA to fail. Once all the components are securely placed on the PCBA, several structural
tests run to determine if the components were placed in the proper location and in the proper orientation. Structural tests also check to make sure solder paste is applied correctly and that connections are mechanically sound. Structural tests look for potential short or open circuits that would cause the PCBA to fail and can also include stressing the board at extreme thermal and vibration conditions.
The functional tests verify that the PCBA works as it was designed to function. The number of
and the type of functional tests vary by product but generally run multiple diagnostics that electronically exercise all the components on the PCBA at various temperatures and voltages to ensure the PCBA remains functional at its specifications.
Testing is a non-value added step because it does not change the product in any way and increases the overall cycle time of the product. However, each test acts as an insurance policy that allows defective parts to be screened out of the process, and thus, reduce the amount of
lower quality product that could be delivered to customers. Additionally, the overall health of the manufacturing process is determined by the products' yields, which are calculated from test
data. Although tests are non-value added operations, the information extracted from the tests provides visibility into the manufacturing process and allows for improvements to be made. As more test information allows product yields to improve, tests can then be optimized (Oresjo,
2003) and even eliminated over the life cycle of the product.
As the electronics industry promises to delivery better quality products, quality excellence has come to the forefront of many PCBA companies. In the past, being the first mover and focusing on a time to market metric often competed with the product's quality. At Cisco, the company is engaged in a 60 effort to create a culture that prioritizes quality first. Through Manufacturing and Test Excellence Initiatives, Cisco strives to manufacture every PCBA in its portfolio at its 60 goal. Utilizing the information from current tests will allow the company to make certain
1.3.
Introduction to
Cisco Systems, Inc.
Cisco currently manufactures over 1,000 different types of printed circuit board assemblies per quarter all over the world. (See Chapter 5 for a much more in-depth organizational analysis of Cisco). Each printed circuit board assembly, or PCBA, in Cisco's portfolio has an associated
complexity to its design determined by the number of solder joints (known as interconnects), components, and other variables. Low complexity boards may have 200 interconnects and 10 components while high complexity boards may have over 40,000 interconnects and 5,000 components. Cisco's Test Excellence Initiative was kicked off in the summer of 2007 and has been tasked to implement the optimal tests process for each PCBA while improving overall PCBA yields for the entire Cisco product portfolio.
Cisco was founded in 1982 and to date has made 125 acquisitions with the most recent seen in Figure 2. Currently, the company is 100% outsourced with strategic in-house manufacturing centers. Cisco offers a wide variety of product complexity, from low end IP phones to very high end routers. Over 250,000 orders are processed every quarter on 196 active product families with over 23,000 product identification numbers. Additionally, there are 600 suppliers with
50,000 purchased part numbers.
Figure 2: Recent Cisco Acquisitions 2005 -2007 Category Topspl Alrespl IronF ,Il Consumer O Video 67% SApplicatlor 27% Secuiaty7% ' Data Center 4% T Mobility4% " Components <% 1_ _j ... __ __- Management
93% of these nvestments cat nw compettors - Softwarem 1% 6% are a correeve change in exisdng strtegy 1 Services 0.1%
<1% are foundation Investmentfor core business
Source: Gartner (January 2008)
As Cisco continues to grow, the supply chain complexity and scope of manufacturing grows too. However, to remain competitive, the old one-size-fits-all test philosophy that has helped make Cisco such as success must change. In order to remain competitive and low cost, an optimal
testing strategy must be implemented. But is it worth it to change for the sake of change, or are there external driving factors that require change to occur?
1.4.
Impetus for Change
Globalization is making the world flatter. Consumers and businesses want information on-demand, in real time, and in the palm of their hand. As the electronics industry continues to diversify into the consumer and commercial segments while focusing on the convergence of voice, video, data, and mobility, innovative products are pushing the limits of test requirements. Newer tests need to be developed and deployed to ensure high quality products meet customer expectations. At the same time, the industry aspires to attain 6Y quality and production
flexibility while controlling capital expenditure. To sustain a competitive advantage, manufacturing companies need to flawlessly delivery high quality products at the highest possible yield, utilizing an appropriate test suite that optimizes risk, affordability, and test coverage.
The current test strategy was intended to get Cisco to $40B in revenue by 2004, and it was very successful in its mission. However to remain competitive, Cisco believes that it is imperative to change the test strategy. As the company grew by acquisition, the test strategy did too. This 11 year old test strategy focuses on testing for escapes rather than designing in quality. It does not
significantly differentiate by product type or by product lifecycle stage. As Cisco moved to a 100% outsourced manufacturing strategy, the test strategy did not optimize across its network of contract manufactures and vendors.
The business and technology environment is right for change. Realizing that all competitive advantage is temporary (Fine, 1998), Cisco knows their test strategy must change. Cisco has a mission to continuously improve and drive manufacturing excellence. Thus, Cisco is dedicated to fostering an environment to achieve world class operations.
To understand and analyze any manufacturing process, tests must be completed. However, what is the right amount of testing that should be done to ensure the process is capable, efficient, and economical? Implementing tests in a manufacturing process incurs both cost and time, both of
which companies are quickly trying to reduce. Market pressures are driving prices down while customers are expecting their product to arrive quicker than ever before with higher quality and reliability. Therefore, it is imperative companies understand their test operations.
On one hand, if no money was spent on testing the process, products would have very low lead times. However, inevitable defects in the manufacturing process would be passed downstream and eventually to the field. These defects could result in failed parts, product recalls, and
ultimately lead to poor customer satisfaction and potential loss of market share. So, even though no cost was incurred with the physical tests at the manufacturing site, several costs will be incurred because of manufacturing defects that translate to field failures, product recalls, and customer dissatisfaction, otherwise known as the cost ofpoor quality (COPQ).
On the other hand, if a company were to spend unlimited funds on manufacturing tests, product costs and lead times would skyrocket. This, in turn, would lead customers to choose
competitor's products with lower prices and quicker lead times. Tests are a very important part of any manufacturing process. The data extracted from manufacturing tests help management understand the health of the entire process and detail critical indicators such as lead times, product yields, component defect rates, overall factory yields, and inventory levels. With cost pressures and emerging markets, it is very important to improve and sustain world class factory yields as defined by 6a yield performance.
So what is the optimal amount of test to support a 6a yield process at the lowest cost possible? This is exactly the question Cisco faces as the company embarks upon an initiative to modernize its testing philosophy. In the past, Cisco applied a one-size fits all test approach: Test
everything the same. The management team realized that this cookie cutter testing philosophy is not scalable and that changing the testing strategy is imperative for the company to sustain its competitive advantage. Cisco's launch of the Test Excellence Initiative will deliver these answers through many different projects. Achieving a 6a process will not happen overnight or with one project. No, this will be company wide, collaborative effort. This thesis focuses on two issues
of the many that will aid in attaining Sigma yields: (1) incoming components and (2) optimizing which PCBAs to improve first.
1.5. Printed Circuit Board Yields and Attaining a 6a Process
Tests are used in manufacturing to measure the health of the manufacturing process. These manufacturing tests calculate PCBA yields. Historically, Cisco yields were a "straight yield"
calculation, based on the number of bad products divided by total number of products produced. However, many different types of PCBAs can be manufactured on the same line and comparing yields of different complexity types of PCBAs is like comparing apples to oranges.
PCBAs range in complexity. Higher complexity products are used for more complex
applications. Typically, the higher the number of component and solder joints per PCBA, the more complex the PCBA. For example, PCBA-1 is a low complexity board with 200 solder joints, 10 components, and an annual volume of 1,000,000 units. On the other hand, PCBA-2 is
a high complexity board with over 40,000 solder joints, more than 5,000 components, and an annual volume of 100 units. Both PCBA-1 and PCBA-2 could be manufactured on the same line, so comparing their "straight yield" calculation does not make sense.
Today, Cisco normalizes PCBA yields by taking many different variables into account when making the final yield calculation. Namely, solder joints and components make up a large percentage of potential opportunities for yield fallout, but there are many other variables
responsible too. This thesis focuses on understanding how component quality will affect overall PCBA yields. Improving component quality will assist in allowing Cisco to achieve 60
manufacturing process across every product it manufactures.
A 60 process is based on statistics and is defined as 3.4 defects per one million opportunities (dpmo), often referred to as 3.4 dpmo. Products that yield worse than 3.4 dpmo produce
unnecessary waste in the manufacturing system. The waste comes in many different forms such as products that are scrapped, failures at the manufacturing site, or returns by the customer and should not be passed along in the system (Ohno, 1988). For every type of waste event, there is an incurred cost, and the cost increases as the product moves downstream in the manufacturing process. Thus, a customer return is the highest cost, the most detrimental type of waste.
To eliminate the waste in the system, Cisco must invest money to improve their capabilities (Repenning & Sterman, 2001). Spending money earlier in product development and
implementing optimal tests in the manufacturing process will create higher quality products that will achieve the targeted 3.4 dpmo. This goal will ultimately eliminate unnecessary waste in the system and allow high quality products to be delivered to customers.
Achieving a 6a process is easier said than done, especially as PCBA complexity increases. First, if a PCBA is to achieve a 6a process, the PCBA must have 3.4 dpmo or fewer. What is a PCBA opportunity? If we assume that any one item on a PCBA can cause a failure, then every item is one opportunity.
Imagine two examples, 1) a PCBA with 100 opportunities and 2) a PCBA with 70,000
opportunities. In the first example, one failure would make this specific board have 1 defect in 100 opportunities, or 10,000 dpmo. Thus, if one million of these boards were made, 10,000 would be thrown away. To achieve a 6a process, example 1 should only have 0.00034 defects per 100 opportunities, or an improvement of nearly four orders of magnitude. In the second example, one failure would make this specific board have 1 defect in 70,000 opportunities, or
14.29 dpmo. To achieve a 60 process, example 2 should only have 0.238 defects per 100 opportunities, or an improvement of one order of magnitude.
These examples are not unrealistic and represent the challenges Cisco faces in becoming a world class PCBA manufacturer. However, improving the design and manufacturing process in the PCBA industry to be capable of achieving a 60 process is going to take money, time, and a cultural paradigm shift.
1.6.
Test
Excellence
Vision
The Test Excellence Initiative will drive the 6a culture change. Cisco has embarked on a journey to ensure future success through this company wide, collaborative initiative. Test
Excellence is meant to provide a venue to foster an environment to become a world class, 60 manufacturing firm. Utilizing the current business environment and the impetus for change, Test Excellence will create a paradigm shift within the company and ultimately a new way of thinking
across Cisco. Test Excellence is intended to become part of Cisco's DNA, and ultimately, Cisco envisions that every PCBA it manufactures will achieve its 6o yield goal while optimizing risk, affordability, and test coverage.
1.7.
My Work-Study: One part Management,
Two
parts Engineering
The Test Excellence initiative will modernize the current test strategy preparing Cisco's test infrastructure to capitalize on the anticipated growth for Web2.0 and beyond. My work-study focused on designing a world class test strategy and governance model to enable an agile, aligned, and adaptive supply chain.
1.7.1. One Part Management Opportunity
At the crux of the internship, I managed the entire Test Excellence Initiative and participated on the four main sub-teams. The initiative fostered communication channels within the company to create new ideas and help with the paradigm shift to become world class in manufacturing high quality, 6o PCBA products. The team was composed of four man Cisco
divisions: Cisco Design Organization, Product Operations, Manufacturing Operations, and Technology and Quality.
1.7.2. Two Parts Engineering Opportunity
During my participation on the core and sub-teams, I found opportunities for improvement, specifically, in yield management. First, it is not well understood how different components affected the overall yield of PCBAs. What quality level is needed for each component to achieve the overall 6o yield goal? Second, I found that yields were managed at local levels rather than as a portfolio of products. Therefore, it was difficult to find the best and worst performing PCBAs across the different manufacturing sites. These two engineering challenges help form my two hypotheses for this thesis.
In short, the end goal of Test Excellence is all PCBAs yielding at the 60 goals with an optimal test plan that evolves over the product's lifecycle. On the journey to this ideal state, it is
imperative to first understand the effect of components quality on overall PCBA yields, as well as understand the current state of product yields across the company's manufacturing footprint.
1.8.
Two Hypotheses
Before the company can optimize manufacturing tests plans across all their products and improve yields, it is necessary to first look at how component quality affects yields. With this understanding, tests can then be added, eliminated, or changed on a product by product basis to align the tests to the market demands. Additionally, as the test plans evolve over the product's lifecycle, managing test yields for the entire product base is needed to help better optimize test development in the future. Therefore, this thesis details two hypotheses that are inputs into optimizing the test over the lifecycle.
1.8.1.1. Hypothesis 1
Hypothesis 1: The Component Quality Yield Model Hypothesis
Yields and costs can be optimized for an entire portfolio of PCBA products by selecting the appropriate components based on component quality and cost specifications.
1.8.1.2. Hypothesis 2
Hypothesis 2: The PCBA Prioritization Algorithm
Overall PCBA yields will improve by optimally allocating manufacturing resources to a holistically prioritized list of PCBAs across the entire portfolio.
1.9.
Summary
In this introductory chapter, we looked at why PCBAs are so very important to our society and how PCBAs are manufactured. We took a closer look at Cisco and noted the business
environment supports the change to achieve a world class, 60 PCBA manufacturing process. Supporting the need to change, Cisco has launched an internal Test Excellence initiative to implement a new test strategy to ultimately improve product yields while lower manufacturing costs.
While working on the Test Excellence initiative during my seven month work-study at Cisco, I uncovered specific yield issues that allowed the formation of two hypotheses to improve overall PCBA yields. Vendor component quality effects yield fallout, but the magnitude of yield fallout as a function of the number and type of components is not fully understood. Additionally, Cisco does not prioritize the PCBAs across the company's portfolio but rather allows over 110
specialized local teams to resolve yield issues with very little or no best practice sharing among teams. This thesis further details how component quality affects each PCBA's yield while also deriving a prioritization algorithm for the entire product portfolio to help local teams focus
attention on the most important PCBAs first. Finally, this thesis will analyze Cisco's organizational design to understand how the firm will react to changes driven by Test Excellence.
1.10.
Thesis Approach & Structure
This thesis is divided into several chapters. Research used for this thesis involves industry experts from Cisco, a thorough review of academic and industry literature, and guidance from my advisors. As Chapter 1 discussed, this work-study was divided into two separate threads that I worked on concurrently. The first thread involved the participation the Test Excellence
Initiative, a significant change management program to revamp the entire test strategy at Cisco. The second thread involved more engineering work that involved identifying certain yield issues and recommending a solution, both of which stem from the two hypotheses.
Chapter 2 describes the research methodology for this thesis and how the hypotheses were
developed. This chapter also contains a literature review for both hypotheses. The work performed at Cisco was used as a backdrop for the management and engineering thesis study.
Chapter 3 details the analysis of the first hypothesis, the effect of component quality on overall
PCBA yields. This chapter further investigates how Cisco can use a nonlinear program to make better management decisions when determining which components to use based on cost and quality. Chapter 3 ends with recommendations for future research in this particular area.
Next, Chapter 4 details the analysis of the second hypothesis, an algorithm to prioritize manufacturing resources to resolve yield issues on printed circuit board assemblies with the highest return on investment. The tool allows management to holistically analyze its portfolio of products based on a ranking system which will help optimize how it utilizes its manufacturing resources to resolve the most important yield issues first. The ranking system is based on three key inputs: (1) Revenue & Demand data, (2) Quality data, and (3) Customer & Management data. Chapter 4 ends with recommendations for future research in this particular area.
Chapter 5 further discusses Cisco's organizational design. This chapter looks at Cisco from
three different perspectives: (1) The Structural Lens, (2) The Political Lens, and (3) The Cultural Lens. It then hones in on how the organization is ready to adopt the tools from this thesis.
Finally, Chapter 6 concludes the thesis with a summary of the Component Quality Yield Model, the PCBA Prioritization Algorithm, and Organizational Design analysis.
2. Chapter 2: Research Methodology
The two hypotheses for this thesis were developed as Cisco embarked upon a major change initiative to create a new test strategy. Cisco's original test strategy was very successful in enabling the company to achieve its current goals; however, in order to remain competitive, the company's leaders realized the current test philosophy needed change. One aspect of the new test strategy demanded that all PCBA yields meet their 6a yield goals. Therefore, finding solutions to improve overall PCBA yields became a main priority of the overall change initiative. To enable 6a yield goals to be met on every
PCBA manufactured requires company wide support and multiple solutions.
Consequently, this thesis is one of many first steps on the journey to achieving 60 yield goals for every PCBA, and the results from these two hypotheses are just pieces of a bigger puzzle.
The first hypothesis studies the effect of component selection on overall PCBA yields. The second hypothesis investigates the optimal way to prioritize manufacturing resources on many PCBAs to quickly improve yield issues. The two hypotheses lead to working solutions that will enable Cisco to step closer to achieving a 6a process for all PCBAs. Additionally, utilizing these solutions will enable future improvements to occur down the road.
Developing the hypotheses required full participation in the change initiative and then a detailed investigation of current problems. As a result, the first half of the work study focused on implementing change within the organization while the second half
concentrated on solving more specific engineering problems. Therefore, before diving into the two hypotheses, the following sections will discuss the methodology behind the change management initiative.
At the beginning of the work study, Cisco kicked off the Test Excellence initiative to revamp its current test strategy. The Test Excellence's change management process enabled multiple meetings with current employees to collect data, understand the current
situation, and develop, test, and validate specific hypotheses. Finally, from many potential hypotheses, two hypotheses were studied in greater detail. These hypotheses were created, developed, and implemented through the following steps:
* Assess the current situation * Determine the future state * Develop a hypothesis * Research
2.1.
Assess the Current Situation
To fully understand the problems associated with the current test strategy, multiple interviews were conducted across the entire organization. The interviews were intended to find major problems and improvement areas while understanding how the underlying organizational strategy, culture, and political playing fields shaped the current situation. Chapter 5 further examines the company based on the strategic, cultural, and political three lens analysis (Carroll, 2006). After 153 interviews, a small team composed of
about fifteen individuals from across the organization worked to create a new test strategy during several full day working sessions. The new test strategy's goal was to guide the organization to collaborate across divisions while developing optimal solutions for the major problems which currently existing with today's strategy. Several key improvement areas surfaced during these all day working sessions, one of which was improving overall PCBA yields.
2.2.
Determine the Future State
The new test strategy was deployed to the organization through the Test Excellence change initiative. The Test Excellence initiative consisted of 50 people from across the company, fostering an environment ideal for collaboration and change. In order to improve PCBA yields, the team focused on defining the future state for all PCBA yields. With the help from Cisco's leadership team, the future state would be to achieve the 60
yields goal for every PCBA.3 Additionally, every PCBA should be sustained at its 60
yield goal over its entire product lifecycle. The 60 yield goal allows Cisco to measure its progress throughout the Test Excellence initiative as well as compare different business units and manufacturing sites within the organization. Eventually, the process will enable the company to share best practices and become a world class PCBA manufacturer. Furthermore, achieving 60 yield goals will eliminate waste in the system while improving product quality and customer satisfaction.
Achieving 60 yield goals on every PCBA is quite challenging since many variables contribute to the overall yield of a particular PCBA. Therefore many solutions could exist. Thus, a specific yield subteam formed to brainstorm solutions. Further detailed interviews were conducted with key stakeholders that concentrated on how yields could be improved. These interviews discussed several potential hypotheses in further detail and then determined which solutions would be worth pursing. The results from the interviews became the foundation for developing the two hypotheses for this thesis.
2.3. Develop a Hypothesis
Improving overall PCBA yields is a current challenge and many potential solutions to the problem exist. From PCBA designs to component selections to manufacturing processes, many different variables affected the overall PCBA yield. After interviewing key
stakeholders and working on several teams with PCBA yield experts, two main themes developed that suggested next steps for a detailed investigation. Thus, these topics were the foundation for the two hypotheses in this thesis.
2.3.1. Hypothesis
1
Improving yields is a significant part of becoming a world class manufacturing firm. With so many factors contributing to yield fallout, this thesis focuses on analyzing how component selection impacts overall yields. Managers questioned what component
quality levels were needed to achieve a 60 process. Thus, understanding how components affect overall PCBA yields became a major concern and the basis for hypothesis 1.
Hypothesis 1: The Component Quality Yield Model Hypothesis
Yields and costs can be optimized for an entire portfolio of PCBA products by selecting the appropriate components based on component quality and cost specifications.
A probabilistic model was built to predict yield fallout caused by component defect rates.
Using the bill of materials for several PCBAs, the number and type of components were entered into the model. Several categories of component quality levels were defined, such as the Gold, Silver, and Bronze standards. These different quality standards
represent the different choices that the firm can use for each component. Then, working with a component quality expert, incremental costs to achieve these different component quality levels were derived.4 Finally a nonlinear program optimizes overall PCBA yields based on incoming component quality and cost variables. The model and results are
further discussed in Chapter 3.
2.3.2. Hypothesis 2
At the same time, PCBAs were not holistically prioritized across the entire product portfolio but rather prioritized differently at each local site. For example, out of over 1000 PCBAs, it was not well understood which PCBAs needed immediate attention to improve the current yield, or, in other words, which PCBAs had the highest return on investment for yield improvements.
Because of manufacturing resource constraints, not every PCBA can be worked on
simultaneously. Manufacturing resources would be assigned to PCBAs with yield issues, but the process was contained at the local manufacturing site level, completed in an
hoc fashion, and varied drastically across manufacturing locations. Determining the appropriate prioritizing algorithm across all the PCBAs would ensure the PCBAs with the yield issues and highest return on investment for yield improvements were worked on first. This became the foundation for hypothesis 2.
Hypothesis 2: The PCBA Prioritization Algorithm
Overall PCBA yields will improve by optimally allocating manufacturing resources to a holistically prioritized list ofPCBAs across the entire portfolio.
Using a Six Sigma-DMAIC approach, the PCBA Prioritization Algorithm was developed: * Define the problem statement
* Measure each PCBA and assigned an index
* Analyze the list of PCBA and prioritizes each PCBA accordingly
* Improve the manufacturing yields quickly while also improving the algorithm to ensure the most important PCBAs are worked on first
* Control and monitor PCBA yields over time
Working with a team of engineers, the algorithm to prioritize all the PCBAs was developed. The algorithm is further discussed in Chapter 4.
2.4. Research and Literature Review
The two hypotheses in this thesis utilize management decision science. The decision science field is broad and has been growing across industries to enable management teams to make optimal business decisions. Ragsdale discusses several methods in management science such as optimization, linear programming, network modeling, integer and nonlinear programming, and decision analysis (2004). Structured problem solving offers more insights into the problems; and, as compared to an unstructured approach, it is reasonable that better business decisions will occur more frequently with higher probabilities (Ragsdale, 2004).
The next sections discuss the relevant academic literature review and industry benchmarking for each hypotheses.
2.4.1. Component Quality Optimization Model
Based on management sciences and operations research, several engineers have developed optimization techniques in the PCBA industry. The many papers and models can be summarized in three broad categories:
* Optimizing Tests
* Optimizing Manufacturing Processes * Optimizing PCBA Designs
Optimizing Tests.: When optimizing tests in the PCBA manufacturing process, Stig
Oresjo analyzes the trade-offs amongst different types of structural tests (2003). The paper discusses how PCBA complexity, manufacturing process, and test objectives
are important in determining the optimal strategy. The test strategy should account for overall test coverage, affordability, and effectiveness. Making the proper, optimal decisions will "result in higher quality, lower warranty, repair, and scrap costs" (Oresjo, 2003, p 16).
Optimizing Manufacturing Processes: Ellis, Vittes, & Kobza's discuss ways to
optimize the sequence for correctly placing components using surface mount placement machines (2001). And, Tong, Tsung, and Yen specifically studied the effects of using a DMAIC style approach to optimize the manufacturing solder paste process capabilities through statistical process control and designs of experiments to achieve a 6y performance process (2004).
Optimizing PCBA Designs: Gilbert, Bell, & Johnson propose circuit design
optimization techniques using statistical analysis and Monte Carlo simulations which give designers visibility into how their specific design and component parameters impact the total cost (2005). Similarly, at a different electronics company,
ensure the final design would meet certain manufacturing specifications for yield and quality.5
Although the PCBA industry utilizes several different optimization techniques to improve test, performance, and design to improve yields, no one optimization method focuses specifically on component selection to improve yields. Therefore, looking at other industries, optimization techniques for selection processes can be found.
The finance industry uses optimization models when deciding which asset classes to invest in when creating an optimal portfolio (Brealey, Myers, & Allen, 2006). With a broad array of choices, portfolio managers need to make decisions that will allow their portfolio to remain on the efficient frontier of increasing returns while reducing risk. Nonlinear programming models enable the finance industry to make optimal decisions to best maximize these returns. In the PCBA industry, choosing
components based on quality levels and costs is very similar to choosing different assets based on returns and risk.
Moreover, a look into the automotive industry offers several best practices the PCBA industry can utilize. "Before Toyota or Honda retains a supplier, it scrutinizes the supplier's production process and costs structure" (Arrufiada & Vizquez, 2006, p142). PCBA manufacturers can apply the same strategy when dealing with their suppliers. Additionally, Toyota has worked with their suppliers to improve their processes. Denso, for example, is responsible for much of Toyota's components, and Toyota takes a very active role in the production process to ensure the quality level remains high. In fact, Toyota owns a 25% share of Denso (Brooke, 2005) to ensure its component quality levels are consistent. By working collaboratively with their
suppliers, Toyota enables its own products to meet higher quality standards demanded by the customer. Furthermore, back in the 90s, Toyota worked with US Chip makers to develop high quality electronic products for future automobiles (Markoff, 1990).
With more electronics designed into automobiles, the need to use highly reliable components is very important. Therefore, Toyota has even helped fund a
semiconductor factory for Texas Instruments (Polluck, 1996), (Bruns, 2003) to play an active role in managing their electronics supplier. Within the PCBA industry, there are hundreds of suppliers. The automotive industry lends keen insights into how to better work with suppliers to improve the overall supply chain. Perhaps, the big PCBA players could gain more control over component quality if they actively
invested and worked with suppliers to improve design, manufacturing process, and supply chain issues.
Fine argues that firms should utilize 3D concurrent engineering (1998) to
simultaneously design the product, the processes, and the supply chain. Doing so will enable world class products, reinforce the companies core capabilities, and deliver value to the customer (Fine, 1998). Additionally, industries should continue to utilize Six Sigma and Design for Six Sigma methods earlier in the design process (Bafiuelas & Antony, 2005). This ensures more products will meet manufacturing yield and quality goals sooner. To improve component selection processes, optimization methods used in the finance industry can be applied. To improve the supply chain, PCBA firms can more actively work with their suppliers. By focusing on 3DCE the PCBA industry can continue to better improve their product performance to ensure 60 levels are met.
In 2000, Clive Ashmore wrote an article describing how the electronics industry is moving from SPC to dpmo as a superior means to measure defect rates. Through various Six Sigma techniques, the PCBA industry has implemented methods and practices to achieve better yields. In 2005, Stig Oresjo laid out a step by step test process for determining the optimal test process. He covered how the optimal solution really depended on "defect levels (or dpmo rates), board complexity,
manufacturing volumes, different test solutions, test effectiveness and desired quality levels" (2005, p. 50). Just as a financial portfolio can be optimized, this thesis really
focuses in on quality levels and how selecting the right component based on quality levels and costs can be optimized.
Moving forward, the PCBA industry can borrow practices from Toyota and move the quality improvements up the supply chain by working collaboratively with their suppliers. As Skinner stated in 1969, "The purpose of manufacturing is to serve the company -to meet its needs for survival, profit, and growth" (p140). Cost, time, and customer satisfaction (Skinner, 1969) are still very important in today's
manufacturing world. Today, 3D concurrent engineering (3DCE) summarizes these same lessons where supply chain, product, and process improvements occur at the same time (Fine, 1998).
The optimization will allow a firm to ensure it is on the efficient frontier for quality and cost when selecting components while aspiring to achieve a 60 performance process. If the firm needs help to achieve higher quality standards, the optimization model lends itself to be a tool for firms and suppliers to work collaboratively on the problem. Thus, the Component Quality Yield Optimization Model is a decision making method based on 3DCE and Six Sigma principles that will positively affect the design, process, and supply chain.
2.4.2. The PCBA Prioritization Algorithm
When seeking to understand how to prioritize hundreds of different products across many different attributes, several types of decision making processes exist. Ragsdale (2004) details several decision analysis techniques and methods such as:
* Multi-Attribute Utility Theory (MAUT) * Analytical Hierarchy Process (AHP)
* Multiple Objective Decision Making (MODM) * Multiple Attribute Decision Making (MADM)
Hundreds of research papers have been written describing the benefits of using the decision making methods. There are many applications for using these decision techniques. For instance, Teixeira de Almeida discusses how using the MAUT
technique in deciding which contracts to outsource (2007). Ahn & Choi use the AHP technique to analyze a group selection of an appropriate enterprise resource planning system where the exact solution is needed rather than a probabilistic solution (2007). Van Hop & Tabucanon use both MODM and MODM to resolve the complexities for the set-up problem for multiple machines in a PCB assembly line (2001). AHP and MODM both are based on optimizing several objective functions to find the best solutions. Shanian & Savadogo noted that a MODM analysis would offer one solution for one function that may not be optimal for another objective function, so it becomes difficult to find the best solution (2006).
Therefore, Shanian & Savadogo (2006) use the MADM method called the Technique of Ranking Preferences by Similarity to the Ideal Solution (TOPSIS), introduced by Yoon & Hwang in 1980 to select appropriate material for a fuel cell. The TOPSIS technique works well with a finite set of attributes (Shanian & Savadogo, 2006). TOPSIS has been used across industries as a decision making process for many
different types of problems. TOPSIS enables the proper decisions based on limited subjectivity (Olson, 2004). According to Olson, TOPSIS provides useful decision making techniques for several applications such as deciding which materials to use
for a specific application; where to spend manufacturing capital or make certain financial investments; which manufacturing or robotic processes to use; and even comparing company and financial performances (2004, p ).
The TOPSIS logic establishes a good foundation for defining the logic to rank hundreds for types of PCBAs appropriately based on specific attributes. Each selection is based on a set of attributes as defined by the firm. Shanian & Savadogo offer general considerations for using TOPSIS and why I support using TOPSIS to ranking a list of PCBAs:
* An unlimited range of performance attributes can be included * Explicit trade-offs between different attributes can be accounted for
appropriately
* AHP Pair-wise comparisons are avoided, which is useful when dealing with a large set of choices and attributes
* Each attribute can be weighted as defined by the firm * The procedure is systematic, simple, and fast
In the PCBA industry, many methods are used to prioritize PCBAs with
manufacturing yield issues. Many are based on local site best practices. However, no holistic prioritization across the firm existed, making it very difficult to know which PCBAs in the entire product portfolio required the most resources now. Therefore, developing a priority list for every PCBA will greatly benefit the firm. Thus, the TOPSIS technique enables an effective approach for deciding which PCBAs are most important to work on first.
2.5.
Summary
Chapter 2 reviewed the methodology for developing the hypotheses for this thesis. My internship at Cisco provided the backdrop necessary to collect the data and discuss the hypotheses in further detail. Additionally, this chapter reviewed current industry and academic research in decision sciences pertaining to this thesis.
The following chapters will discuss the two hypotheses in further detail starting with the Component Quality Yield Model and how different choices in components impact overall PCBA yields. Subsequently, Chapter 4 details The PCBA Prioritization Algorithm.
3. Chapter 3: Hypothesis
1
Results - The Component Quality
Yield Optimization Model to achieve a
6a
Yield Process
Recall Hypothesis 1: Yields and costs can be optimized for an entire portfolio of PCBA
products by selecting the appropriate components based on component quality and cost specifications.
When designing a product, there are vast arrays of components from which to choose in order to meet the final product's specifications. Cisco, for example, has 196 active product families with 23,000 product identification numbers from 600 different suppliers and 50,000 components from around the world.6 Components are critical to the PCBA's
performance, and, therefore, the PCBA's intended use will determine which components are used and how many components are needed. Below, Table I summarizes the most common types of components found on any given PCBA.
Table 1: Select List of Components Used in Printed Circuit Board Assemblies
Different types PCBA Components
Application Specific Integrated Circuits (ASICs) Light Emitting Diode (LED) Board Mount Power (BMP) Linear Devices
Content Addressable Memory (CAM) Logic Devices
Capacitors Magnetics
Clocks Microprocessors
Connectors Optical Connectors
Data Communication Devices Oscillators
Diodes Programmable Logic Devices (PLD)
Dynamic Random Access Memory (DRAM) Resistors
Erasable Programmable Read Only Memory (EPROM) Static Random Access Memory (SRAM)
Flash Memory Transistors
Designers will select the proper component for the proper function based on several criteria, such as performance and technical specifications required by the customer. Depending on how high or low tech the product may be, any given component will vary in both price and quality. Furthermore, once the product ramps from the design phase to