2019 1st International Conference on Sustainable Renewable Energy Systems and Applications (ICSRESA), December 04-05, 2019, Tebessa, Algeria
Early fault detection of gear system based on Wavelet
Packets Transform
Mouloud Ayad Departement of electrical engineering LPM3E Laboratory, Faculty of sciences
and applied sciences, University of Bouira, 10000, Algeria [email protected]
Ahmed Amine Kebir Departement of electrical engineering LPM3E Laboratory, Faculty of sciences
and applied sciences, University of Bouira, 10000, Algeria [email protected]
Mohamed Rezki Departement of electrical engineering LPM3E Laboratory, Faculty of sciences
and applied sciences, University of Bouira, 10000, Algeria [email protected]
Kamel Saoudi Departement of electrical engineering LPM3E Laboratory, Faculty of sciences
and applied sciences, University of Bouira, 10000, Algeria [email protected]
Mourad Benziane Departement of electrical engineering LPM3E Laboratory, Faculty of sciences
and applied sciences, University of Bouira, 10000, Algeria [email protected]
Abderrazak Arabi Departement of electrical engineering, Faculty of sciences and applied sciences,
university of Bouira. LIS Laboratory, University of Sétif1,
19000, Algeria [email protected]
Abstract— at present, monitoring of industrial systems is fundamental. The detection of defects in early stage avoids several catastrophic problems. If these defects are not detected early, the system will be degraded. Various techniques are used for this reason in the literature. The most one used is vibratory analysis. In vibratory analysis, each defect lets a signature of presence of defect. In this purpose, our goal is to propose an approach for the detection of this signature. This approach is based on Wavelet Packets Transform (WPT).
Keywords— detection of defects, Wavelet analysis, WPT, Crack of tooth.
I. INTRODUCTION
The role of gears in industrial systems is the transmitting of movement or mechanical energy between two shafts according to a speed ratio. The vibration signal delivered by these gears can be damaged by the operating conditions (speed, load, etc.). Gears are highly affected in mechanical energy transmission systems. The materials used vary depending on the use. A monitoring and diagnosing gear system fault is essential to prevent a serious defect in mechanical systems. Monitoring information can be used for planning maintenance activities.
Vibration analysis based on signal processing tools is an effective approach for the analysis, detection and diagnosis of faults in gear systems. According to Li [1], 80% of machine transmission system defects are caused by gear failure; therefore the detection of defect in early stage is very important and even critical.
Spectral analysis based on the Fourier transform has been the most used tool for processing the signals emitted by systems. This conventional technique remains limited since most of the signals contain transient or non-stationary characteristics. These characteristics are the most important part of the signal and the Fourier analysis is not suitable.
During the transformation to the frequency domain by spectral analysis, the time information is lost, so we are unable to define when an event is appear. Therefore, a new method which is the wavelet transform is appeared. This technique has a good localization property in time and frequency.
The use of time–frequency domain proves his importance. Several methods are proposed for this purpose for example the distribution of Wigner–Ville [2] and STFT (Short Time Fourier Transform) [1, 3]. However, these methods offer a constant resolution for the analysis of the whole signal. Consequently, to surmount this problem, the wavelet analysis is appeared. The wavelet packet is a generalization of the wavelet transform. They allow a more detailed analysis which is not the case in Fourier transform.
The main purpose of this paper is to use the approach of vibratory analysis by the use of wavelet packets as a tool for investigating the presence of defect. To demonstrate the effectiveness of the approach, the wavelet packet is used on real vibration signals obtained from a gear system.
II. THEORETICAL BACKGROUND
The idea of the wavelet is to vary the widths of a function in time and in frequencies by translating it along the signal as in STFT transform. The Wavelet Packet approach is obtained by generalization of the wavelet analysis.
The property of the time and frequency localization in time and in frequency is very important and wavelet transform provides this property. Therefore, this transform is very useful for vibration analysis.
The continuous wavelet transform of any signal x(t) is obtained by:
+∞ ∞ − −−
=
dt
a
b
t
t
x
a
WT
1
1/2(
)
ψ
*(
)
(1) Where:(*) is the representation of a complex conjugate function. ψ : is the mother wavelet [4] given by:
( )
1
(
)
,a
b
t
a
t
b a=
ψ
−
ψ
(2)(a): Dilation parameter. (b): Translation parameter.
The translation parameter controls the shifting position of the wavelet and the dilation parameter controls its length and its vibration frequency [5].
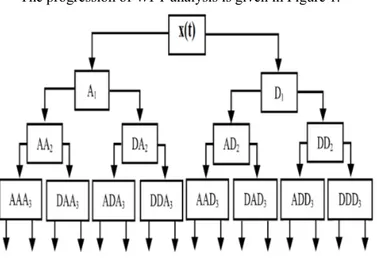
The progression of WPT analysis is given in Figure 1.
Fig. 1. Decomposition of the signal x(t) by WPT.
As shown in Figure 1; the process of wavelet packet transforms is based on the use of two filters to separate the signal x(t) . The first one is low-pass filter (H) and the second one is high-pass filter (G).
In Figure 1, the blocks A are the approximations sub-band and the blocks D are details sub-band decomposition with wavelet packet transform. Wavelet packet transform analysis is given as follow [6]:
−
=
−
=
∈ ∈)
2
(
2
)
(
)
2
(
2
(t)
jk
t
G
t
k
t
H
Z k k j Z k kφ
φ
ψ
φ
(3)φ(2t-k): the orthogonal level function.
These two filters are used to separate the signal x(t) into two parts (A1 and D1). The obtained parts itself are separated in two parts and so (see the Figure 1).
III. EXPERIMENTAL VALIDATION
A. System under study
In this paper, the main goal of this work is to use the approach of vibratory analysis by the use of wavelet packets as a tool to find the presence of defect. To demonstrate the effectiveness of the approach, the wavelet packet is used on the vibration signals carried out at C.E.T.I.M center (Centre d’Etudes Techniques des Industries Mécaniques) [7].
Fig. 2. Representation of the system used [8].
The studied mechanical system is given in Fig. 2. It is composed of gear and pinion of 20 and 21 teethes. The mechanical system is operated 24h/24h under the same condition. At the experiment test, one of the teeth was affected. The dynamic and geometrical parameters of the mechanical system are presented in Table 1 [8].
TABLE I. DYNAMIC AND GEOMETRICALPARAMETERS OF THE
MECHANICAL SYSTEM.
Different parameter For pinion For gear
Speed (rpm) 1000 952 Number of teeth 20 21 Face width (mm) 150 30 Shaft diameter (mm) 92 110 Module (mm) 10 10 Pressure angle 20° 20° Addendum coefficient 1.0 1.0 Dedendum coefficient 1.4 1.4 Mass (N) 36 80
Shaft torsional stiffness (N m/rad) 1917 3383 Bearing stiffness (N/m) 108 109 Shaft viscous damping coefficient
(N s/rad) 0.2688 0.3571
Bearing viscous damping coefficient
(N s/m) 8740.15 8740.15
The frequency of the vibration signal is given by the equation: 2 2 1 1
.
f
N
f
N
f
e=
=
(4) Where: 1f
the rotation frequency of the pinion.2
f
: the rotation frequency of the gear.1
N
: the number of teeth of the pinion.2
N
: the number of teeth of the gear.The vibration signal is composed of 60160 samples and it is very difficult to analyze all this samples. So, we must analyze a number of samples which cover one period at the least. According to the Shannon theorem, we have: 0.01667 KHz is the rotational frequency and 0.020 MHz is the sampling frequency. Therefore, the number of samples should be upper or equal to 1200 samples. In this work we have used 1500 samples.
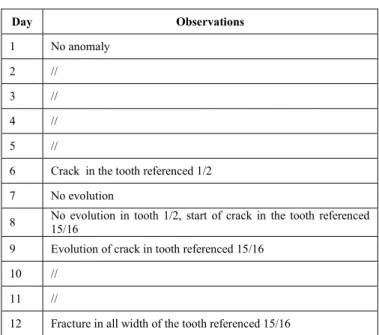
To evaluate the state of the pinion and the gear, the mechanical system under consideration is stopped. This evaluation is given in table 2 [9].
TABLE II. THE EXAMINATION REPORT OF THE SYSTEM. Day Observations 1 No anomaly 2 // 3 // 4 // 5 //
6 Crack in the tooth referenced 1/2 7 No evolution
8 No evolution in tooth 1/2, start of crack in the tooth referenced 15/16 9 Evolution of crack in tooth referenced 15/16
10 // 11 //
12 Fracture in all width of the tooth referenced 15/16
B. Obtained resultsand By temporal and spectral representation
The vibration signals from day 9 to day 12 have been plotted for original signal in Figure 3.
(a) (a)
(b) (b)
(d) (d) Fig. 3. Experiment day of original signal: (a) 9th day,
(b) 10th day, (c) 11th day and (d) 12th day.
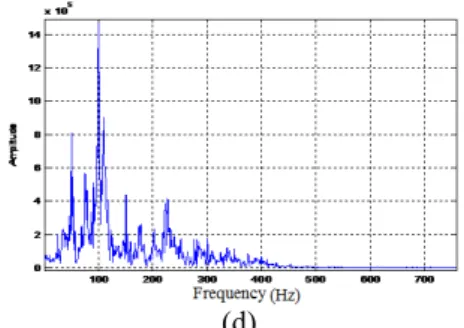
Fig. 4. Frequency spectrums of original signal: (a) 9th
day, (b) 10th day, (c) 11th day and (d) 12th day.
The original vibration signal x(t) obtained from the mechanical system is given in the Figure 3. The behavior of the signal x(t) from the 1st day to 9th day is similar (we haven’t
represented the signals of from the 1st day to 8th day because
they are similar). According to the examination report (Table 2), the mechanical is affect by the defect but the temporal representations haven’t detected this defect in these days.
In the last day (12th day), the vibration signal x(t) is totally
changed. This change is due to the presence of the crack in all width of the tooth referenced 15/16.
The corresponding frequency spectrums are shown in Figure 4. The side lines are very important in the 12th day
compared to other days and this increase is due to the crack in all width of the tooth referenced 15/16. Thus the temporal and frequency representation make it possible to diagnose a defect in the last day (12th day) and not in early stage why the
necessary of another approach for the early detection.
C. Obtained results by WPT
As mentioned above, the blocks A (approximations sub-band) and the blocks D (details sub-band decomposition) are obtained by the use of two filters. The obtained parts itself are separated in two parts and so. In order to identify early the existence of the defect, this method is used and we have obtained this goal in the level 5. The process of approach is summarized in figure 5.
Fig. 5. The process of used approach in level 5.
The use of the WPT on real signal x(t) obtained from the mechanical system, we have investigate that the signature of the occurrence of the defect is obtained in the fifth level. The corresponding details and approximates of original vibration signal x(t) obtained from the mechanical system are given in the Figure 6.
0 5 10 15 20 25 30 35 40 45 50 -12000 -11000 -10000 -9000 -8000 -7000 -6000 -5000 -4000 -3000 Time (ms) A mp litu d e 0 5 10 15 20 25 30 35 40 45 50 -1 -0.8 -0.6 -0.4 -0.2 0 0.2 0.4 0.6 0.8 1x 10 4 Time (ms) A m p lit u d e (a) (a) 0 5 10 15 20 25 30 35 40 45 50 -6000 -5000 -4000 -3000 -2000 -1000 0 1000 2000 3000 4000 Time (ms) A m pli tud e 0 5 10 15 20 25 30 35 40 45 50 -1 -0.8 -0.6 -0.4 -0.2 0 0.2 0.4 0.6 0.8 1x 10 4 Time (ms) Am p lit u d e (b) (b) 0 5 10 15 20 25 30 35 40 45 50 -2000 0 2000 4000 6000 8000 10000 Time (ms) A m pl it ude 0 5 10 15 20 25 30 35 40 45 50 -1.5 -1 -0.5 0 0.5 1 1.5x 10 4 Time (ms) A m pl it ud e (c) (c) 0 5 10 15 20 25 30 35 40 45 50 -2000 -1000 0 1000 2000 3000 4000 5000 6000 7000 8000 Time (ms) A m pl it ude 0 5 10 15 20 25 30 35 40 45 50 -1.5 -1 -0.5 0 0.5 1 1.5x 10 4 Time (ms) A m p lit u d e (d) (d)
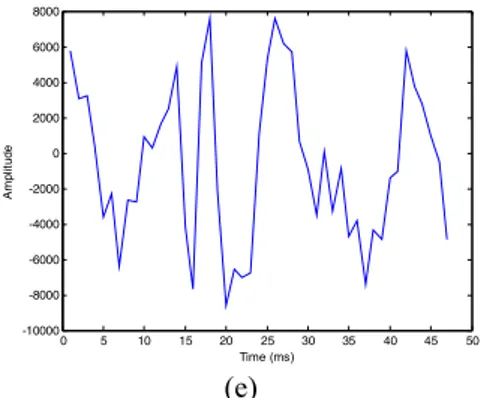
0 5 10 15 20 25 30 35 40 45 50 -1 -0.5 0 0.5 1 1.5 2x 10 4 Time (ms) A m pl it ude 0 5 10 15 20 25 30 35 40 45 50 -10000 -8000 -6000 -4000 -2000 0 2000 4000 6000 8000 Time (ms) A mp litu d e (e) (e) Fig. 6. Approximates of original signal: (a) 8th
day, (b) 9th day, (c) 10th day, (d) 11th day and (e)
12th day
Fig. 7. Details of original signal: (a) 8th day, (b)
9th day, (c) 10th day, (d) 11th day and (e) 12th day
The representation of details at the level 5 of the vibration signal x(t) obtained from the mechanical system from the 1st
day to 9th day demonstrate that the number of the peaks is
four peaks.
At the 10th day, the number of the peaks is augment and
become 5 peaks. This change is translated according to the examination report (Table 2) by the evolution of crack in tooth referenced 15/16. In consequence, the wavelet packet transform approach detects the existence of the defect 2 days earlier before the occurrence of the defect.
In the 11th and 12th days, the number of the peaks is also
five peaks and this increase is due to the evolution and the crack in all width of tooth referenced 15/16.
IV. CONCLUSION
The process of wavelet packet transforms is based on the use of high-pass filter and low-pass the filter in order to separate the original signal in two parts. This approach is used in the goal of the detection early the presence of the defects. To demonstrate the effectiveness of the approach, the wavelet packet is tested by the use of real vibration signals of mechanical system. For the classical methods (temporal and frequency representation) the detection of the defect is possible but not in early phase why the necessary of another approach for the early detection. The wavelet packet transform approach proves its effectiveness in the detection of the fault in early phase.
For the future work, we must focalize on the classification of the defects and make a database for this purpose.
REFERENCES
[1] L. Li, H. Cai, H. Han, Q. Jiang, H. Ji, “Adaptive short-time Fourier transform and synchrosqueezing transform for non-stationary signal separation”, Signal Processing, Vol. 166, pp. 107231, 2020.
[2] R. R. Sharma, A. Kalyani, R. B. Pachori, An empirical wavelet transform-based approach for cross-terms-free Wigner–Ville distribution, Signal, Image and Video Processing, Vol.13, pp. 1-8, 2019.
[3] L. Li, H. Cai, H. Han, Q. Jiang, H. Ji, “Adaptive short-time Fourier transform and synchrosqueezing transform for
non-stationary signal separation”, Signal Processing, Vol. 166, Article 107231, DOI: 10.1016/j.sigpro.2019.07.024, 2020
[4] B. Li, X. Zhang, J. Wu, “ New procedure for gear fault detection and diagnosis using instantaneous angular speed”, Mechanical Systems and Signal Processing, 85, pp. 415–428, 2017.
[5] I. Daubechies, “The wavelet Transform, Time-frequency Localization and Analysis”, IEEE, transaction on information Theory, 36, pp. 961–1004, 1990.
[6] E. G. Plaza, P.J. N. López, “Analysis of cutting force signals by wavelet packet transform for surface roughness monitoring in CNC turning”, Mechanical Systems and Signal Processing, Vol. 98, pp. 634–651, 2018.
[7] M. Ayad, D. Chikouche, N. Boukezzoula, M. Rezki, “Search of a robust defect signature in gear systems across adaptive Morlet wavelet of vibration signals”, IET Signal Processing, Vol. 8, N°9, pp. 918-926, 2014.
[8] A. Parey, M. El-Badaoui, F. Guillet, N. Tandon, “Dynamic modelling of spur gear pair and application of empirical mode decomposition-based statistical analysis for early detection of localized tooth defect”.Sound and Vibration, Vol. 294, pp. 547–561, 2006.
[9] M. Ayad, M. Rezki, K. Saoudi, M. Benziane, A. Arabi, Dj. Chikouche, “Wavelet transforms coefficients and autocorrelation of gear system for early damage detection”. IEEE-xplore, DOI- 10.1109/ICMIC.2015.7409430, 2015.