HAL Id: hal-01190374
https://hal.archives-ouvertes.fr/hal-01190374
Submitted on 7 Jun 2020HAL is a multi-disciplinary open access
archive for the deposit and dissemination of sci-entific research documents, whether they are pub-lished or not. The documents may come from teaching and research institutions in France or abroad, or from public or private research centers.
L’archive ouverte pluridisciplinaire HAL, est destinée au dépôt et à la diffusion de documents scientifiques de niveau recherche, publiés ou non, émanant des établissements d’enseignement et de recherche français ou étrangers, des laboratoires publics ou privés.
effects of tapping and ethephon stimulation at trunk
scale
Unakorn Silpi, Pisamai Chantuma, Poonpipote Kasemsap, Philippe Thaler,
Suraphon Thanisawanyangkura, André Lacointe, Thierry Ameglio, Eric Gohet
To cite this version:
Unakorn Silpi, Pisamai Chantuma, Poonpipote Kasemsap, Philippe Thaler, Suraphon Thani-sawanyangkura, et al.. Spatial distribution of sucrose and metabolic activity in the laticiferous tissue of three Hevea brasiliensis clones : effects of tapping and ethephon stimulation at trunk scale. IRRDB annual Meeting, Sep 2004, Kunming, China. China Agricultural University Press, pp.305-316, 2004. �hal-01190374�
Effects of Tapping and Ethephon Stimulation at Trunk Scale.
U. Silpi 1, P. Chantuma 2, P. Kasemsap 3, P. Thaler 4, S.Thanisawanyangkura 5, A. Lacointe 6, T. Ameglio 6 and E. Gohet 4*
1 Doras Center, Kasetsart University, Bangkok 10900, Thailand.
2 Chachoengsao Rubber Research Center, DOA, Sanam Chai Khet, Thailand.
3 Kasetsart University, Faculty of Agriculture, Department of Agronomy,
Bangkok 10900, Thailand.
4 Cirad - Tree Crops Department, Rubber Program, Kasetsart University,
Bangkok 10900, Thailand.
5 Kasetsart University, faculty of Science, Department of Botany, Kasetsart
University, Bangkok, 10900, Thailand
6 UMR-PIAF, INRA, Site de Crouelle, 63039 Clermont-Ferrand, France
* Corresponding author :
Eric Gohet, Cirad-Thailand, Golden Jubilee Building, 10th Floor, Kasetsart University,
10900 Bangkok, Thailand. Tel +66(0)29428683 Fax +66(0)29428684 eric.gohet@cirad.fr
SUMMARY
This study aims at describing the sucrose balance between supply and utilization in the latex producing bark of the rubber tree, as well as the concurrent latex metabolic activity. Experiments were set up on 3 Hevea brasiliensis clones (PB235, RRIM600 and GT1) on the same polyclonal plot of Chachoengsao Rubber Research Center (CRRC-DOA). Treatments included untapped trees (growth potential control), trees tapped without stimulation (½ S d/3 6d/7 9m/12, physiological control) and trees tapped with Ethephon stimulation (½ S d/3 6d/7 9m/12 ET 2.5% 5/y and 12/y). The results confirmed the significant effect of tapping on whole trunk latex physiology. A huge depletion of the latex sucrose concentration was demonstrated. The Latex Diagnosis Mapping method (LDM) allowed a rather precise description of the shape and the size of the latex regeneration area and the metabolically active bark area. A multi-clonal linear relation between rubber production and estimated latex regeneration area indicates that the regeneration of 1 g of dry rubber requires an
average of ca. 100 cm2 latex regeneration area. By assessing the impact of any
tapping system on whole trunk latex physiology, the LDM method could be used successfully in order to provide new ideas for imagination and/or optimization of new tapping systems like ethylene gas stimulated systems, micro-tapping cut systems and multi-tapping cut systems, as based on a better physiological knowledge of the whole rubber tree functioning.
In Thailand, the rubber tree (Hevea brasiliensis Muell. Arg.) is one of the major economic crops, as it directly or indirectly supports around 10 % of the country population. Concerning on economic value, not only latex production, but also wood timber brings about a significant income to the farmers. Both rubber production and growth require assimilates from photosynthesis, mainly in the form of sucrose. As farmers’ benefit relies on a suitable management in order to keep a suitable balance between rubber production and plant growth, it is worth understanding the influence of regular tapping or stimulation on the growth of the tree. As a matter of fact, a negative relation exists between latex production and wood biomass creation (Templeton 1968, Wycherley 1976, Sethuraj 1981, 1985, Gohet 1996, Gohet et al. 1996).
The aim of this study is to describe but also to quantify the sucrose balance between supply and utilization in the latex producing bark of the rubber tree, as well as the concurrent latex metabolic activity. Such a study cannot be restricted to the only tapped panel, as some other bark areas may be likewise involved or at least affected by the latex regeneration process. Physiological analyses are therefore carried out as well on the untapped bark area, in order to map the latex metabolic activity and the concurrent latex sucrose availability at the trunk level. Ethephon stimulation is used as a physiological tool in order to study the influence of an increased rubber production, and therefore an enhanced latex regeneration, on the metabolic characteristics of the latex sink.
Former authors already worked this subject in the past. Lustinec and Resing (1965) found, using radio-labeled isotopes, that the flow area of recently opened rubber tree was distributed about 40-50 cm above and below the tapping cut. On older trees, these authors showed that this area could extend up to 70 cm above the cut and to the whole area below the tapping cut. Buttery and Boatman (1966), using turgor pressure measurements to determine drained area, reported a pressure drop down to 1.20 m below the tapping cut. Pakianathan et al. (1975) termed “Potential displacement area” a bark area where rapid movement of latex near the region of the tapping cut could occur. Tupy (1973 a) showed that sucrose latex content was depleted below and above the tapping cut as a consequence of latex regeneration process. Nevertheless, none of these studies concurrently described the sucrose supply/utilization balance and the associated latex metabolic activity at the trunk level. In the current study, Latex Diagnosis (Eschbach et al. 1984, Jacob et al. 1985, 1988a, 1988b, 1995a) is used in order to obtain the first results on carbohydrate partitioning and the concurrent latex metabolic activity at the trunk level. This method is called “Latex Diagnosis mapping” or “LD mapping”.
MATERIALS AND METHODS
Plant material
Experiments were set up on 3 Hevea brasiliensis clones (PB235, RRIM600 and GT1) on the same polyclonal plot of Chachoengsao Rubber Research Center (CRRC-RRIT-DOA). All trees were planted in 1993 under a 2.5m x 7.0 m planting design (571 trees/ha). Tapping of each experiment was started when monoclonal plots were ready for tapping (i.e. 50% of the stand reaching a trunk girth of 50 cm, measured at 1.00 m from the ground) in May 1999 on PB235 (experiment CHOE01), October 1999 on RRIM600 (experiment CHOE04) and May 2000 on GT1 (experiment CHOE05), with respect to clonal growth potential. Depending on trial, each treatment comprised groups of 10-13 trees per clone. Experimental design was a “One Tree Plot Design” (OTPD), each tree under trial being one treatment replication. Before start of tapping of each experiment, trees were selected as homogenous, belonging to the normal population of each plot regarding trunk girth, canopy sanitary status and trunk conformation. Treatments included untapped trees (growth potential control), trees tapped without stimulation (½ S d/3 6d/7 9m/12, physiological control) and trees tapped with ethephon stimulation (½ S d/3 6d/7 9m/12 Et 2.5% 5/y and 12/y). Tapping was stopped from February to April, in accordance with RRIT-DOA tapping system recommendations for Chachoengsao area (stop of tapping during refoliation and high temperature/high water stress period). Tapped treatments were opened on panel B0-1 at 1.30 m from ground, with a tapping cut slope of 30°. Regarding ethephon stimulated treatments, stimulation was performed using panel application (Pa), corresponding to application of 0.6 g of stimulant per tree and per stimulation (i.e. 15 mg a.i. per tree per stimulation).
Method
Dry rubber production, trunk girth and latex physiological parameters measured using latex diagnosis technique (Jacob et al. 1985, 1995) were recorded monthly, tree per tree. Regarding this particular study, latex diagnosis was applied to the whole trunk of one unique tree per treatment (untapped control, ½ S d/3 6d/7, ½ S d/3 6d/7 Et 2.5% 5/y and ½ S d/3 6d/7 Et 2.5% 12/y). Latex concentrations of sucrose (Suc) and inorganic phosphorus (Pi) were measured at different trunk positions, aiming at describing the available carbohydrate substrate and the related metabolic activity of the latex in response to each treatment (tapping and stimulation intensity), at trunk scale. Sampled trees were selected as representative of treatments regarding girth and production. Latex sampling positions were drawn on the trunk one day prior latex sampling in order to cover trunk areas below and above the tapping cut (∀ 90 cm, i.e. up to 2 m above ground), on both tapped and untapped panels. Latex collection was performed in the morning of scheduled tapping day, from 7.00 to 9.00 am. Tapping was delayed until end of latex sampling, to avoid any influence of tapping on latex analysis results. Sampling was performed upwards from the lowermost line, first on tapped panel, then on untapped panel. Seven drops of latex were collected from each sampling position to measure latex sucrose (Suc) and inorganic phosphorus (Pi) using latex diagnosis (LD) technique, adapted to CRRC Latex Diagnosis Laboratory facilities (Gohet and Chantuma, 1999). Sucrose (Suc) and inorganic phosphorus (Pi)
RESULTS
1. Vertical distribution of latex inorganic phosphorus (Pi) and sucrose (Suc) contents.
Inorganic phosphorus (Pi) and sucrose (Suc) are the two main latex physiological parameters measured by latex diagnosis (LD) (Eschbach et al. 1984, Jacob et al. 1985, 1988a, 1988b, 1995a). Correlation between these parameters and yield allows establishing latex clonal metabolic typology (Jacob et al. 1995b, Gohet et al. 1997, 2003), where clones GT1, RRIM600 and PB235 are respectively known as medium, medium-high and high metabolism clones.
The vertical distribution of the latex metabolic activity and available substrate for rubber biosynthesis, respectively estimated by latex inorganic phosphorous (Pi) and sucrose (Suc) contents in tapped and untapped panels, compared between untapped trees, tapped trees without stimulation and tapped trees with ethephon stimulation, of the three clones is shown in figures 1 and 2.
1.1. Tapped panel (figure 1)
On tapped panel, a significant change in the levels of the two parameters (Suc and Pi) within the studied area (+ 90 cm from the tapping cut) is observed for all 3 clones between tapped and untapped trees.
Latex sucrose content (Suc) is significantly decreased by tapping in comparison with the equivalent sampling position in untapped trees, below and above the tapping cut. Maximum latex sucrose depletion mainly occurs in the bark regions surrounding the tapping cut (+ 50 cm from the tapping cut). Ethephon stimulation generally enhances this drop of latex sucrose content. It is however remarkable that even the uppermost location of the tapped panel is dramatically affected by tapping and ethephon stimulation. In the lowest parts of the panel, difference between untapped trees and tapped trees is less important since latex sucrose content shows an increasing bottom-up gradient in untapped trees.
Conversely, latex inorganic phosphorus content (Pi) is significantly increased by tapping in comparison with the equivalent sampling positions in untapped trees, below and above the tapping cut. However, relative importance of this increase in latex Pi seems very much related to the clone. It is huge on clone PB235 (high metabolism clone), medium on clone RRIM600 (medium-high metabolism clone) and low on clone GT1 (medium metabolism clone) and therefore seems closely related to clonal latex metabolism. Increase in latex Pi mainly occurs in the bark area below or just above the tapping cut. Ethephon stimulation generally enhances this effect of ethephon stimulation on latex Pi, especially below the tapping cut.
SUCROSE INORGANIC PHOSPHORUS
Figure 1: Vertical distribution of latex sucrose content ([Suc], mM.l-1) and inorganic
phosphorus content ([Pi], mM.l-1) in tapped panel of clones PB235, RRIM600 and
GT1, depending on distance from the tapping cut (∀ 90 cm).
Sampling on tapped trees is performed 5, 20, 35, 50, 65 and 80 cm below the cut. Height of sampling above the cut depends on the width of renewed bark, which is function of opening date of each clone: 10, 25 and 55 cm above renewed bark. Sampling on untapped tree is performed at 4 locations, equivalent to following positions on tapped trees: 20 and 80 cm below the cut, 10 and 55 cm above renewed bark.
CHOE01 PB235 : TAPPED PANEL
-1 -0.5 0 0.5 1 0 10 20 30 40 50 latex [Suc] mM. l -1 di s ta n ce f rom ta pp ing c u t (m )
untapped nil sti m E t 5/y E t 12/y
CHOE01 PB235 : TAPPED PANEL
-1 -0.5 0 0.5 1 0 5 10 15 20 25 30 latex [Pi] mM. l -1 di s tanc e fr om ta p p ing c u t (m )
untapped nil stim E t 5/y E t 12/y
CHOE04 RRIM600 : TAPPED PANEL
-1 -0.5 0 0.5 1 0 5 10 15 20 25 30 latex [Pi] mM. l -1 di s ta n ce f ro m t a ppi ng c u t (m )
untapped nil stim E t 5/y E t 12/y
CHOE05 GT1 : TAPPED PANEL
-1 -0.5 0 0.5 1 0 10 20 30 40 50 latex [Suc] mM. l -1 di stanc e f rom tappi ng c u t (m)
untapped nil stim E t 5/y E t 12/y
CHOE05 GT1 : TAPPED PANEL
-1 -0.5 0 0.5 1 0 5 10 15 20 25 30 latex [Pi] mM. l -1 di s tance f rom t a ppi ng cut ( m )
untapped nil stim E t 5/y E t 12/y CHOE04 RRIM600 : TAPPED PANEL
- 1 - 0.5 0 0.5 1 0 10 20 30 40 50 latex [Suc] mM. l -1 di sta n ce fr om ta ppi ng c u t (m )
untapped nil stim E t 5/y E t 12/y
SUCROSE INORGANIC PHOSPHORUS
Figure 2: Vertical distribution of latex sucrose content ([Suc], mM.l-1) and Latex
inorganic phosphorus content ([Pi], mM.l-1) in untapped panel of clones PB235,
RRIM600 and GT1, depending on distance from the tapping cut (∀ 90 cm).
Sampling is performed at 4 locations, equivalent to following positions on the tapped panel: 20 and 80 cm below the cut, 10 and 55 cm above renewed bark.
C HO E 01 PB 235 : UNT A PPE D PA NE L -1 -0.5 0 0.5 1 0 10 20 30 40 50 latex [Suc] mM. l -1 di stanc e f rom t a ppi n g cut (m)
untapped nil stim E t 5/y E t 12/y
C HO E 04 RR IM600 : UNT A PPE D PA NE L
- 1 - 0.5 0 0.5 1 0 10 20 30 40 50 latex [Suc] mM. l -1 di s tanc e fr om ta p p ing c u t (m )
untapped nil stim E t 5/y E t 12/y
C HO E 04 RR IM600 : UNT A PPE D PA NE L
-1 -0.5 0 0.5 1 0 5 10 15 20 25 30 latex [Pi] mM. l -1 di stanc e fr om t a ppi ng cut (m)
untapped nil stim E t 5/y E t 12/y C HO E 01 PB 235 : UNT A PPE D PA NE L - 1 - 0.5 0 0.5 1 0 5 10 15 20 25 30 latex [Pi] mM. l -1 di st anc e f rom t a ppi ng cut ( m )
untapped nil stim E t 5/y E t 12/y C HO E 05 G T 1 : UNT A PPE D PA NE L -1 -0.5 0 0.5 1 0 10 20 30 40 50 latex [Suc] mM. l -1 di s ta n ce f rom t a ppi ng cut ( m )
untapped nil sti m E t 5/y E t 12/y C HO E 05 G T 1 : UNT A PPE D PA NE L -1 -0.5 0 0.5 1 0 5 10 15 20 25 30 latex [Pi] mM. l -1 di st anc e f rom t a ppi ng c u t ( m )
untapped nil stim E t 5/y E t 12/y
1.2. Untapped panel (figure 2):
On untapped panel, a significant change in the levels of the two parameters (Suc and Pi) within the studied area is likewise observed for all 3 clones between tapped and untapped trees.
Latex sucrose content (Suc) is significantly decreased by tapping in comparison with the equivalent sampling position in untapped trees. Maximum latex sucrose depletion mainly occurs in the uppermost bark regions of the untapped panel, due to the bottom-up increasing gradient of latex sucrose observed in untapped trees. Ethephon stimulation has little and non-constant effect on this decrease in latex sucrose content. Latex sucrose pattern is much more regular in the untapped panel than in the tapped panel, showing a general increasing bottom-up gradient whatever the clone and the tapping intensity.
Conversely, and as observed on tapped panel, latex inorganic phosphorus content (Pi) is significantly increased by tapping in untapped panel in comparison with the equivalent sampling positions in untapped trees. Relative importance of this increase in latex Pi seems very much related to the clone. It is high on clone PB235 (high metabolism clone), medium on clone RRIM600 (medium-high metabolism clone) and low on clone GT1 (medium metabolism clone) and therefore seems as well related to clonal latex metabolism. As on tapped panel, ethephon stimulation generally enhances this effect of ethephon stimulation on latex Pi, especially in bottom areas of the untapped panel. However, this effect is much less significant than on tapped panel and therefore seems poorly correlated with the clonal metabolism.
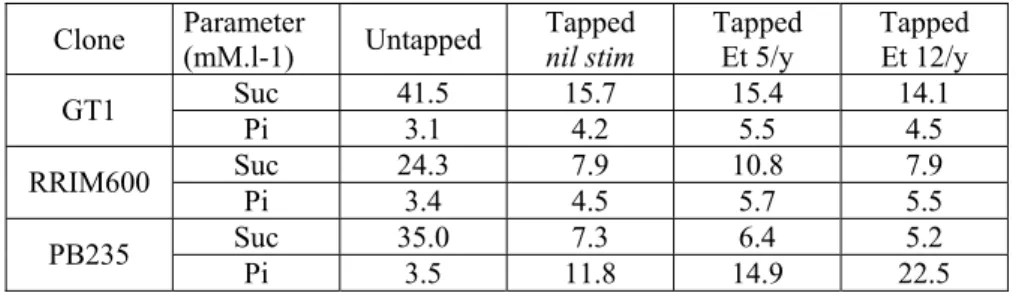
2. Latex metabolic status at trunk scale.
Table 1 presents the mean trunk values of latex sucrose and latex inorganic
phosphorus observed on the 12 sampled trees.
Clone Parameter (mM.l-1) Untapped Tapped nil stim Tapped Et 5/y Tapped Et 12/y Suc 41.5 15.7 15.4 14.1 GT1 Pi 3.1 4.2 5.5 4.5 Suc 24.3 7.9 10.8 7.9 RRIM600 Pi 3.4 4.5 5.7 5.5 Suc 35.0 7.3 6.4 5.2 PB235 Pi 3.5 11.8 14.9 22.5
At trunk level, latex sucrose average concentration is confirmed dramatically decreased by tapping for all three clones, especially on clone PB235 (-62% to -66% for GT1, -55% to –67% for RRIM600, -80 to –85% for PB235). Effect of stimulation is much less significant.
Regarding latex inorganic phosphorus, observed values are rather low compared to usual standards, especially on tapped GT1 and RRIM600. They nevertheless show a general increasing trend with increasing exploitation intensity. Observed low Pi values of clones GT1 and RRIM 600 may be explained by the period of sampling
(end of August), as latex metabolism activation is still rather incomplete. Such data, as it is well established that latex regeneration stricto sensu is a rather localized phenomenon, clearly show that tapping and subsequent latex regeneration modify completely the physiology of the rubber tree latex system, affecting the whole latex metabolism and concurrent latex carbohydrate availability at tree scale.
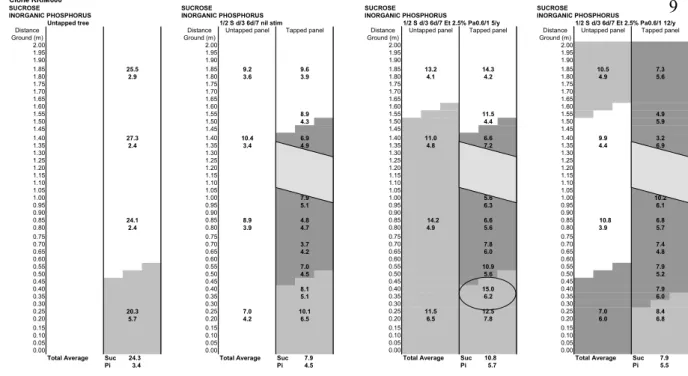
Figures 3a (GT1), 3b (RRIM600) and 3c (PB235) show the metabolic latex diagnosis
mapping (“LD” mapping) of the 12 sampled trees. Each value is the average of 3 sampling points of the same line. Shadowed areas represent the sampling positions where latex Pi concentration is found higher than the average trunk Pi concentration of the physiological control treatment (1/2 S d/3 6d/7 nil stim):
Figure 3a (GT1): Latex diagnosis mapping (“LDM”) of the 4 sampled trees. Each
value is the average of 3 sampling points of the same line. Shadowed areas represent the sampling positions where latex Pi concentration is found higher than the average trunk Pi concentration of the physiological control treatment (1/2 S d/3 6d/7 nil stim): Dark gray area: high Pi with concurrent low Suc (Regeneration), pale gray area: high Pi area (Metabolic activation), white area: area comparable to the physiological status of untapped tree, and dotted area: renewed bark. Circled area shows an “sugar importation area”
Clone GT1
SUCROSE SUCROSE
INORGANIC PHOSPHORUS INORGANIC PHOSPHORUS Untapped tree 1/2 S d/3 6d/7 nil stim
Distance Distance Ground (m) Ground (m) 2.00 2.00 1.95 1.95 1.90 1.90 1.85 49.8 1.85 23.1 20.5 1.80 3.4 1.80 3.3 4.3 1.75 1.75 1.70 1.70 1.65 1.65 1.60 1.60 1.55 1.55 19.0 1.50 1.50 4.1 1.45 1.45 1.40 45.0 1.40 19.1 15.0 1.35 3.8 1.35 3.6 4.7 1.30 1.30 1.25 1.25 1.20 1.20 1.15 1.15 1.10 1.10 8.8 1.05 1.05 3.6 1.00 1.00 0.95 34.2 0.95 17.3 7.7 0.90 2.8 0.90 3.7 3.8 0.85 0.85 0.80 0.80 14.8 0.75 0.75 4.5 0.70 0.70 0.65 0.65 13.0 0.60 0.60 4.0 0.55 0.55 0.50 0.50 15.4 0.45 0.45 5.0 0.40 0.40 0.35 37.1 0.35 15.3 15.7 0.30 2.3 0.30 4.1 6.0 0.25 0.25 0.20 0.20 0.15 0.15 0.10 0.10 0.05 0.05 0.00 0.00
Total Average Suc 41.5 Total Average Suc 15.7
Pi 3.1 Pi 4.2
Tapped panel Untapped panel
SUCROSE SUCROSE
INORGANIC PHOSPHORUS INORGANIC PHOSPHORUS
1/2 S d/3 6d/7 Et 2.5% Pa0.6/1 5/y 1/2 S d/3 6d/7 Et 2.5% Pa0.6/1 12/y
Distance Distance Ground (m) Ground (m) 2.00 2.00 1.95 1.95 1.90 1.90 1.85 22.6 21.3 1.85 20.0 18.3 1.80 5.1 3.3 1.80 4.3 3.8 1.75 1.75 1.70 1.70 1.65 1.65 1.60 1.60 1.55 7.6 1.55 7.3 1.50 3.3 1.50 4.5 1.45 1.45 1.40 19.2 4.6 1.40 18.9 5.5 1.35 3.6 5.1 1.35 4.3 5.3 1.30 1.30 1.25 1.25 1.20 1.20 1.15 1.15 1.10 10.1 1.10 16.4 1.05 4.8 1.05 4.5 1.00 1.00 0.95 12.4 9.5 0.95 17.2 8.8 0.90 3.8 5.7 0.90 3.5 4.2 0.85 0.85 0.80 12.2 0.80 7.8 0.75 7.2 0.75 5.0 0.70 0.70 0.65 17.2 0.65 14.9 0.60 6.7 0.60 4.8 0.55 0.55 0.50 23.9 0.50 15.5 0.45 7.5 0.45 4.7 0.40 0.40 0.35 14.0 25.9 0.35 16.3 16.7 0.30 5.6 9.2 0.30 4.3 5.6 0.25 0.25 0.20 0.20 0.15 0.15 0.10 0.10 0.05 0.05 0.00 0.00
Total Average Suc 15.4 Total Average Suc 14.1
Pi 5.5 Pi 4.5
Untapped panel Tapped panel Untapped panel Tapped panel
.
Figure 3b (RRIM600): Latex diagnosis mapping (“LDM”) of the 4 sampled trees.
Each value is the average of 3 sampling points of the same line. Shadowed areas represent the sampling positions where latex Pi concentration is found higher than the average trunk Pi concentration of the physiological control treatment (1/2 S d/3 6d/7
nil stim): Dark gray area: high Pi with concurrent low Suc (Regeneration), pale gray
area: high Pi area (Metabolic activation), white area: area comparable to the physiological status of untapped tree, and dotted area: renewed bark.
Figure 3c (PB235): Latex diagnosis mapping (“LDM”) of the 4 sampled trees. Each
value is the average of 3 sampling points of the same line. Shadowed areas represent the sampling positions where latex Pi concentration is found higher than the average trunk Pi concentration of the physiological control treatment (1/2 S d/3 6d/7 nil stim): Dark gray area: high Pi with concurrent low Suc (Regeneration), pale gray area: high Pi area (Metabolic activation), white area: area comparable to the physiological status of untapped tree, and dotted area: renewed bark.
1.95 1.95 1.90 1.90 1.85 25.5 1.85 9.2 9.6 1.80 2.9 1.80 3.6 3.9 1.75 1.75 1.70 1.70 1.65 1.65 1.60 1.60 1.55 1.55 8.9 1.50 1.50 4.3 1.45 1.45 1.40 27.3 1.40 10.4 6.9 1.35 2.4 1.35 3.4 4.9 1.30 1.30 1.25 1.25 1.20 1.20 1.15 1.15 1.10 1.10 1.05 1.05 1.00 1.00 7.9 0.95 0.95 5.1 0.90 0.90 0.85 24.1 0.85 8.9 4.8 0.80 2.4 0.80 3.9 4.7 0.75 0.75 0.70 0.70 3.7 0.65 0.65 4.2 0.60 0.60 0.55 0.55 7.0 0.50 0.50 4.5 0.45 0.45 0.40 0.40 8.1 0.35 0.35 5.1 0.30 0.30 0.25 20.3 0.25 7.0 10.1 0.20 5.7 0.20 4.2 6.5 0.15 0.15 0.10 0.10 0.05 0.05 0.00 0.00
Total Average Suc 24.3 Total Average Suc 7.9
Pi 3.4 Pi 4.5 1.95 1.95 1.90 1.90 1.85 13.2 14.3 1.85 10.5 7.3 1.80 4.1 4.2 1.80 4.9 5.6 1.75 1.75 1.70 1.70 1.65 1.65 1.60 1.60 1.55 11.5 1.55 4.9 1.50 4.4 1.50 5.9 1.45 1.45 1.40 11.0 6.6 1.40 9.9 3.2 1.35 4.8 7.2 1.35 4.4 6.9 1.30 1.30 1.25 1.25 1.20 1.20 1.15 1.15 1.10 1.10 1.05 1.05 1.00 5.6 1.00 10.2 0.95 6.3 0.95 6.1 0.90 0.90 0.85 14.2 6.6 0.85 10.8 6.8 0.80 4.9 5.6 0.80 3.9 5.7 0.75 0.75 0.70 7.8 0.70 7.4 0.65 6.0 0.65 4.8 0.60 0.60 0.55 10.9 0.55 7.9 0.50 5.6 0.50 5.2 0.45 0.45 0.40 15.0 0.40 7.9 0.35 6.2 0.35 6.0 0.30 0.30 0.25 11.5 12.5 0.25 7.0 8.4 0.20 6.5 7.8 0.20 6.0 6.8 0.15 0.15 0.10 0.10 0.05 0.05 0.00 0.00
Total Average Suc 10.8 Total Average Suc 7.9
Pi 5.7 Pi 5.5
Clone PB235
SUCROSE SUCROSE
INORGANIC PHOSPHORUS INORGANIC PHOSPHORUS Untapped tree 1/2 S d/3 6d/7 nil stim
Distance Distance Ground (m) Ground (m) 2.00 2.00 1.95 1.95 1.90 1.90 1.85 38.1 1.85 9.7 13.2 1.80 3.7 1.80 6.7 10.4 1.75 1.75 1.70 1.70 1.65 1.65 1.60 1.60 1.55 1.55 7.7 1.50 1.50 10.0 1.45 1.45 1.40 40.3 1.40 10.3 4.9 1.35 3.5 1.35 7.8 11.3 1.30 1.30 1.25 1.25 1.20 1.20 1.15 1.15 1.10 1.10 1.05 1.05 1.00 1.00 0.95 0.95 0.90 0.90 6.6 0.85 0.85 11.8 0.80 0.80 0.75 42.6 0.75 10.1 6.1 0.70 3.5 0.70 9.4 11.6 0.65 0.65 0.60 0.60 4.4 0.55 0.55 12.8 0.50 0.50 0.45 0.45 4.0 0.40 0.40 12.6 0.35 0.35 0.30 0.30 4.6 0.25 0.25 15.1 0.20 0.20 0.15 18.8 0.15 6.7 6.0 0.10 3.3 0.10 15.6 18.1 0.05 0.05 0.00 0.00
Total AveragSuc 35.0 Total AveragSuc 7.3
Pi 3.5 Pi 11.8
Tapped panel Untapped panel
SUCROSE SUCROSE
INORGANIC PHOSPHORUS INORGANIC PHOSPHORUS
1/2 S d/3 6d/7 Et 2.5% Pa0.6/1 5/y 1/2 S d/3 6d/7 Et 2.5% Pa0.6/1 12/y
Distance Distance Ground (m) Ground (m) 2.00 2.00 1.95 1.95 1.90 1.90 1.85 13.1 9.1 1.85 7.9 6.9 1.80 10.2 10.8 1.80 20.0 26.0 1.75 1.75 1.70 1.70 1.65 1.65 1.60 1.60 1.55 4.8 1.55 7.3 1.50 14.0 1.50 28.8 1.45 1.45 1.40 11.5 6.5 1.40 10.8 7.1 1.35 10.3 17.9 1.35 19.6 25.5 1.30 1.30 1.25 1.25 1.20 1.20 1.15 1.15 1.10 1.10 1.05 1.05 1.00 1.00 0.95 0.95 0.90 5.2 0.90 3.4 0.85 12.5 0.85 20.3 0.80 0.80 0.75 9.7 4.9 0.75 8.5 1.8 0.70 10.7 12.7 0.70 24.4 19.7 0.65 0.65 0.60 3.4 0.60 3.9 0.55 12.7 0.55 19.8 0.50 0.50 0.45 3.1 0.45 1.6 0.40 15.3 0.40 18.5 0.35 0.35 0.30 2.4 0.30 3.2 0.25 20.3 0.25 21.6 0.20 0.20 0.15 5.9 3.5 0.15 3.4 2.2 0.10 25.5 20.5 0.10 23.2 24.6 0.05 0.05 0.00 0.00
Total Averag Suc 6.4 Total Averag Suc 5.2
Pi 14.9 Pi 22.5
Untapped panel Tapped panel Untapped panel Tapped panel
Such representation clearly represents the extension of the metabolically active area and indicates that:
• the most active trunk areas are always found on tapped panel, below the cut or just above the cut. Above the cut, clear and regular bottom-up decreasing gradients represent the decreasing latex metabolic activity when distance from the tapping cut increases.
• on untapped panel, active areas are, if any, always located at the bottom of the panel. Nevertheless, metabolic activation of untapped panel is in most cases found low compared to equivalent positions in the tapped panel.
• these active areas are extended by ethephon stimulation to higher areas of the two panels. A low activation area is generally found in the middle of the untapped panel followed by a higher activation area on the uppermost parts of this panel. This may reflect a spiral-oriented activation of the latex system following the acknowledged spiral alignment of latex and phloem tissues in the tree bark. The concurrent comparison of the metabolic activity, estimated by Pi concentrations, and of corresponding sucrose concentrations can be used as a suitable method in order to describe the functioning of the latex system in the different bark regions of the trunk.
• Areas with low Pi : such physiological profile characterizes a rather inactive latex metabolism, comparable to the physiological status of the untapped tree, although higher Pi and lower sucrose concentrations. These areas are usually located on the untapped panel (lower part excepted) and on the higher parts of the tapped panel, above the tapping cut. These areas do not seem very much involved in the latex regeneration process.
• Areas with high Pi and low Suc (dark gray in figure 3): such physiological profile characterizes an active latex metabolism where sucrose is actually used for latex regeneration (latex regeneration area). These areas are usually located on the tapped panel below the cut and may extend to the bark area above the cut and to the lowest parts of the untapped panel, near the ground.
• Areas with high Pi and high Suc: such physiological profile characterizes an active latex metabolism, where sucrose accumulates (latex sugar importation areas) instead of being used for latex regeneration. When existing, these “buffer” areas are found on the lowest parts of the tapped panel. Sucrose concentration is in such case always higher compared to the equivalent position in untapped panel, although higher latex metabolic activity, creating an important importation sink effect. Such areas seem to represent an intermediary physiological status where metabolic activation is high enough for active sucrose importation but not high enough for latex regeneration. These areas are wider in clone GT1 (medium metabolism) than in clone RRIM600 (medium-high metabolism) whereas they do not exist in clone PB235 (high metabolism). They exist only in case of metabolic activation with a medium stimulation intensity (Et 5/y) and disappear when latex metabolic activation is increased by a higher stimulation intensity (Et 12/y).
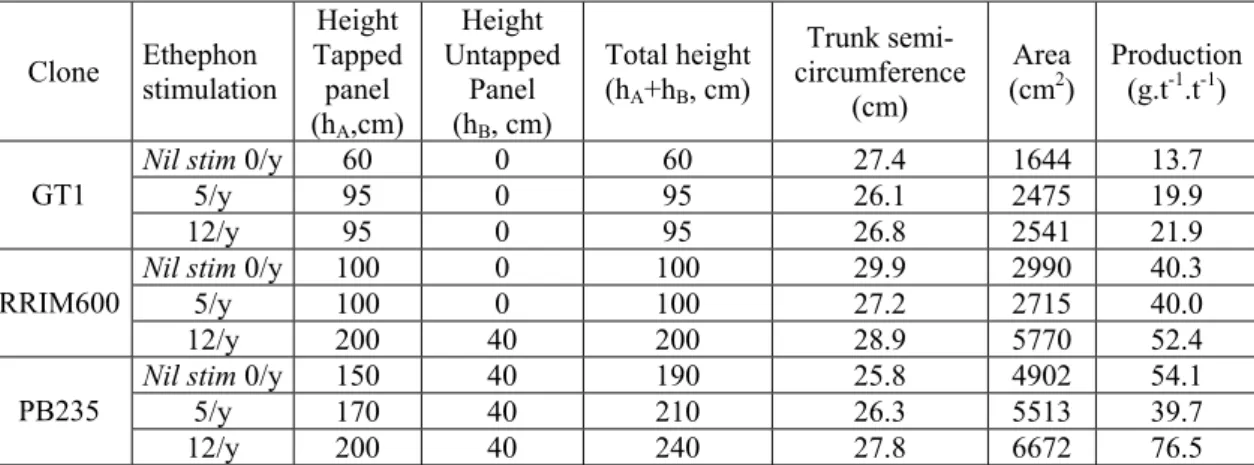
3. Spatial extension of the latex regeneration area. Relation with rubber production.
Figures 3 a,b and c show the suspected latex regeneration areas in dark gray. On such
basis, spatial extension of latex regeneration areas can be rather precisely estimated. Table 2 presents these estimated areas on both panels for the 3 studied clones, depending on exploitation intensity.
Table 2: Extension of the estimated latex regeneration areas (low Suc, high Pi) of the
9 tapped trees (height on tapped panel: hA, height on untapped panel: hB and
corresponding total area expressed in cm2, calculated by the product of the trunk
semi-circumference at the moment of latex sampling and total height of this bark area.
Associated rubber production is expressed in g.tree-1.tapping-1, and corresponds to the
production of last month before latex sampling.
Clone Ethephon stimulation
Height Tapped panel (hA,cm) Height Untapped Panel (hB, cm) Total height (hA+hB, cm) Trunk semi-circumference (cm) Area (cm2) Production (g.t-1.t-1) Nil stim 0/y 60 0 60 27.4 1644 13.7
5/y 95 0 95 26.1 2475 19.9
GT1
12/y 95 0 95 26.8 2541 21.9
Nil stim 0/y 100 0 100 29.9 2990 40.3
5/y 100 0 100 27.2 2715 40.0
RRIM600
12/y 200 40 200 28.9 5770 52.4
Nil stim 0/y 150 40 190 25.8 4902 54.1
5/y 170 40 210 26.3 5513 39.7
PB235
12/y 200 40 240 27.8 6672 76.5
Comparison of the regeneration area, estimated by the product of the total height of latex regenerating bark and monthly dry rubber production at the moment of latex sampling, expressed in g.tree-1.tapping-1 (g.t-1.t-1), shows a highly significant linear relation (r2 = 0.84**) (figure 4).
Figure 4: Multi-clonal linear regression between rubber production (last month
before latex sampling), expressed in g.t-1.t-1, and the estimated latex regeneration area,
expressed in cm2. Regression equation is without constant term, as no production is
characterized by total absence of latex regeneration (untapped tree).
P = f (Latex Regeneration Area) y = 0.010x R2 = 0.844 0.0 20.0 40.0 60.0 80.0 100.0 0 2000 4000 6000 8000
Latex Regeneration Area (cm2)
P rod uc ti on ( g .t -1.t -1)
Estimated latex regeneration areas logically increases together with rubber production. Linear regression curve (P = 0.01 Area) indicates that regeneration of 1 gram of dry
rubber requires, in average, 100 cm2 latex regeneration area., draining an equivalent
latex volume of 3.0 ml (with a latex dry rubber content estimated to 33%). Regression equation has no constant term, as it is logical that no production implies no latex regeneration likewise. It is remarkable that the three clones fit to the same curve, implying that the density of tapped latex vessels is not much different between these 3 clones and that tapping depth was comparable on the three experimental plots.
In order to check the accuracy of the proposed relation, it is possible to estimate the utile thickness of latex tissues (T) allowing equivalence between estimated regeneration area and corresponding drained latex volume:
V (Volume, m3) = A (Area, m2) x T (Thickness, m), with:
• V = 3.0 ml (3.10-6 m3) • A = 100 cm2 (10-2 m2).
3.10-6 = 10-2. T ⇔ T = 3.10-4 m = 300 µm.
Calculated utile latex tissue thickness (T) is estimated at 300 µm. As latex vessel average diameter including membranes is 25 µm (Gomez 1982), and internal diameter excluding membranes is near from 20 µm (de Faλ et al. 1989), our estimation of the latex regeneration area leads to 15 (300/20) efficient latex rings, as each latex ring is composed of a unique latex vessel layer (de Faλ et al. 1989).
Gomez et al. (1972) reported an average of 25 latex rings in tapped bark of most of Wickham Hevea brasiliensis clones. According to this author, only around 60% of the latex rings are usually tapped under normal tapping practice, as the remaining 40% are quite near the cambium and therefore remain untapped (Gomez 1982). This leads to an actual number of 15 actually tapped latex rings, equal to our estimation.
DISCUSSION AND CONCLUSION
The latex sink induced by tapping is confirmed to modify the whole physiological behavior of the tree.
In comparison with untapped tree, tapping, with or without ethephon stimulation, induces a huge depletion (–60% down to –90%) of the latex sucrose concentration at whole trunk scale, even in areas which are not concerned by latex regeneration stricto
sensu. Although proved a rather local process, whose spatial expansion is shown
correlated to the quantitative rubber production, latex regeneration induced by tapping has a huge physiological effect at whole tree scale, at least on latex sugar reserves. This is in accordance with the important negative effect of rubber production on growth and biomass creation of the tapped rubber tree. As a matter of fact, many authors mentioned that the biomass loss of tapped trees in comparison with untapped controls could not be accounted by the rubber production only (Templeton 1969, Wycherley 1976, Sethuraj 1981, 1985, Gohet 1996, Gohet et al. 1996).
Tapping is thus confirmed to modify the whole physiological behavior of the tree. As it occurs in latex, a general decrease of sugar reserves at whole tree level in other storage sinks may therefore be suspected. Such a depleting effect of rubber production on whole tree sugar reserves could be a possible explanation for the apparent discrepancy between rubber production and its huge effect on tree growth.
Results of the current study regarding the latex metabolic activity are based on the comparative description of latex sucrose (Suc) content and concurrent latex inorganic phosphorus (Pi) content in several areas of the trunk bark of Hevea brasiliensis, with a large pattern of exploitation intensities and on three different clones. They confirm previous studies about the latex regeneration area (d’Auzac and Pujarniscle 1961, Tupý 1969, 1973a, 1973b, 1985). Tapping creates a significant depletion of latex sucrose content in tapped panel, as a consequence of its consumption for rubber regeneration. This depression of latex sucrose content is increased by the use of ethephon stimulation, as the rubber production and therefore latex regeneration likewise increases. Accurate estimation of the latex metabolic activity by the level of latex inorganic phosphorus (Pi) is confirmed.
The concurrent analysis of latex sucrose (Suc) and latex inorganic phosphorus (Pi) levels allows a rather precise and easy description of the shape and size of the metabolically active bark area (area with high Pi): Depending on exploitation intensity, this high metabolic activity area extends to the whole tapped panel, including bark areas above the tapping cut, but also to the basal level of the untapped panel. According to the associated sucrose level, this high metabolic activity area can be divided in two distinct secondary areas:
• An area with concurrent low Suc and high Pi, close to the tapping cut, which can be considered as the actual latex regeneration area. In the study-case and whatever
the clone, this area increases by 100 cm2 when production at the moment of the
sampling increases by 1 g.t-1.t-1. Spatial extension of this area is clearly related to clonal latex metabolic typology, as its expansion requires lower intensification of exploitation when clonal latex metabolism is more active (Gohet et al. 2003) • An area with concurrent high Suc and high Pi, more distant to the tapping cut, that
represent highly active sucrose importation areas, whose duty is still unknown (accumulation of sugars for next latex regeneration?) but that do not seem to participate to the latex regeneration process stricto sensu.
The location of the latex regeneration bark area mostly on tapped panel, below and above the tapping cut, confirms former results by several authors but obtained using very different methods like using radio-labeled isotopes (Lustinec and Resing 1965, Lustinec et al. 1969) or turgor pressure measurements (Buttery and Boatman 1966, Pakianathan et al. 1975).
Nevertheless, this study also demonstrates that the use of ethephon stimulation (or more generally a higher rubber production) can extend at least this latex regeneration area to the basal level of the untapped opposite panel.
A frequent bottom-up increasing gradient of latex sucrose concentration along the trunk is observed on untapped trees or on untapped panel of tapped trees. This confirms the results obtained by Tupý (1973a), who showed the existence of such a gradient on PR107 untapped trees and suggested therefore that latex sucrose loading might be in equilibrium with the phloem sap concentration gradient (vertical long distance translocation of sucrose in phloem sieve tubes). If proved, such equilibrium would have been a finding in favor of a symplastic latex sucrose loading, not
depending on latex metabolism, plasmalemma ATPase activity and H+/sucrose
plasmalemma symporters (Patrick 1990). Nevertheless, the absence of functional plasmodesmata between laticifers and neighboring parenchyma cells makes this hypothesis of symplastic latex sucrose loading rather improbable (de Faλ et al. 1989). For this reason, high sugar content of latex extracted from untapped trees, as well as bottom-up increasing concentration gradients in rather non active bark areas (untapped tree, untapped panel of tapped trees), remain quite unexplained regarding sugar loading mechanisms.
As a matter of fact, significant clues are in favor of an apoplastic latex sucrose loading: Presence of sucrose accumulation areas on lower parts of tapped panel of stimulated clones GT1 and RRIM 600 reflects a probable massive activation of the proton-sucrose transmembrane symport to the laticiferous system (Patrick 1990, Lacrotte 1991, Patrick and Offler 1996). It is however impossible to conclude if this increased sink effect in metabolically active bark areas is due:
• to the direct effect of ethylene released following ethephon stimulation.
• to the increased rubber production and subsequent increased metabolic activation resulting from this stimulation.
• or to these two factors interacting together.
Likewise, former studies have shown that such enhancement of sucrose importation could also be found in untapped panel (Silpi et al. 2001) and were significantly related to latex metabolic activation in these bark areas. Relative importance of this sink effect in bark regions located outside the latex regeneration area stricto sensu might be another clue explaining discrepancy between rubber production and associated negative effect on the growth and biomass creation of the tapped rubber tree: All carbohydrates stored inside latex cells, even in areas outside the latex regeneration area, are no longer available for any other metabolisms and in particular for primary biomass creation (i.e. growth). Moreover, such increased sink strength might also be responsible for some still unexplained findings: In particular, overexploitation may lead to a decrease in production but not to any concurrent growth recovery (Gohet 1996, Gohet et al. 1996), as latex sink effect might still be important in such case.
This study presents the first concurrent delimitation and quantification of the latex metabolic activity inside the bark of the untapped and tapped rubber tree at trunk scale, using simple biochemical parameters. Latex diagnosis (Eschbach et al. 1984, Jacob et
al. 1985, 1988a, 1988b, 1995a) is thus proved to be a very useful and powerful tool in
order to study the physiology of the latex producing bark of Hevea brasiliensis. “Latex diagnosis mapping” or “LD mapping” technique allows latex sampling in any part of the trunk bark, as tapping is not required (puncture latex sampling), and is moreover much simpler and more economic compared to the methods previously used to study the delimitation of the regeneration area, like formerly using radio-labeled
isotopes (Lustinec and Resing 1965, Lustinec et al. 1969) or turgor pressure measurements (Buttery and Boatman 1966, Pakianathan et al. 1975). Moreover, former methods only describe size and shape of the latex regeneration area but cannot help in quantifying the metabolic activities of the different bark areas involved or affected by the latex regeneration process.
In addition, histological studies and quantitative analysis of carbohydrates of bark and wood should be performed in order to assess the existing relations between the latex sugar content and the carbohydrates content of the surrounding bark tissues and wood (soluble sugars, starch…). This data, supplemented by a planed survey of bark respiration and biomass increment, should help in a better understanding of the physiological mechanisms involved in regulation of assimilates partition (wood creation, rubber production, respiration and carbohydrates storage) of tapped Hevea
brasiliensis and its response to exploitation intensification.
Such research methodologies could also be used in order to optimize the tapping systems recommendations (high tapping frequencies, reduced tapping frequencies compensated by ethephon stimulation…) and also provide new ideas for finding and/or optimizing new tapping systems like ethylene gas stimulated systems, micro-tapping cut systems and multi-micro-tapping cut systems, as based on a better physiological knowledge of whole rubber tree functioning.
As a matter of fact, Latex Diagnosis Mapping (LDM) may give some important clues for explanation of previously unexplained results. For instance, preliminary LD mapping results on double cut alternative tapping systems experiments resulting in 30% increase in production (Gohet and Chantuma, 2003 a, 2003 b) show a significant increase in latex regeneration area in comparison to the single cut controls, providing first explanations for the achieved extra yields (Chantuma and Gohet, 2004, unpublished data).
REFERENCES
d’AUZAC J., PUJARNISCLE S. (1961) Aperçu sur l’étude des glucides de l’hévéa
et sur leur variation. Rev. gén. Caout. Plast., 38, 1131-1139.
BUTTERY B.R., BOATMAN S.G. (1966) Manometric measurement of turgor
pressures in laticiferous phloem tissues.
.
296
-
283
,
17
. ,
Bot
.
Exp
J.
CHANTUMA P
.
E TEHOG ,
) .
2004
(
Latex Diagnosis Mapping
)
LDM
(
on Double Cut Alternative
tapping
System
.
Unpublished data
ESCHBACH J.M., ROUSSEL D., VAN DE SYPE H., JACOB J.L. (1984)
Relationship between yield and clonal physiological characteristics of latex from
Hevea brasiliensis , Physiol. Vég., 22, 295
de FAκ E., HEBANT C., JACOB J.L. (1989) Cytology and cytochemistry of the laticiferous system, Physiology of Rubber Tree Latex. J. d’Auzac, J.L. Jacob, H. Chrestin , eds, CRC Press Inc., Boca Raton, Florida, United States, 15-29.
GOHET E. (1996) La production de latex par Hevea brasiliensis. Relations avec la
croissance. Influence de différents facteurs : origine clonale, stimulation hormonale, réserves hydrocarbonées. Thèse de Doctorat d’Université. Université Montpellier II - Sciences et Techniques du Languedoc. 343 pages. (The production of latex by Hevea Brasiliensis. Relation with growth. Influence of different factors : clonal origin, hormonal stimulation, carbohydrate reserves. PhD thesis, Montpellier II University, 343 pages).
GOHET E., PRÉVÔT J.C., ESCHBACH J.M., CLÉMENT A., JACOB J.L. (1996) Clone, croissance et stimulation, facteurs de la production de latex chez Hevea
brasiliensis. Plantations, recherche, développement, 3 (1) 30-38.
GOHET E., DIAN K., PRÉVÔT J.C., OBOUAYEBA S., KÉLI J.Z., d’AUZAC J., JACOB J.L. (1997) Relation between latex sugar content, latex metabolic activity
and yield potential of Hevea brasiliensis clones. Symposium IRRDB. IRRDB Annual meeting, Ho Chi Minh City, Vietnam, 11-13 October 1997.
GOHET E., CHANTUMA P. (1999) Micro-Latex Diagnosis. Chachoengsao Rubber
Research Center. Standard Analysis Procedure. RRIT-DOA-MOAC, November 1999.
GOHET E., CHANTUMA P. (2003) Reduced tapping frequency and DCA tapping
Systems : Research towards improvement of Thailand rubber plantations productivity. IRRDB Symposium. IRRDB Annual meeting, Chiang Mai, Thailand, 15-16 September 2003.
GOHET E., CHANTUMA P. (2003) “Double Cut Alternative” Tapping System
(DCA): Towards improvement of yield and labor productivity of Thailand rubber smallholdings. IRRDB Workshop Exploitation Technology, Kottayam, India, 15-18 December 2003.
GOHET E., CHANTUMA P., LACOTE R., OBOUAYEBA S., DIAN K., CLEMENT-DEMANGE A., DADANG KURNIA, ESCHBACH J.M. (2003)
Latex Clonal typology of Hevea brasiliensis: Physiological modeling of yield potential and clonal response to ethephon stimulation. Proceedings of the IRRDB International Workshop on Exploitation Technology, Kottayam, Kerala, India, 15-18 December 2003.
GOMEZ J.B. (1982) Anatomy of Hevea and its influence on Latex Production.
Malaysian Rubber Research Development Board Eds., 75 pages.
GOMEZ J.B., NARAYANAN R., CHEN K.T. (1972) Some structural factors
affecting the productivity of Hevea brasiliensis. I. Quantitative determination of the laticiferous tissue. J. Rubb. Res. Inst. Malaya, 23, 193-204.
JACOB J.L., ESCHBACH J.M., PRÉVÔT J.C., ROUSSEL D., LACROTTE R., CHRESTIN H., d’AUZAC J. (1985) Physiological basis for latex diagnosis of
functioning of the laticiferous system in rubber trees. In: Proceedings International Rubber Conference, Kuala Lumpur, 1985, vol..5, Rajarao J.C. and Amin L.L. eds., Kuala Lumpur, Malaysia, Rubber Research Institute of Malaya, p. 43-65.
JACOB J.L., SERRES E., PRÉVÔT J.C., LACROTTE R., CLÉMENT-VIDAL A., ESCHBACH J.M., OMONT H. (1988) Mise au point du diagnostic latex.
Agritrop, 12, 97-118.
JACOB J.L., PRÉVÔT J.C., CLÉMENT-VIDAL A. (1988) Physiological
parameters of latex from Hevea brasiliensis: their uses in the study of the laticiferous system: Typology of functioning of production mechanisms: Effect of stimulation. In: Proceedings of the IRRDB rubber physiology and exploitation meeting. Hainan, China, 9-12 December 1986, Pan Yanqing and Zhao Canwen, eds. Hainan, China, South China Academy of Tropical crops, p. 136-157.
JACOB J.L., PREVOT J.C., LACROTTE R., ESCHBACH J.M. (1995) Le
diagnostic latex. Plantations, recherche, développement, 2 (2) 34-37.
JACOB J.L., PRÉVÔT J.C., LACROTTE R., CLÉMENT A., SERRES. E, GOHET E. (1995) Typologie clonale du fonctionnement des laticifères chez Hevea
brasiliensis. Plantations, recherche, développement, 2 (5) 43-49.
LACROTTE R. (1991) Etude des relations entre la teneur en sucres du latex et la
production. Approche des mécanismes du chargement en saccharose des laticifères d’Hevea brasiliensis Muell. Arg. Thèse de Doctorat d’Université. Université Montpellier II - Sciences et Techniques du Languedoc. 266 pages. (Study of the relations between latex sucrose content and rubber production. Approach of sucrose loading mechanisms within the laticiferous cells of Hevea Brasiliensis. PhD thesis, Montpellier II University, 266 pages).
LUSTINEC J., RESING W.L. (1965) Methods for delimitation of the flow area by
LUSTINEC J., SIMMER J., RESING W.L. (1969) Trunk contraction of Hevea
brasiliensis due to tapping. Biol. Plant. 11,236.
PAKIANATHAN S.W., WAIN R.L., NG E.K. (1975) Studies on displacement area
on tapping immature Hevea trees. In Proc. Int. Rubber Conf.. Rubber Research Institute Malaysia, Kuala Lumpur, 1976. 225-248.
PATRICK J.W. (1990) Sieve element unloading : cellular pathway, mechanism and
control. Physiol. Plant., 78, 298-308.
PATRICK J.W., OFFLER C. (1996) Post-sieve element transport of
photoassimilates in sink regions. J. Exp. Bot., 48, 1165-1177.
SETHURAJ M.R. (1981) Yield components in Hevea brasiliensis. Plant Cell
Environ., 4, 81-83.
SETHURAJ M.R. (1985) Physiology of growth and yield in Hevea brasiliensis. Proc
Int. Rubb. Conf. , Rubb. Res Inst. Malaysia, ed, Kuala Lumpur, Malaysia, 3-19
SILPI U., CHANTUMA P., KOSAISAWE J., THANISAWANYANGKURA S., GOHET E. (2001) Distribution pattern of latex sucrose and metabolic activity in
response to tapping and ethrel stimulation in latex producing bark of Hevea
brasiliensis Müll. Arg. In "Annual IRRDB Symposium" (J. Sainte-Beuve, ed.).
CIRAD, Montpellier, France.
TEMPLETON J.K. (1969) Partition of assimilates. J. Rub. Res. Inst. Malaya, 21,
259-273
TUPY J. (1969) Stimulatory effects of 2,4-dichlorophenoxy acetic acid and of
1-naphthylacetic acid on sucrose level, invertase activity and sucrose utilization in the latex of Hevea brasiliensis. Planta. 88, 144-153.
TUPY J. (1973a) The level and distribution pattern of latex sucrose along the trunk
of Hevea brasiliensis Muell. Arg. as affected by the sink region induced by latex tapping. Physiol. Vég. 11(1), 1-11.
TUPY J. (1973b) The sucrose mobilizing effect of auxins in Hevea brasiliensis
Muell. Arg. ; dependence on the metabolic activity of the treated tissue. Physiol. Vég.
11(1), 13-23.
TUPY J. (1985) Some aspects of sucrose transport and utilization in latex producing
bark of Hevea brasiliensis Muell. Arg. Biol. Plant. 27(1), 51-64.
WYCHERLEY P.R. (1976) Tapping and partition. J. Rubb. Res. Inst. Malaysia, 24,
![Figure 1: Vertical distribution of latex sucrose content ([Suc], mM.l -1 ) and inorganic phosphorus content ([Pi], mM.l -1 ) in tapped panel of clones PB235, RRIM600 and GT1, depending on distance from the tapping cut (∀ 90 cm)](https://thumb-eu.123doks.com/thumbv2/123doknet/13814052.442045/6.892.107.752.121.905/figure-vertical-distribution-sucrose-inorganic-phosphorus-depending-distance.webp)
![Figure 2: Vertical distribution of latex sucrose content ([Suc], mM.l -1 ) and Latex inorganic phosphorus content ([Pi], mM.l -1 ) in untapped panel of clones PB235, RRIM600 and GT1, depending on distance from the tapping cut (∀ 90 cm)](https://thumb-eu.123doks.com/thumbv2/123doknet/13814052.442045/7.892.106.758.168.947/figure-vertical-distribution-inorganic-phosphorus-untapped-depending-distance.webp)