1
Accelerating Bus Electrification:
Enabling a sustainable transition to low carbon transportation systems
by
Kelly Blynn
B.A., Geography and Environmental Studies, Middlebury College (2007)
Submitted to the Department of Urban Studies and Planning
in partial fulfillment of the requirements for the degrees of
Master in City Planning
and
Master of Science in Transportation
at the
MASSACHUSETTS INSTITUTE OF TECHNOLOGY
February 2018
© 2018 Kelly Blynn. All Rights Reserved
The author here by grants to MIT the permission to reproduce and to
distribute publicly paper and electronic copies of the thesis document in whole
or in part in any medium now known or hereafter created.
Author ...
Department of Urban Studies and Planning
12/14/2017
Certified by ...
Frederick P. Salvucci
Senior Lecturer, Department of Civil and Environmental Engineering
Thesis Supervisor
Accepted by ...
P. Christopher Zegras
Associate Professor, Department of Urban Studies and Planning
Chair, MCP Committee
Accepted by ...
Jesse Kroll
Professor of Civil and Environmental Engineering
Chair, Graduate Program Committee
3
Accelerating Bus Electrification:
Enabling a sustainable transition to low carbon transportation
systems
4
Abstract
Submitted to the Department of Urban Studies and Planning on December 14, 2017 in partial fulfillment of the requirements for the degrees of Master of City Planning and Master of Science in Transportation
With growing agreement that credible pathways to zero carbon electricity exist, many support the notion that widespread electrification of the transportation sector will be an essential strategy for meeting scientifically-based midcentury climate goals. While transit buses have a relatively small impact on greenhouse gas emissions, they have a larger impact on urban air quality, have commercially available in-service electric models, and have historically commercialized clean technologies that enabled deployment in the rest of the heavy duty vehicle sector. This thesis seeks to understand what factors hinder or enable transit agencies to go beyond initial pilots to largely or wholly electrify their fleets, with the goal of understanding potential policies and strategies that could accelerate such a transition, without inhibiting existing or expanded transit service that also plays a key role in reducing carbon emissions, in order to improve local air pollution and support accelerated electrification of trucks and other heavy duty vehicles. Using public transit fleets in California, Kentucky, and Massachusetts as case studies, this thesis utilizes quantitative total cost of ownership and well-to-wheels greenhouse gas and air pollutant emissions analysis, and analysis of qualitative interviews with transit agency representatives to investigate the barriers, drivers, and potential solutions that could hinder or enable an accelerated yet sustainable transition to an electrified bus fleet. A total cost of ownership analysis reveals that electric buses may already be more cost effective than diesel buses in many case study utility service areas primarily due to fuel and maintenance cost savings, but are sensitive to key parameters such as annual mileage, electricity tariffs that vary widely by location, fossil fuel costs, policy context, and anticipated maintenance savings, and that cost savings from electric buses are likely to increase over time primarily due to anticipated reductions in battery costs and a faster increase in fossil fuel prices than electricity prices.
While multiple agencies interviewed in California were planning to fully electrify their fleets, primarily due to political pressure and internal leadership, outside California where less supportive policies exist, fewer agencies were planning to procure additional electric buses, primarily due to high first cost and undesirable tradeoffs with maintaining or expanding transit service levels. Interview respondents reported other substantial barriers as well, such as oversubscribed discretionary grant programs, charging infrastructure costs, electricity costs, additional operational complexity, and performance uncertainty and risk, suggesting a need for multiple complementary policies to overcome these barriers and ensure agencies can transition to a new technology without impacting service. Important interventions identified include pursuing favorable electricity tariffs and electric charging infrastructure incentives through regulatory changes, and further leveraging limited public funds such as the Volkswagen settlement to develop low cost financing approaches similar to those utilized in the clean energy sector that can pledge anticipated operating savings to afford the incremental upfront cost. A set of complementary policies is then recommended to accelerate bus fleet electrification in each case study context, in order to achieve carbon reduction and air quality improvements for low income, urban communities without impacting transit service levels, and to help lead the way for the transition of other heavy duty fleets.
Thesis Supervisor: Frederick P. Salvucci
Title: Senior Lecturer, Department of Civil and Environmental Engineering Thesis Reader: John P. Attanucci
Title: Research Associate, Department of Civil and Environmental Engineering Thesis Reader: P. Christopher Zegras
5
Acknowledgements
To my advisor, Fred Salvucci, thank you for pushing me even in the last hours to make this thesis better, for encouraging me throughout my time at MIT, and for the opportunity to be your TA. I’m grateful to have gotten to spend most Friday afternoons these past few years drinking coffee, listening to your stories and jokes, and learning from your principled, politically strategic, technically smart approach to complex transportation problems that you’ve applied in your career. To my reader John Attanucci, thank you for lending your experience as a transit professional to provide really insightful and critical feedback on the modeling work in particular, as well as the entire thesis. To my reader and RA advisor Chris Zegras, thank you for your invaluable help in honing my research design, and for the incredibly interesting and educational experience of being part of the CoAXs team. And thank you especially to Harvey Michaels for lending your experience and expertise in the electricity sector to strengthen that aspect of my thesis.
I’m also grateful to have had wonderful collaborators and supporters on this thesis outside of MIT, and want to express my thanks all those who I interviewed or had background conversations with for their time. Thank you in particular to Holmes Hummel of Clean Energy Works who reviewed drafts and offered excellent feedback and insights to guide my research approach, and connected me with key stakeholders in each case study. Thank you especially to the advocates, transit agency staff, and other stakeholders I had a chance to interact with from the Union of Concerned Scientists, Greenlining Institute, Jobs to Move America, Kentuckians for the Commonwealth, the Sierra Club, and others who are doing inspiring work to advance a just, sustainable transition to electric bus and other vehicle fleets.
To the DUSP and MST staff including Sandy Wellford, Ellen Rushman, Duncan Kincaid, Ruth Yiu, and others, thank you for helping me and so many others navigate the thesis process and MIT experience. To my academic advisor, Ezra Glenn, thank you for your encouragement, as well as for lending your support to our efforts for graduate housing. To the professors at MIT who made me work harder, think harder, and learn more than at any other time in my life, thank you, including Ignacio Pérez-Arriaga, Justin Steil, Phil Thompson, Jinhua Zhao, Karl Seidman, Carolina Osorio, and many others.
To the many wonderful friends I met through DUSP and the MST, thank you for continuing to inspire me through your hard work, creative ideas, and pursuit of justice, including the Undercommons crew, the Graduate Student Apartments Now (GSAN) team, and many more. And thank you to my problem set companions in Econ (Rachel, Insiyah, and Sam) and the MST core courses (Ari and Eli), who made some tough classes a joy and a real learning experience. To the CoAXs team, I’m grateful to have learned so much from working with you and from such an interesting, complex research project.
350.org friends – Jamie, Jeremy, Jon, May, Phil, Will, Bill, Anna, Jason, and many more – thank you for never letting me forget the urgency of the climate crisis, and for providing such inspiration to keep working harder to give what I can to the climate movement. Coalition for Smarter Growth and Montgomery County friends – Stewart, Cheryl, Alex, Aimee, Casey, David, Dan, and many more – thank you for providing me with a grounding in the practice and politics of planning, I can’t say how well that’s served me in providing me a compass to navigate my grad school experience and beyond.
To my family, thank you for supporting me in this educational pursuit and for understanding when I didn’t return phone calls in a timely manner. To Max, it’s an understatement to say I couldn’t have done this without you. Thank you for coming with me to Boston, for believing in me when I struggled to believe in myself, for just being there with me through this experience. I’m so glad you’ve found such intellectual engagement here in Boston, and I can’t wait to support your next steps now.
6
Table of Contents
1. Introduction ...7
1.1 Motivation and purpose ...7
1.2 Research questions and methods ...8
1.3 Thesis structure ...10
2. Background: Emissions reduction in the energy and transportation sectors ...11
2.1 Climate change mitigation in the transportation sector ...11
2.2 Learning from clean energy adoption strategies ...14
2.3 Heavy duty vehicle electrification ...17
3. Electric bus total cost of ownership and well-to-wheels emissions analysis ...26
3.1 Developing a total cost of ownership model ...26
3.2 Battery electric bus total cost of ownership analysis ...43
3.3 Lifecycle emissions model inputs, assumption, and approach ...49
3.4 Battery electric bus lifecycle emissions comparison ...53
4. Qualitative analysis of bus electrification case studies ...57
4.1 Introduction to case study state contexts: California, Kentucky, and Massachusetts ...57
4.2 Qualitative interview analysis ...66
5. Quantitative analysis of bus electrification case studies ...87
5.1 Total cost of ownership variability by utility and policy contexts ...87
5.2 In-depth total cost of ownership and lifecycle emissions case study: MBTA ...92
6. Potential solutions to accelerate bus electrification ...106
6.1 Motivation strategies ...106
6.2 Capital cost strategies ...108
6.3 Operating cost strategies ...118
6.4 Technical/Information strategies ...124
6.5 Summary and recommendations ...125
7. Conclusion ...130
7.1 Summary of findings ...130
7.2 Future research ...132
7
1. Introduction
1.1 Motivation and purpose
In 2014, the Intergovernmental Panel on Climate Change reported that without action, greenhouse gas emissions from the transportation sector are likely to double by 2050 (Pyper 2014). Meanwhile, transportation surpassed electricity as the top emitting sector in the United States in 2016 for the first time since the 1970s (Plumer 2016). As emissions from the electricity grid have decreased dramatically in recent years due to a combination of natural gas edging out coal and policy efforts, a consensus amongst climate and energy experts termed “environmentally beneficial electrification” has emerged that “meeting aggressive GHG reduction goals will require electrification of end uses such as space heating, water heating, and transportation.” (Dennis, Colburn, & Lazar, 2016). Researchers have projected multiple credible pathways to achieving 80% cuts in emissions by 2050, all of which rely heavily upon the electrification of the transportation sector (D. J. H. Williams et al., 2015).
This thesis is motivated by the urgency of the climate crisis, and seeks to illuminate equitable pathways for accelerating decarbonization of the transportation sector. Inspired by the incredible growth in investment in renewable energy and energy efficiency in recent years, this thesis at a high level seeks to understand what it would take to address barriers through policy interventions and other strategies in order to accelerate electrification of a small portion of the transportation sector, transit buses. Through in-depth, mixed-methods case studies of a single vehicle class across different contexts, this thesis provides an example for studying the barriers and drivers affecting fleet managers’ decisions to invest in electric vehicles, and identifying solutions to support adoption.
Transit buses were selected as the focus of this research because 1) there are commercially available models that multiple researchers estimate are cost competitive on a total cost of ownership basis; 2) electrifying transit fleets represents an important way to ensure the benefits of public investment in transportation electrification reaches low income, transit-dependent communities most impacted by mobile source air pollution; and 3) transit buses previously have served as a test case in driving clean technology adoption in the heavy duty vehicle sector, which accounts for a large share of mobile source emissions in comparison with the number of vehicles on the road due to their typically lower fuel economy and higher utilization. For these reasons, understanding what it would take to electrify the nation’s transit fleets seemed a worthy effort that could provide valuable insights for accelerating electrification of other fleets.
While transportation electrification appears to be the most likely, rapid way to reduce emissions from the transportation sector, it is clearly not the only nor the optimal pathway. While many decarbonization pathways do not rely upon shifting travel behavior, most acknowledge that such strategies would importantly reduce the demand for electricity, not to mention the numerous health and fiscal co-benefits for communities of investment in smart growth and sustainable transportation options. Transit buses are unique amongst other vehicle fleets in that, while they directly emit air pollutants and greenhouse gas emissions, they indirectly reduce emissions through supporting land use and travel behavior that enables transit-oriented communities to rely less on private vehicles. Buses in particular are the foundation of public transit systems throughout the United States, and the expansion and improvement of bus service is an essential component of strategies to reduce car reliance. As a result, this thesis also considers the impacts of transit service expansions, which pose financial challenges for public transit agencies as well as direct emissions challenges that must be met. Because of transit’s indirect climate benefits, as well as a history of transit agencies serving as guinea pigs for unproven technologies previously, this thesis attempts to inject a note of caution to regulators, government officials, and advocates to carefully consider
8
how to support, rather than simply force, transit agencies to electrify, to avoid unintended consequences of adversely impacting existing and expanded transit service. This thesis instead focuses on strategic pathways that can help accelerate a successful transition to an electric bus fleet that can be replicated in other vehicle sectors and avoid lock-in to more procurements of fossil fuel buses by focusing on support for transit agencies to overcome barriers to electrification.
1.2 Research questions and methods
1.2.1 Research questions
To understand what it would take to electrify the nation’s bus fleets, my primary research question asks: What factors increase or decrease the likelihood of public agency procurement of battery electric buses, as defined by total cost of ownership and lifecycle emissions analysis, as well as stated barriers and drivers, according to transit agencies across different contexts? In order to answer this, I investigate the following sub questions through the research methods outlined below:
1) How do lifecycle emissions and total cost of ownership for battery electric buses compare with conventional diesel, hybrid, and CNG vehicles across different contexts, and what factors are the most important in determining this variability?
2) What are the barriers and drivers influencing electric bus deployment that transit agency representatives report?
3) What are agencies’ stated intentions to procure additional electric buses, and what are the primary reasons for their procurement decisions?
1.2.2 Methods
To answer these questions, this research uses both qualitative and quantitative methods to study three case studies in Kentucky, California, and Massachusetts in order to assess what factors influence deployment of electric buses. Robert Yin suggests case studies are useful research designs when studying a contemporary issue unfolding in a real-life context, when “the boundaries between phenomenon and context are not clearly evident”, and when answering a “how” or “why” question (Yin, 1981). Because electric bus adoption is a current issue, in which I suspected the context might matter but was unsure to what extent, and wanted to understand the underlying factors driving why agencies are choosing to invest in electric buses, case studies seemed to be an appropriate approach.
Cases were selected amongst states where multiple public transit fleets are already operating electric buses, and therefore may be more likely to consider larger scale adoption, and that differ along other dimensions I hypothesized would affect electric bus diffusion, such as environmental policy, political, and electricity sector context. California is often the national leader in environmental policy, which has also been true in the case of electric bus deployment, having implemented a wide variety of complementary policies and programs designed to accelerate transportation electrification. Massachusetts often follows close behind California, and has similar climate and clean transportation policies, though has generally far fewer incentives and supportive policies designed to support electric bus deployment, and so offers a counter example to California. Finally, Kentucky represents a much more conservative political and policy context than either Massachusetts or California, which is likely similar to the context for many bus fleets operating in small and medium sized communities, in which very few state or local supportive policies exist and agencies must rely on federal funds and often minimal local funds. The differences in policy and political contexts relevant to electric bus diffusion is further elaborated in Chapter 4.
9
Gaber and Gaber recommend applying mixed methods to planning research in order to understand the complexity and nuance of many planning problems, and avoid “misdiagnosis of planning issues or misdirection of preferred solutions” (Gaber & Gaber, 1997). They suggest mixed methods can be used for a variety of purposes, including development, or to have one method inform another sequentially, and complementarity, or to “measure overlapping, as well as different, aspects of a phenomena in order to enrich the understanding of that phenomenon”. Mixed methods served both purposes for this research, with insights from semi-structured interviews and qualitative analysis used to inform quantitative cost modeling, and both qualitative and quantitative methods used to understand different aspects of the same problem, as well as overlapping aspects from different perspectives. Robert Weiss in Learning from Strangers also highlights that interviews can be useful ways to bridge “intersubjectvities”, or to help readers “grasp a situation from the inside”; given that I nor many policymakers have ever managed a bus fleet, understanding people’s perspectives who do was a critical part of this research (Weiss, 1995). Research methods designed to understand barriers and solutions to energy efficiency and clean energy investment also informed the methods of the case studies, based on an assumption that electric vehicle adoption may face similar challenges. Love and Cooper highlight the importance of understanding energy consumption from both a social and technical perspective (Love & Cooper, 2015):
Research understanding energy consumption is usually approached from either an engineering or social science perspective. The result is either understanding technologies and materials or understanding people. Yet, energy consumption is clearly an interaction between people, materials and technologies. So understanding them with separate studies or data that miss this interaction fails to grasp the sociotechnical nature of energy consumption.
The mixed methods approach of this research was designed to understand the complex interaction between people, organizations, and technologies that interact to influence electric bus adoption decisions.
QUALITATIVE METHODS
The qualitative portion of this research involves different forms of data collection, including a review of relevant public policy affecting electric bus diffusion, analysis of public statements, documents, and data for each case, and semi-structured interviews with 14 transit fleet representatives across 12 transit agencies. A list of interviewees can be found in Section 4.2. Fleets were identified by whether they had procured (or were in the process of procuring) electric buses (though one Kentucky fleet without electric buses was added given the small number of Kentucky fleets), and individual participants were identified either through snowball sampling or cold e-mailing agencies. Given its small size, the sample cannot be considered representative of all transit fleets in the three case study states, but may provide an indication of the perspectives of early adopter agencies of electric buses across different contexts and factors that will likely impact other fleets. Additionally, the interviewees themselves do not fully represent the perspectives of their agencies, some of which are large and complex bureaucracies, since I mostly was only able to speak with one person per agency. In addition to the primary interviews, background conversations with stakeholders representing utilities, government sector, and non-profit actors engaged in work relevant to electric bus deployment were conducted in each state to better understand the policy context and other important factors impacting electric bus deployment, and were identified primarily through snowball sampling. A list of background interview organizations can be found in the Appendix. Interview notes or recordings were coded using qualitative analysis software to identify, categorize, and summarize key barriers and drivers across fleets, as well as to analyze individual agencies’ decisions and rationales regarding whether to further electrify their fleets, which are summarized in Section 4.2.
10 QUANTITATIVE METHODS
The quantitative analysis portion of the case studies seeks to understand the economic and environmental costs and benefits affecting electric bus diffusion, and was actively informed by the insights gleaned from the qualitative analysis. The primary method utilized was the development of a total cost of ownership and well-to-wheels greenhouse gas emissions model to estimate electric bus capital costs, operating costs, and emissions impacts in comparison with other fuel types in different geographies, over different time scales. The model was developed based upon approaches from lifecycle cost and emissions models developed by federal labs and in academic literature, and data inputs systematically gathered for each key parameter that determines a bus’s total cost of ownership, including public sources such as the National Transit Database (NTD), National Renewable Energy Laboratory (NREL) and other government studies, electricity tariff data, and manufacturers’ or fleets’ own data where possible. EPA MOVES and Argonne Labs’ AFLEET models were utilized to estimate criteria pollutant emissions.
A sensitivity analysis was then conducted with the model to understand the relative importance of key parameters. The model was then applied to fleets across the three case studies varying limited inputs such as electricity tariff and capital and operating subsidies to understand how total cost of ownership varied across contexts. Additionally, I had the opportunity to complete a fellowship at the Massachusetts Bay Transportation Authority (MBTA) working on their Integrated Fleet and Facilities Planning process, which informed a more detailed analysis of the total cost of ownership and lifecycle emissions impacts of different bus technology and fleet expansion scenarios, the results of which are included in Chapter 5.
SYNTHESIS OF SOLUTIONS
The case studies conclude by synthesizing the results of the qualitative and quantitative analysis to inform recommended strategies for different stakeholders to enact to accelerate electric bus deployment in each case study state. Solutions are identified based on reported effectiveness of existing policies and strategies by interviewees, ideas from interviewees and other stakeholders, and from adapting successful clean energy sector policy interventions to electric bus deployment, in order to systematically attempt to identify sets of complementary strategies that can address the multiple barriers facing agencies transitioning their fleets to electric buses.
1.3 Thesis structure
The remainder of this thesis is structured as follows:
• Chapter 2 includes background research and a literature review of climate change mitigation strategies in the transportation sector, lessons from the “energy efficiency gap” and adoption of clean energy technologies, and the potential for heavy duty electric vehicle deployment.
• Chapter 3 outlines the data, assumptions, and approach to the total cost of ownership and well-to-wheels emissions model designed to analyze the cost and emissions benefits and tradeoffs with other bus technologies, and conducts a sensitivity analysis to understand the key drivers of total cost of ownership savings for battery electric buses in comparison with conventional buses. • Chapter 4 introduces the three case studies in California, Kentucky, and Massachusetts, and
conducts a qualitative analysis of the reported barriers and drivers of electric bus deployment. • Chapter 5 presents a quantitative analysis of the estimated total cost of ownership across the case
study contexts, as well as a more in-depth case study of the MBTA.
• Chapter 6 synthesizes the findings from the qualitative and quantitative analysis to recommend policies and strategies that could be adopted to support electric bus adoption.
• Chapter 7 concludes with a summary of the findings of this research, areas for future research, and a final discussion and conclusion.
11
2. Background: Emissions reduction in the energy and
transportation sectors
2.1 Climate change mitigation in the transportation sector
This section summarizes the literature addressing strategies to reduce emissions from the transportation sector, with a particular focus on the emerging consensus around strategic electrification, and concludes with concerns, considerations, and approaches to ensure strategic electrification can be effective and equitable in the face of coming disruptions in the transportation sector.
2.1.1 History and present context of transportation emissions reduction strategies
Transportation mitigation literature tends to focus on similar sets of strategies for emissions reduction, principally technological change, pricing mechanisms, transit and smart growth strategies, and behavior change (Anable, Banister, & Schwanen, 2011). In some ways, these can be understood as two overarching pathways, with economic instruments, transit investments, and smart growth strategies aimed to enable more permanent behavioral and lifestyle shifts in which people drive less.PRICING AND BEHAVIOR CHANGE STRATEGIES
While economists tend to champion congestion pricing, gas tax increases, and other pricing mechanisms as “first best” policies for minimizing the externalities of driving, such policies face daunting political challenges, and have been implemented in just a handful of cities worldwide. As with other sectors, transportation mitigation suffers from collective action and principal agent challenges in which costs are more concentrated than the long term benefit of a stable climate (Jenkins, 2014). For example, Jenkins finds that the range of potentially acceptable carbon prices in the United States is between 60% to two orders of magnitude lower than estimates of the full social cost of carbon (Ibid). The gas tax is an important corollary specific to the transportation sector: a recent poll found 66 percent of Americans oppose an increase in gasoline taxes of 25 cents per gallon even if revenues were used entirely to reduce the federal income tax (Leiserowitz et al., 2013). Other transportation behavior-shifting policy has faced similar political challenges: in recounting the experience of the EPA in enforcing air quality standards from 1970 to the early 2000s, Howitt and Altshuler conclude that any policies or mandates aimed at restricting personal travel behavior have proved to be thus far politically infeasible, as policies such as parking pricing, parking freezes, or even employer trip reduction programs inspired sharp political backlash (Howitt & Altshuler, 1999).
TRANSIT AND LAND USE STRATEGIES
Transit investment and transit-oriented development have tended to be somewhat more politically feasible strategies, and have been effective to the extent of enabling more sustainable travel options and lifestyles, though it has also proven difficult to increase transit investment and density, and such strategies may be less effective without reinforcing, less politically feasible driving restraining policies. Numerous researchers across multiple transit-served U.S. city contexts have identified a “transit leverage” or “transit land use multiplier” effect, in which the observed reduction of automobile travel is greater than the direct replacement of car travel by passenger miles of transit travel, on the order of 1.4 to 9 times the direct number of miles displaced by transit (American Public Transportation Association, 2009). Researchers hypothesize that transit enables greater density and land use mixes that in turn enable shorter or fewer auto trips, lower auto ownership, and more trips taken by walking, bicycling, or transit. As a result, strategies to increase transit service and non-auto mode share through transit investment and land use
12
planning have been a key part of some climate strategies, notably California’s SB375 law that incentivizes compact development and transit investment to address regional air quality and greenhouse gas emissions, though such strategies can be difficult to enforce and land use patterns are slow to change.
TECHNOLOGY STRATEGIES
Howitt and Altshuler note that “politically feasible auto technology mandates have proved quite cost effective relative to more controversial efforts to regulate personal behavior”, which have been the primary mechanism used to regulate mobile source air pollution for decades under the Clean Air Act (CAA). These mandates have been effective, though contain critical flaws, notably their reliance on fleet average fuel economy, and their application to new vehicles only. In 2007, the Massachusetts v. EPA supreme court decision found the EPA also has the authority to regulate CO2 emissions under the CAA,
so when efforts towards national cap and trade legislation faltered in 2009, the Obama administration moved in this direction, using the EPA’s authority under the CAA to promulgate new, stricter auto emissions standards, raising CAFE standards to 54 miles per gallon by 2025.
CONSENSUS ON A “TECHNOLOGY PATH” FOR TRANSPORT MITIGATION?
While researchers estimate the impact of new fuel economy standards on transportation emissions will be substantial (an estimated 50% reduction per mile for passenger vehicles), they nevertheless anticipate that it is insufficient to reach midcentury climate goals for the transportation sector (James McCarthy, 2016). Authors of the Deep Decarbonization reports estimate that the average fleet fuel economy of light duty vehicles would need to exceed 100 miles per gallon gasoline equivalent by 2050, and 80-95% of miles driven from gasoline would need to shift to electricity or hydrogen (D. J. H. Williams et al., 2015). As battery prices have fallen precipitously, electric vehicles have become cost competitive, and the electric grid emissions intensity has dropped, a growing body of literature has suggested that a “technology path” of transportation electrification is both a viable and critical strategy for reducing emissions in line with 80% by 2050 goals (Dennis et al., 2016; J. H. Williams et al., 2012). A survey of multiple decarbonization pathways concluded that the studies “overwhelmingly focus on electrification of transport, principally by means of electric vehicles and plug-in hybrid electric vehicles, as the best way to decarbonize the sector.” (Loftus, Cohen, Long, & Jenkins, 2015). These scenarios rely heavily on a near decarbonization of the electricity grid by 2050, which recent experience suggests may be feasible if trends continue. Between 2003 and 2013, national electricity emissions intensity (unit of emissions per unit of electricity produced) fell 15%, while some regions such as the northeast fell by 40% (Alexander, 2015). Researchers have also suggested electric vehicles can be a win-win for utilities, by better utilizing utility assets through more off-peak electricity sales, which can also put downward pressure on electricity rates (Plug In America, 2016). Additionally, there is already a greater amount of battery storage deployed in electric vehicles than as stationary storage, presenting enormous potential for in-service or used electric vehicle batteries to support renewable energy integration.
Overall, transportation electrification appears to be an essential strategy for meeting midcentury climate goals that may have important co-benefits for the electricity grid; however, the rate of adoption of electric vehicles thus far is still far below what is required to meet those ambitious pathways, and other researchers suggest that electrification alone may not be sufficient.
IS ELECTRIFICATION ALONE SUFFICIENT FOR A JUST CLIMATE AND TRANSPORTATION FUTURE?
While this “technology path” has historically been more politically acceptable due to its focus on a more limited set of corporate stakeholders, some experts believe that focusing on electrification alone may not
13
be sufficient or desirable for meeting midcentury climate goals, particularly as new trends like shared mobility and automation begin to change the transportation sector.
Some proponents of electrification do not believe there is a need to reduce per capita vehicle miles traveled (VMT), though they acknowledge reduced VMT would lessen the requirements of increased renewable energy deployment to serve new transportation load (D. J. H. Williams et al., 2015). The decarbonization literature also tends not to address the potential for increased VMT in the future; the EIA projects that due to slow turnover in the vehicle fleet and growth in VMT, light duty emissions will be reduced just 20% by 2030 rather than the full 50% per mile reductions established by the CAFE standards (James McCarthy, 2016). While some recent studies suggest personal VMT growth may have stabilized, commercial and heavy duty vehicle travel has continued to rise, and some researchers estimate VMT could more than double with the rise of autonomous vehicles (Wadud, 2016).
The UC Davis Institute of Transportation Studies and ITDP coined the phrase the “three revolutions” to describe the coming trends of electrification, automation, and shared mobility, with the last revolution also including “strong policies for urban planning that favor compact cities, walking, cycling, and public transport” (Fulton et al., 2017) Modeling the potential impacts and interactions of these three trends, the report estimates that automation alone would significantly increase emissions by 2050, while automation and electrification together would reduce emissions consistent with a 2-degree global rise in temperature, and all three trends together would dramatically decrease emissions consistent with a 1.5 degree global target (Fulton et al., 2017). Other researchers have reached similar conclusions with respect to the potential impact of automation, particularly without policies to guide implementation, “finding that automation might plausibly reduce road transport GHG emissions and energy use by nearly half – or nearly double them – depending on which effects come to dominate.” (Wadud, 2016).
Additionally, researchers and advocates alike have questioned whether the focus on deployment of electric vehicles will help or hinder existing societal inequalities. Some have begun to notice that electric vehicle investment by the public sector thus far has primarily accrued to the wealthy, with some controversy surrounding such findings that since 2006, 90% of federal income tax credits for buying hybrid and electric vehicles went to the top income quintile of U.S. households (Borenstein et al., 2016). In California, researchers found that 83% of rebates for electric vehicles went to recipients with incomes over $100,000, and that black and Hispanic majority census tracks were less likely to receive rebates even when income was accounted for (St-Louis & Rubin, 2016). Since the data was published for that research, the state passed legislation that made wealthy households ineligible for rebates and increased rebate amounts for low and moderate income people (Ibid).
A JUST SUSTAINABILITY APPROACH TO TRANSPORT ELECTRIFICATION
In addition to privileging higher income drivers, some researchers and advocates have also stressed that the approach of simply replacing today’s private vehicles with low emission ones fails to address the existing inequalities in access to a private vehicle and quality public transit for marginalized communities. Mullen and Marsden argue that “the existing policy approach which tries to tackle transport pollution primarily through a shift to low emission vehicles… privileges those with access to private vehicles” (Mullen & Marsden, 2016). As early as 2011, California environmental justice advocates at the Greenlining Institute were highlighting concerns as the state began investing in EVs that “many California communities – particularly communities of color – may get relatively little benefit from EVs, which are often seen as expensive and unattainable”, and were stressing the importance of developing equitable approaches in partnership with disadvantaged communities to improve public transportation and create access to new jobs in zero emission vehicle manufacturing and deployment (Song, 2011).
14
Julian Aygeman has developed the concept of just sustainability, or “a better quality of life for all, now and into the future, in a just and equitable manner, whilst living within the limits of supporting ecosystems” that some researchers have used to consider a more just, equitable transportation future (Iles, 2013). Inspired by Aygeman’s just sustainability concept, some researchers have sounded the alarm over the industry and technocrat-dominated discussions of our future transportation systems, and stressed the importance of community-informed, context-sensitive approaches to help “assure that everyone can benefit from less pollution, not only those with money. Without such institutional and political innovations, alternative fuels and technologies may not become sustainable substitutes for the oil-fueled system we have now” (Iles, 2013). The approach of this thesis strives to identify a just sustainability path forward for electrification, inspired by the advocates met through this research that are showing the way to more equitable electric vehicle deployment that seeks to clean up heavy duty fleets that impact public health, increase access to electrified public transport, and spur green job creation in the clean vehicle industry. Adger argues that sustainability policy decisions will be more context-sensitive and durable if we can “pay simultaneous attention to the four criteria that challenge the problem-solving capabilities of most decision makers concerned with environmental governance” (Adger et al., 2003). This thesis attempts to consider these perspectives in identifying solutions to accelerate electrification of public transit vehicles that can simultaneously satisfy these four criteria: efficiency (or cost effectiveness), effectiveness (the ability for the policy to achieve a desired outcome), equity (the distributional consequences of environmental decision-making), and legitimacy (or political acceptability).
2.2 Learning from clean energy adoption strategies
While much has been written about the more gradual diffusion of renewable energy and energy efficiency technologies than would be expected based on their cost effectiveness and societal benefits, there has been a dramatic acceleration in clean energy investment in recent years. As of 2016, wind and solar have achieved majority market share, accounting for two thirds of all new generation capacity on the U.S. grid, and energy efficiency investments increased 17% between 2011 and 2016 to top $7.5 billion in 2016 (Consortium for Energy Efficiency, 2017; Donohoo-Vallett, 2016). While many different policy strategies have been deployed to help achieve these results that are difficult to disentangle, understanding the research and policy approaches to addressing previously gradual diffusion of clean energy and energy efficiency provides useful insights for overcoming barriers to accelerated electric vehicle diffusion.
2.2.1 The energy efficiency gap
Given the similar economics of electric vehicles to energy efficiency investments, understanding the literature of the so-called “energy efficiency gap” and how practitioners have bridged it could offer insights to overcoming the gradual diffusion of electric vehicles. Numerous studies have illustrated a dynamic in energy efficiency whereby despite estimated potential CO2 reductions and monetary savings
from energy efficiency investments, consumers and firms decide to invest in certain technologies at a far slower rate “than would be expected if consumers made all positive net present value investments” (Carvallo, Larsen, & Goldman, 2015). Researchers have debated extensively how large the energy efficiency gap actually is due to hidden costs and uncertainty not accounted for in simple payback calculations, as well as the reasons for consumers making economically suboptimal decisions.
Barriers to energy efficiency investment, or “postulated mechanism(s) that inhibits investment in technologies that are both energy-efficient and (apparently) economically efficient”, can be categorized in a variety of ways, but tend to fall into 1) economic barriers such as up-front cost or capital limitations, 2) information barriers such as technology uncertainty or lack of baseline energy use data, 3) organizational barriers such as debt limitations or lack of internal capacity, 4) policy or regulatory barriers, and 5) behavioral barriers (Sorrell et al., 2000). One key finding from the energy efficiency barriers literature has
15
been that barriers are heterogeneous across customer types (such as industrial, commercial, and residential), and thus require different solutions for different sectors. Additionally, researchers have found that barriers are frequently interdependent, such that solution sets must seek to complementarily address multiple barriers (Chai & Yeo, 2012). Figure 2-1 from McKinsey illustrates a systematic approach to identifying barriers and mapping a complementary set of solutions to overcome them.
Figure 2-1: Example of systematic barrier and solution identification (Granade et al., 2009)
2.2.2 The role of finance in accelerating clean energy investment
While incentives funded through tax credits, utility charges, or other means have played a key role in overcoming economic barriers to clean energy and energy efficiency adoption, generally “appropriated funding for energy-efficiency improvements has fallen far short of what is necessary to meet energy reduction targets” (Vaidyanathan et al., 2013). Additionally, the instability of public subsidies has been problematic: “Plotted on a graph, the history of clean-energy production in the United States resembles the blade of a saw, rising and falling each time subsidies came and went.” (Peretz, 2009). Policymakers have thus turned to financing to make up for the shortfall in public subsidies, further leverage limited public funds, and create a more durable, self-sustaining approach to stimulate investment that can garner support in an era of fiscal austerity (Vaidyanathan et al., 2013). Figure 2-2 highlights the potential leverage of different approaches to using public funds. Different financing approaches can also help to address particular barriers, such as customer access to capital, cash flow issues, cumbersome application processes, and debt limitations (Leventis, Martin Fadrhonc, Kramer, & Goldman, 2016).
16
Figure 2-2: Comparing the leverage of public funds (Zimring, Borgeson, Todd, & Goldman, 2013)
Public and private actors have created a variety of energy efficiency finance mechanisms, which generally refer to “debt or debt-like products that support the installation of energy efficiency measures by allowing costs to be spread over time” (Leventis et al., 2016). Governments and utilities have supported the creation of financing programs, particularly when the private market hasn’t engaged due to high risk, uncertain returns, or other reasons, by directly acting as the lender through a state energy office or revolving loan fund, offering credit enhancements like loan loss reserves (LLR) or interest rate buy downs to leverage private capital, passing enabling legislation for certain types of energy efficiency finance, creating standardized energy saving forecasting and verification protocols, and helping to subsidize energy audits to reduce the barriers to investment.
Today, government and utility run energy efficiency finance programs are fairly ubiquitous, with over 200 state, local, and utility programs across nearly every state for most customer classes (Palmer, Walls, & Gerarden, 2012). In 2014, researchers estimated that energy efficiency finance programs in the U.S. were investing $4.8 billion per year, and that loan amounts across different types of financing programs were growing between 4% and 210% per year between 2011 and 2014 (Deason, Leventis, Goldman, & Carvallo, 2016). Financing has played an important role in energy efficiency investment in recent years, though researchers stress that “while financing may address the first cost and other barriers, without support from policies and program design structures that address other barriers to energy efficiency uptake, financing alone is not sufficient to drive demand for energy efficiency” (Leventis et al., 2016).
2.2.3 Parallels in transportation
Transport researchers have similarly identified slower uptake of more fuel efficient vehicles than would have otherwise been expected based on projected fuel and cost savings, though the findings, like for the energy efficiency gap, have been mixed (Cassidy, 2016). Like in energy efficiency, some researchers also highlight that the diffusion of EVs is a sociotechnical challenge, in which barriers to consumer adoption are not only technical and economic, but also political, social, and cultural, and that solving technical and economic issues alone is likely to be insufficient to accelerate adoption (Edbue & Long, 2012). A study on the energy efficiency paradox in trucking sought to understand the reason for gradual diffusion of cost effective technologies such as aerodynamic bumpers and tires that reduce rolling resistance. Through focus groups with long haul truckers, researchers identified a range of social, technical, and economic factors affecting decision-making, including uncertainty and imperfect information about fuel saving measures, split incentives between owners and drivers, and concern about driver acceptance of new measures (Klemick, Kopits, Sargent, Wolverton, & Paper, 2014).
Like in early years of energy efficiency and clean energy deployment, passenger electric vehicle adoption rates have thus far been modest, and even in places like California with the most policy supports, adoption rates are lower than necessary to meet electric vehicle deployment goals and midcentury climate goals (Rezvani, Jansson, & Bodin, 2015). For example, California and the other Zero Emission Vehicle mandate (ZEV) states have a 3.3 million EV cumulative sales goal by 2025, for which an estimated 15% market share is needed by that date, compared with today’s 1.2% (Alliance of Automobile Manufacturers,
17
n.d.). Modelers in California suggest that to achieve the state’s 2050 emissions target, between 2.5 and 16 million ZEVs (or about 30-100% new vehicle sales) will be needed by 2030, far higher than the Governor's 1.5M ZEV target for 2025 and 320,000 ZEVs currently on the road in California (Yeh et al., 2016). To achieve such levels of deployment, the UC Davis Institute for Transportation Studies estimate a required $300-$600 billion in subsidies between 2015 and 2035 to cover the incremental costs of zero emission passenger vehicles and charging infrastructure, ranging from $12 billion per year up to $55 billion per year required in 2035 (Ogden, Fulton, & Sperling, 2016).
2.3 Heavy duty vehicle electrification
While electric vehicle technology for heavy duty applications is generally less developed than light duty vehicle technology, a wide range of models are in different stages of development and commercialization. While lower range creates operational limitations currently, consistently improving battery technology means vehicle range will likely continue to improve. With many forecasts projecting continued growth in heavy duty vehicle travel and emissions through 2050, determining approaches to accelerate electric vehicle adoption in the heavy duty sector will be essential.
2.3.1 Heavy duty vehicle emissions impacts
Figure 2-3: U.S. vehicle stock, annual miles traveled, and greenhouse gas emissions in 2015 (Federal Motor Carrier Safety Administration, Bureau of Transportation Statistics, and EIA)
Figure 2-3 highlights that while there are fewer heavy duty than light duty vehicles in operation, their low fuel efficiency and often higher mileage means they have a disproportionately large impact on energy use and emissions, which transportation experts forecast will grow in the coming decades as freight demand and truck travel increases. In 2014, heavy duty trucks and buses in the U.S. accounted nationally for 14% of vehicle miles traveled and 28% of on-road fuel consumed (Bureau of Transportation Statistics, 2017; Federal Highway Administration, n.d.). Nationwide, heavy duty vehicles are estimated to account for 26% of transportation sector NOx and 17% of PM10, with much higher shares in some urban areas (Central Transportation Planning Staff, 2012).
Additionally, heavy duty vehicle sales, mileage, and emissions have been growing, primarily due to a rise in freight demand. Researchers with ICCT estimate the share of emissions from trucks has risen from 18% of U.S. transportation greenhouse gas emissions in 1973 to 26% in 2008 (Eom, Schipper, & Thompson, 2012). Between 1990 and 2013, greenhouse gases from medium and heavy duty trucks increased by 76% (EPA 2013). The International Energy Agency forecasts that globally road freight transport will surpass light-duty on-road passenger transport in energy consumption and emissions by 2050 globally (International Energy Agency, 2017). In the United States, the Energy Information Agency anticipates that freight trucks’ share of on-road transportation sector energy use will rise from 25% today to 31% in 2050 (see Figure 2-4).
0% 10% 20% 30% 40% 50% 60% 70% 80% 90% 100% Number of vehicles
Annual miles Carbon dioxide emissions
18
Figure 2-4: Current and projected energy use by transport mode, 2017-2050 (EIA Reference case)
Highway Transport Sector 2017 Trillion BTU 2050 Trillion BTU % of Total - 2017 % of Total - 2050 Year over year growth, 2015-2050 Light-Duty Vehicles 16,000 12,500 70.3% 62.2% -0.7% Automobiles 6,400 4,600 27.9% 23.0% -1.0% Light Trucks 9,700 7,900 42.3% 39.1% -0.6% Motorcycles 18 13 0.1% 0.1% -1.0% Commercial Light Trucks 900 1,000 4.1% 5.0% 0.4% Buses 270 320 1.2% 1.6% 0.6% Transit 110 115 0.5% 0.6% 0.2% Intercity 32 39 0.1% 0.2% 0.6% School 130 170 0.6% 0.9% 0.9% Freight Trucks 5,600 6,300 24.5% 31.2% 0.4% Medium (10001-26000 pounds) 1,500 2,100 6.6% 10.6% 1.1% Large (> 26000 pounds) 4,100 4,100 17.9% 20.6% 0.1%
HEAVY DUTY VEHICLE FUEL ECONOMY AND EMISSIONS STANDARDS
In addition to the light duty fuel economy standards that were tightened during the Obama administration, the EPA also introduced new standards for heavy duty vehicles in 2011 and again in 2016. For model years 2017-2027, the standards require 12-24% CO2 reduction from diesel vocational vehicles (the
category of transit buses), which policymakers estimate could be met by upgrades to existing models or hybrid vehicles (International Council on Clean Transportation, 2016). While the benefits of this fleet-wide standard are significant, they are not stringent enough to encourage investment in zero tailpipe emission trucks and buses, or to reach needed carbon reduction targets. While California does have the unique authority under the Clean Air Act to set more stringent standards, at this time their heavy duty standards are harmonized with the federal standards.
Figure 2-5: EPA emission standards for heavy-duty engines, 1985-2010 (Hao Cai, Andrew Burnham, Michael Wang, Wen Hang, 2015)
19
In 2007 and 2010, emissions standards for heavy duty engines changed dramatically for particulate matter and NOx, as depicted in Figure 2-5. The EPA under the Clean Air Act sets engine standards for transit buses and other vehicles for pollutants considered harmful to public health and the environment, including carbon monoxide (CO), hydrocarbons (HC), oxides of nitrogen (NOx), and particulate matter (PM) emissions. The 2007 emission standards made necessary the use of exhaust after-treatment technology such as diesel particulate filters (DPFs), as well as cooled exhaust gas recalculating (EGR) technology and Selective Catalytic Reduction (SCR) to reduce NOx (Richard Laver, Donald Schneck, Douglas Skorupski, Stephen Brady, Laura Cham, 2007). Additionally, refineries were required to produce, and retail and wholesale fuel outlets to provide, ultra-low sulfur diesel in 2006.
Collectively these changes mean diesel trucks and buses are now far cleaner than they once were, though do still emit criteria and greenhouse gas pollutants, as well as unregulated ultrafine particles which are increasingly becoming a concern of health researchers (Chen et al., 2016; Heinzerling, Hsu, & Yip, 2016). The tightening standards have meant less of a difference for certain pollutants between diesel and CNG heavy duty vehicles, which emit very similar levels of CO2 from their tailpipes on a per mile basis,
for while natural gas has a lower carbon content than diesel fuel, this improvement is diminished by CNG’s worse fuel economy (MJB&A, 2013).
AIR QUALITY AND HEALTH IMPACTS
Researchers have estimated that transportation is the largest contributor to pollutant-related deaths, causing 53,000 PM2.5-related early deaths and 5,000 ozone-related early deaths per year (Caiazzo, Ashok, Waitz, Yim, & Barrett, 2013). Researchers have also estimated diesel exhaust PM is responsible for approximately 70% of the known potential cancer risk from air toxics exposure in Southern California, of which more than 70% is from heavy duty diesel trucks (Houston, Krudysz, & Winer, 2008). Multiple studies have documented the unequal impacts of vehicle pollution across racial groups and socioeconomic status, particularly from busy roads and freight hubs where heavy duty vehicle pollution is greatest (Chandler, Espino, & O’Dea, 2016). A study of southern California found minority and high-poverty neighborhoods bear over two times the level of traffic density compared to the rest of the region (Houston, Wu, Ong, & Winer, 2004).
While tightened heavy duty vehicle standards are making a substantial impact on regulated pollutants, there is increasing concern about ultrafine particulate matter, which is not an EPA-regulated pollutant, and may have a more significant impact than other pollutants. As researchers hypothesize, “the ultrafine component of particulate matter might be responsible for many of the observed health effects of PM2.5 and PM10” for a number of reasons, including that their smaller size enables deeper penetration into people’s lungs, they can travel more easily into the bloodstream, and they have a greater surface area to mass ratio enabling greater transfer of toxic chemicals (Heinzerling et al., 2016). Researchers have found truck ratio to be the most important predictor of UFP concentrations, and a study of UFP levels in a bus terminal found ten times the level of background particle concentrations (Cheng, Chang, & Hsieh, 2011; Weichenthal, Farrell, Goldberg, Joseph, & Hatzopoulou, 2014).
2.3.2 Heavy duty electric vehicle deployment potential
In addition to transit buses, other urban heavy duty vehicles will likely soon be ripe for electrification, particularly school buses, urban delivery trucks (already being used by FedEx and others), garbage trucks (already deployed in Chicago), and drayage trucks (in demonstration phase in California), all of which have direct pollution impacts on urban populations. Figure 2-6 describes available electric heavy duty vehicles, their state of technology readiness, and the U.S. population of those vehicles.
20
Figure 2-6: Available heavy duty electric truck and bus technology (California Environmental Protection Agency, 2015; CALSTART, 2013; Edelstein, 2016; Nick Nigro, Dan Welch, 2015; Stewart, 2016) Vehicle Est. # in U.S. Technology readiness OEMs Fuel economy (conventional vehicle) (MPDGE) Average annual VMT Approx. annual diesel gallons Transit buses 70,000 Commercially available Proterra, BYD, New Flyer, Gillig, eBus, etc. 4 40,000 700 million School buses 480,000 Limited commercial availability Bluebird Thomas Motiv Lion TransTech Adomani 7 12,000 823 million Urban delivery trucks 120,000 Limited commercial availability EVI, Zenith, Motiv 6.6 13,500 245 million Garbage trucks 150,000 Demonstration phase BYD, Motiv, Wrightspeed 2-3 25,000 1.5 billion Tractor trailors 11,000,000 Demonstration phase TransPower Tesla, BYD, Renault 5.8 66,000 125 billion Drayage trucks 20,000 (CA) Demonstration phase TransPower, Motiv 4 200+ daily miles -
Technology development and policy support has thus far primarily been focused on heavy duty vehicles whose duty cycles are shorter range and return to the same base daily where they could recharge. In addition to being the most feasible for adoption, these types of vehicles also tend to operate in slow-speed, urban environments where they create the greatest pollution exposure for nearby residents. Using the vehicle population data, average fuel economy, and average annual vehicle miles traveled for each vehicle type, the right column of Figure 2-6 presents a very simple assessment of the fuel consumption for each vehicle class to indicate the potential impact of electrification. While there are relatively fewer transit buses than school buses, their worse fuel economy and higher utilization makes their estimated fuel use similar, while garbage trucks have an even greater potential to reduce greenhouse gases and air pollutants due to their very low fuel economy. While transit buses are the only vehicle type that is currently commercially available, researchers are optimistic that ongoing declines in battery costs will make all of the above technologies cost effective in the coming decade, though most believe long distance tractor trailers will be more of a hurdle to develop (California Environmental Protection Agency, 2015).
SCHOOL BUSES
While electric school bus models still have a much greater cost premium than transit buses, their even greater number, as well as diesel school buses’ health impacts on school children and residential areas, suggest that they could be a logical next fleet type to electrify. Research assessing the air quality inside school buses have found within-bus concentrations of particulate matter and air toxics to be 4-12 times higher than ambient pollution levels (Beatty & Shimshack, 2011). With battery costs falling for all vehicle classes, CARB projected in 2015 that “Electric school buses have the potential for significant
21
market penetration in the next 5 to 10 years” (California Environmental Protection Agency, 2015). At the time, CARB estimated that deployment had been slow primarily due to strict safety testing for school buses that takes time, very high incremental costs, as well as the fact that major bus makers like Thomas and Bluebird had not yet entered the market. However, as of 2017 both Thomas and Bluebird introduced and began testing all-electric models, suggesting that with these large manufacturers entering the market, economies of scale and first costs could improve soon (Gray, 2017; Jarmer, 2017).
While school buses are similar in many respects to transit buses, they differ in not getting federal funding for bus purchases, and having far lower utilization rates which hinders operating cost savings. Still, lower utilization could mean a greater potential for providing grid services and earning other revenue streams while parked midday and during the summertime. Vehicle-to-grid services encompass a range of potential revenue streams electric vehicle batteries could earn from providing services to the electric grid, either through selling electricity back to the grid, participating in higher value ancillary services markets, or interrupting or reducing their charging during peak times. A study estimating the vehicle-to-grid potential for electric school buses in Delaware, assuming use in the frequency regulation market, found a positive net present savings after five years of operation for the school district of $38 million if they were to convert their entire fleet (Noel & McCormack, 2014).
2.3.3 Electric transit buses: present status and potential for widespread adoption
While bus travel represents a relatively small share of national transportation emissions, converting bus fleets could provide an important test case for other publicly and privately owned fleets, with multiple manufacturers offering cost competitive models today. Focusing on transit buses also supports urban planning goals that prioritize high occupancy vehicles over single occupancy, and aim to lower air pollution in low-income neighborhoods where lower rates of private car ownership lead to a greater dependence on transit. Policymakers have also focused on electric bus technology because “buses will provide technology transfer to other medium- and heavy-duty vehicle sectors.” (California Governor’s Interagency Working Group on Zero-Emission Vehicles, 2016).RECENT BUS TECHNOLOGY TRENDS
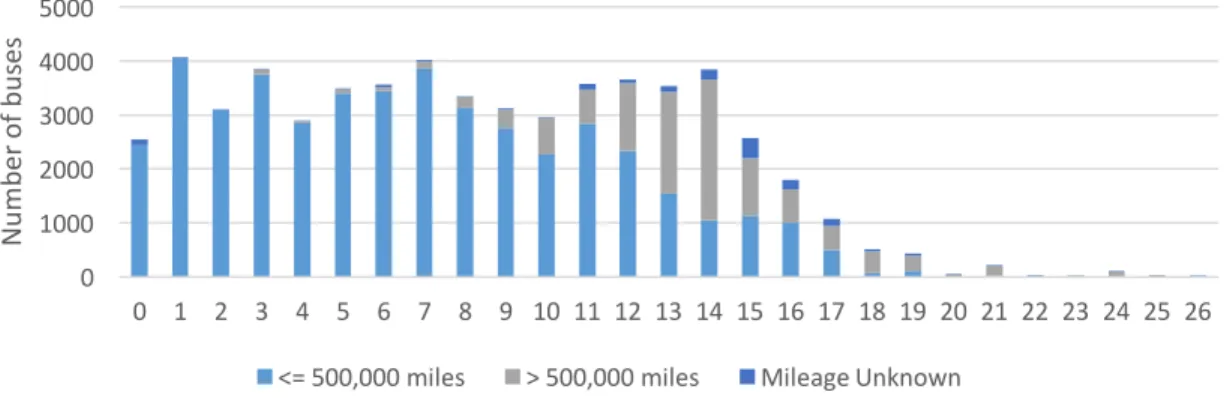
Diesel bus purchases declined from 65% to a low of 39% of new buses purchased in 2014, though saw a resurgence in 2015 with 51% of new buses purchased, according to the Federal Transit Administration’s (FTA) annually published Statistical Summaries (see Figure 2-7). Despite hybrids and CNG vehicles having been available for over 10 years, neither are the dominant new technology purchased. Both graphs below include 30’, 35’, 40’, articulated buses, and commuter buses; amongst only purchases of 40’ buses, diesel, hybrid, and CNG purchases are close to evenly split, with about one third of new purchases each.
22
Figure 2-7: Percent new buses purchased with FTA funds by fuel type, 2009-2015 (FTA Statistical Summaries)
Alternative fuel buses are a growing share of the U.S. transit fleet, though diesel is still a majority of the fleet at 70%, and CNG making up a larger proportion of alternative fueled vehicles compared with hybrids or electric buses (see Figure 2-8). Earlier sociotechnical research highlights the transition of many agencies in the 1990s and early 2000s, often under pressure from traditional environmental and environmental justice groups, to move away from diesel to CNG buses. At the time, some research suggested CNG buses were superior particularly for NOx and PM emissions, though diesel engine retrofit technology evolved quickly in response to new engine standards, and ultimately rendered the research on health and emissions differences between CNG and diesel buses inconclusive. Additionally, most agencies reported higher costs to run CNG buses at the time due to investment in fueling stations, depot retrofits, and higher maintenance costs. Four out of eight major agencies studied returned to diesel after investing in CNG buses, highlighting the risk to transit agencies in being the pioneer into new technologies for the heavy duty sector and potentially ending up with stranded assets (Hess, 2007).
Figure 2-8: Percent fuel type of U.S. bus fleet, 1992-2015 (NTD Revenue Vehicle database)
Examining how the hybrid bus fleet has grown since the technology became commercially viable could offer some insights into how the electric bus fleet might grow. Growth of the hybrid bus fleet appears to have been rapid in the early years of the technology’s commercialization, seeing a 77% compound annual growth rate between 2006 and 2010, but slowing to 18% between 2011 and 2015, and remaining at less than 10% of the national fleet by 2015. While limited data exists thus far and the fleet size is still very small, annual growth of the U.S. electric bus fleet since 2013 has been approximately 59%. Much of this early growth has relied upon federal discretionary grants, such as the Low or No Emission Vehicle grants from the FTA, which provides $55 million per year through 2020 for low or zero emission transit buses.
65% 65% 47% 52% 51% 39% 51% 20% 22% 34% 21% 27% 25% 23% 15% 14% 19% 27% 22% 36% 26% 0% 0% 1% 0% 0% 0% 0% 0% 20% 40% 60% 80% 100% 2009 2010 2011 2012 2013 2014 2015
Diesel Hybrid CNG BEB
0% 20% 40% 60% 80% 100%
23
Figure 2-9: Growth of U.S. battery electric bus fleet, 2013-2017 (NTD, Clermont & Hanlin, 2017)
Market forecasts have estimated a global compound annual growth rate of electric buses of 26.4%, though researchers estimate 75% of electric buses will be deployed in Asia, and that the North America market will shift towards diesel hybrids as the predominant technology deployed by 2020, with battery electric buses capturing a smaller percentage of the market (Mahmoud, Garnett, Ferguson, & Kanaroglou, 2016).
Figure 2-10: North America zero emission bus market sales forecast (Mahmoud et al., 2016)
ELECTRIC BUS LITERATURE
Thus far, electric transit bus research has used a diversity of methods to investigate questions of relative cost and emissions benefits compared with other bus technologies, and has been undertaken by academics, transit agencies, and government agencies alike. The research has reached a diversity of conclusions with respect to total cost of ownership savings, though there seems to be general agreement that electric buses will have far lower environmental impact, and that cost and environmental factors such as the electricity grid will make electric buses increasingly preferable over time.
Multiple academic researchers have assessed the environmental and economic impacts of electric buses compared with other fuel types, using methods like lifecycle cost assessment, total cost of ownership analysis, and sensitivity analysis. In an early study, Cooney found using lifecycle assessment that electric buses were preferable from a greenhouse gas perspective in only eight states, and that while the impacts of battery production environmentally are significant, they remain small in comparison with in-use environmental impacts of buses (Cooney, Hawkins, & Marriott, 2013). As technology has improved and the electricity grid has become cleaner, researchers have estimated that today’s electric buses emit up to 75% less than diesel buses, due in part to being four times as efficient as diesel buses, and in part because idling is the most frequent engine speed in an urban bus route, which consumes significant fuel for diesel buses but no fuel for electric buses (Chandler et al., 2016).
0 100 200 300 400 500 600 700 2013 2014 2015 2016 2017 Nu m be r of b us es