STUDY OF THE WETTABILITY OF COKE BY DIFFERENT PITCHES AND THEIR BLENDS
Ying Lu1, Duygu Kocaefe1*, Yasar Kocaefe1, Dipankar Bhattacharyay1, Xian-Ai Huang1, Patrick Coulombe2
1UQAC/AAI Research Chair on Carbon, University of Quebec at Chicoutimi, 555, Boulevard de l'Université, Chicoutimi, QC, Canada G7H 2B1
2Aluminerie Alouette Inc., 400, Chemin de la Pointe-Noire, C.P. 1650, Sept-Îles, Québec, Canada, G4R 5M9
Ying Lu1, ([email protected])
Duygu Kocaefe1*, ([email protected]), Yasar Kocaefe1, ([email protected])
Xian-Ai Huang1, ([email protected])
Dipankar Bhattacharyay1, ([email protected]) Patrick Coulombe2, ([email protected])
Corresponding author: [email protected] Tel: 418-545-5011 ext 5215
Abstract
The properties of coal tar pitch, which is used as the binder material for carbon anode production, strongly affect the anode properties. Pitches have significant differences in their chemical compositions depending on their origin. In this study, four different coal tar pitches and their blends were studied with the aim of understanding the wettability of a calcined petroleum coke by pitch using the sessile-drop test. In this test, contact angle, which is an indication of wettability, is measured. Contact angles decrease with increasing time, and smaller contact angle means better wettability. The chemical properties of pitches and coke were studied using XPS to investigate their interactions, consequently, the wetting mechanism. The results showed that blending different pitches influences the wettability. The presence of acidic, basic, and hetero- atom containing functional groups in pitch might cause acid-base/condensation reactions when they are blended, thus, influence the wetting behavior of the pitch blend.
Keywords
Wettability, contact angle, pitch, pitch blend, coke 1. Introduction
Carbon anodes for the production of aluminum are manufactured using coal tar pitch as binder and dry aggregates as the filler material. The composition of the anode dry aggregate component varies. A typical composition of the dry aggregate is 65 % petroleum coke, 20%
recycled butts, and 15 % rejected green/baked anodes1. It is important to identify the relation between the properties of the raw materials and carbon anodes. A good understanding of the raw material properties will help produce good quality anodes (improved physical, electrical, mechanical properties, and resistance to air and CO2 reactivities) 1, 2.
The binder pitch covers the surface of the dry aggregates particles, penetrates into the pores, and fills the void spaces between the particles. Good wettability of coke by pitch facilitates these interactions, thus, improves the quality of binding between coke and pitch 3. This, in turn, results in dense anodes and improved final anode properties 1. Pitches may have significant differences in their physical and chemical properties depending on their origin. This, in turn, determines their behavior during baking process and affects the characteristics of the baked anodes 1. As reported previously, both the chemical and physical properties of coke and pitch contribute to the wettability. The presence of complimentary functional groups on the surfaces of coke and pitch is most likely to induce chemical interactions between them, hence, promote wetting 4-6.
The properties, which are used as indicators of pitch quality, are: softening point, coking value, density, C/H ratio, quinoline insolubles (QI), toluene insolubles (TI), viscosity, and impurity content 1. Most properties of pitch are interrelated 1, 7-11 and affect the properties of the anodes 1, 7, 8, 11-16. Among these, coking value, viscosity/softening point, QI and density affect the anode quality most 1. It was published in the literature that a higher softening point is accompanied by an increase in the aromaticity index, density, and coking value 1. Pitch density as well as its QI content and aromaticity contribute to the coking value 1. As the coking value of the QI content is higher than other compounds in the pitch [1, 14], the presence of QI influences the coking value and the density of pitch. It has been shown that baked anode properties can deteriorate at very high and very low levels of QI 1. However, it is difficult to find the pitch which has all the suitable properties to produce good quality anode. It was reported that just over
one third of the plants used more than one pitch supplier 1. The blends obtained by physically mixing different pitches are commonly used in industry in order to get the appropriate pitch properties. More than one supplier is sometimes selected based on the logistic reasons. There are also many plants which have one pitch supplier.
The viscosity of petroleum pitch is affected less by temperature and has lower C/H ratio (lower aromaticity) compared to those of coal tar pitch. The binding pitch used in the production of prebaked anodes is usually coal tar pitch. There is practically no QI in petroleum pitch, and the polyaromatic hydrocarbon (PAH) content of petroleum pitch is approximately one-tenth of that present in coal tar pitch. Petroleum pitch has a lower coking value than that of the coal tar pitch which causes an increase in the emission of volatiles during anode forming and baking with the use of petroleum pitch. The advantages and limitations of using the coal tar pitch and petroleum pitch blend are investigated and discussed by some researchers 17, 18. Researchers have also investigated the dynamic contact angles and the interaction of different cokes with pure coal tar pitch 4, 19. However, there is no study reported on the dynamic wettability of coke by coal tar pitch blends. This study was carried out to fill this void.
2. Methodology 3.1 Materials used
Four coal-tar pitches with different QI contents and similar softening points as well as similar beta resin contents were used as binders in this study. Table 1 summarizes the main properties of these pitches. The pitches were ground to obtain fine particles using a ceramic mortar and pestle.
Grinding was done manually. The blends of different pitches were produced by mixing the fine pitch particles in predetermined percentages, and keeping the mixture in the furnace at 170 °C for 10 min under nitrogen atmosphere. Table 2 shows the pitch blends used for the wetting tests.
A calcined petroleum coke was prepared by sieving the as-received course sample to obtain coke particles of 100-125 μm size6. The wettability of the petroleum coke by these pitches and their blends was investigated and compared.
Table 1: Properties of different coal tar pitches
Pitch type SP QI Beta resin
Pitch-1 118.4 3.4 22.5
Pitch-2 119.6 6.9 22.2
Pitch-3 118.0 10.8 22.2
Pitch-4 119.4 5.1 22.9
SP: Mettler softening point (°C), QI: Quinoline-insoluble (wt %), Beta resin (wt %).
Table 2: Pitch blends used for the wetting tests
Blend No. 1 2 3 4 5 6 7 8 9 10 11 12
Pitch-1 (%) 25 75 - - 75 25 - - 25 75 - -
Pitch-2 (%) 75 25 75 25 75 25 - - - -
Pitch-3 (%) - - 25 75 - - - - 75 25 25 75
Pitch-4 (%) - - - - 25 75 25 75 - - 75 25
3.2 Sessile-drop wettability measurement system
The mixing temperature during anode making can vary significantly in the industry. For a 120 °C softening point pitch, its mixing temperatures can vary approximately from 155 °C to 190 °C. In this study, the wettability of coke by pitch was studied using a sessile drop system at 170 °C, which is the average mixing temperature used in the industry for a pitch softening point of 120 °C. The sessile-drop system consists of a tube furnace purged with an inert gas (nitrogen), a pitch injection system, a graphite sample crucible, a digital video camera, and a vacuum pump.
The coke sample is placed into the graphite sample crucible and compacted to achieve a smooth coke bed surface. The injection chamber holds the solid pitch sample. This chamber, which has a small hole for forming the pitch drop, is placed just above the coke substrate and the position of the hole is adjusted so that the drop can be placed on the center of the coke sample. A video of the drop is captured, and the images are saved. To measure the contact angle, FTA 32 software is used. The details of the sessile-drop set-up were presented elsewhere 4, 6. Each experiment was repeated three times, and the contact angle was taken as the average of these three results.
3.3 XPS analysis
The surface quantitative chemical analysis of coke as well as coal tar pitches was obtained by X-ray photoelectron spectroscopy (XPS). XPS analysis provides information about the distribution and content of different atoms and the nature of the corresponding bonds on the surface based on their binding energies. In this study, the coke and pitch samples of -125 µm particle size were analyzed using an AXIS Ultra XPS spectrometer (Kratos Analytica ) with a mono-chromate Al K[α] (h ν=1486.6 eV) source at a power of 210 W at the Alberta Centre for Surface Engineering and Science (ACSES), University of Alberta. The working pressure in the analysis chamber was less than 2 x10⁻⁸ Pa. The resolution of the instrument for the source in hybrid lens mode was calibrated at 0.55 eV for Ag 3d and 0.70 eV for Au 4f peaks. A charge neutralizer was used to compensate for sample charging. Survey spectra were scanned in the binding energy range of 1100 to 0 eV and collected with an analyzer (pass energy (PE) of 160 eV and a step of 0.35 eV). These spectra were used to measure the atomic concentration of different elements. For the high-resolution spectra (C1s, O1s, and N1s), the PE of 20 eV with a step of 0.1 eV was used. These high resolution spectra were deconvoluted to analyze the components with different functional groups. The peak area was evaluated and scaled to the instrument’s sensitivity factors after a background, based on Shirley algorithm, was subtracted from each peak. XPS results strongly depend on the fit procedure. The peak fitting was done by CasaXPS software at the University of Quebec at Chicoutimi (UQAC) using the non-linear least squares curve-fitting algorithm of Marquardt-Levenberg. The analysis was done based on the procedure described by Sarkar et al.4. The analyzed surface depth of the sample was 2-5 nm. The start and the end of the range of binding energies (Tables 3, 4, and 5) for different components were defined in the software during the curve fit. The main carbon peak was set to 284.3 eV.
Based on that peak, other peaks were adjusted. The full width at half maximum (FWHM) was set in the range of 0.85 to 2.1 eV. The reason for using a broad FWHM was the presence of a number of individual peaks related to different atomic bonding configurations20. There are also possibilities of the shifts and broadening of peaks due to the presence of complex local environment as well as charge transfer ligands. As coke or pitch contains a mixture of complex molecules, it is usual that the peaks will be broadened 4, 21. Thus, a large range of FWHM was used. Based on the range of binding energies and FWHM, the CasaXPS software automatically calculates the percentages of different components. The XPS spectra often contain noises which
may influence the analysis. The limit of detection for each component peak was calculated by the CasaXPS software for each measurement. The raw peak area was also calculated by the CasaXPS software by integrating the peak intensity (in terms of counts) over the width of the peak. The parameters LOD_ESTIMATE and LOD_AREA were included in the region configuration file of CasaXPS software to get the values of the limit of detection (LOD) and the raw peak area (AREAraw), respectively. If the AREAraw is greater than a chosen multiple of the LOD, then a peak can be detected. Assuming Poisson behavior for a peak, the value of the factor is usually chosen as 3 for a 99 % confidence interval. Thus, the high resolution peaks for which the ratio of AREAraw and LOD were greater than 3 were deconvoluted.
Table 3: List of functional groups and their corresponding binding energies for C1s spectrum 22-
26.
Element Binding energy (eV) Range of BE (eV)
Start End
C1s entire signal 284.3 280.5 290.0
Csp2 (C=C) 284.3 280.5 284.6
Csp3 (C-C) 285.1 285.0 286.0
C-N/C-O/C-S 286.0 285.5 287.0
C=O/CSO2 287.1 287.0 288.5
COOH 289.1 289.0 290.0
Table 4: List of functional groups and their corresponding binding energies for O1s spectrum 22-
26.
Element Binding energy (eV) Standard deviation (eV)
Start End
O1s entire signal 533.0 531.0 536.0
C=O 531.6 531.1 532.2
C-O 533.0 532.4 533.6
Adsorbed H2O 534.7 533.6 536.8
Adsorbed O2 535.7 534.9 536.6
C(NH2)COOH 530.9 526.8 531.8
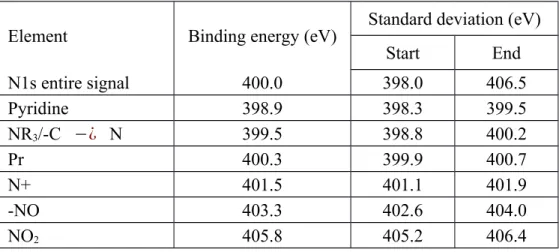
Table 5: List of functional groups and their corresponding binding energies for N1s spectrum 22-
26.
Element Binding energy (eV) Standard deviation (eV)
Start End
N1s entire signal 400.0 398.0 406.5
Pyridine 398.9 398.3 399.5
NR3/-C −¿ N 399.5 398.8 400.2
Pr 400.3 399.9 400.7
N+ 401.5 401.1 401.9
-NO 403.3 402.6 404.0
NO2 405.8 405.2 406.4
3. Results and discussion 3.1 Wettability of coke by different pitches and their blends
Figure 1 shows the results of the wettability study for different pure coal tar pitches and their blends using the same petroleum coke. Wettability of a coke by a pitch is determined by measuring the contact angle as a function of time. Higher the contact angle is, lower the wettability is. It was observed that the contact angles decreased with increasing time, and the pitches and their blends penetrated completely through the coke bed within 300 s. However, the complete penetration time of different pitch samples were different.
If two pitches are mixed, it is expected that the properties of the blend will be between the properties of the pure pitches. The results showed that for Pitch-3/Pitch-4 (Figure 1 (b)), Pitch-3/
Pitch-1 (Figure 1 (c)), Pitch-3/Pitch-2 (Figure 1 (d)), Pitch-2/Pitch-4 (Figure 1 (e)), and Pitch-1/
Pitch-4 (Figure 1 (f)) pairs, the wettability of the blends (contact angles) were between those of the corresponding pure pitches. However, a different trend was observed for Pitch-1 and Pitch-2, and their blends (Figure 1 (a)). For this case, the wettability of the blends was found to be less than those of their parent pitches.
Figure 1: Contact angles of the blends and pure pitches: (a) Pitch-1/Pitch-2; (b) Pitch-3/Pitch-4;
(c) Pitch-3/Pitch-1; (d) Pitch-3/Pitch-2; (e) Pitch-2/Pitch-4; (f) Pitch-1/Pitch-4 (e)
(c) (d) (a) (b)
(f)
The same coke was used and compacted the same way to form the coke bed for all the cases to study the influence of different pitches (pure and blend) on their wettability behavior. Two different blends were studied for each case (Table 2). Except for the blends of Pitch-1 and Pitch- 2, the wettability of coke by all the pitch blends was between those of the corresponding pure pitches (Figures 1 (b) -1 (f)). That is to say that the contact angle vs. time curve of the blends were between curves of the two pure pitches. The contact angle of the blend approached to that of the pure pitch as the percentage of that pitch in the blend was increased (Figure 1 (b) - (f)).
Figure 1 (b) shows that the Pitch-3 wetted the coke less compared to the Pitch-4. Then, the blend with 75% Pitch-3 and 25% Pitch-4 wetted the coke less compared to for the blend containing 25% Pitch-3 and 75% Pitch-4.
The behavior of the blends of Pitch-1 and Pitch-2 was different from the behavior of the blends of all the other pitches. In this case, the blends wetted the coke less than both of the pure pitches, which indicate that the interaction between these pitches took place which reduced the wettability of coke by the blends compared to those by the pure pitches.
In order to understand the behavior of the blends, two pitch pairs namely Pitch-1/Pitch-2 (Figure 1 (a) (wettability of the coke by the blends are less than that by the pure pitches) and Pitch-3/Pitch-4 (Figure 1 (b)) (wettability of the coke by the blends are between that by the pure pitches) were analyzed in detail. The complete penetration time for the blends of Pitch-1 and Pitch-2 in descending order was found as follows: [Pitch-1 (25 %) and Pitch-2 (75 %)] > [Pitch-1 (75 %) and Pitch-2 (25 %)] > [Pitch-2 (100 %)] > [Pitch-1 (100 %)], and the complete penetration time for the blends of Pitch-3 and Pitch-4 in descending order was found as: [Pitch-4 (100 %)] > [Pitch-3 (25 %) and Pitch-4 (75 %)] > [Pitch-3 (75 %) and Pitch-4 (25 %)] > [Pitch-3 (100 %)]. Figures 1 (a) and 1(b) also show that the contact angles measured initially and at earlier times (up to about 40-50 s) are close, which makes the comparison of the wettability of coke by different pitches and pitch blends difficult in this time interval. At later times, the differences can be seen clearly.
Figures 1 (a) and (b) show that the pitches might behave quite differently in blends. Since the same coke was used for all cases, the reason for the difference in pitch behavior, which affected the coke wettability, between the two cases was explored based on the chemical functional groups of pitch and their interaction with those of the coke. Different researchers have used Fourier transform infra-red (FT-IR) spectroscopy to analyze the chemical functional groups in
pitch 4, 5. FT-IR results showed the presence of different functional groups, however, quantitative analysis of these functional groups was difficult with this method. Researchers have used the information obtained from the FT-IR analysis to identify the peaks representing the available functional groups and used this information for carrying out the quantitative analysis with XPS.
After determining the amount of different elements and functional groups on the surfaces of pitches, pitch blends, and coke, the results were correlated with the wettability results.
3.2 XPS analysis
Different authors studied the chemical composition of carbon materials (coke and/or pitch) using XPS 22-26. It was found that coke and/or pitch contain mostly carbon as well as hetero- atoms such as oxygen, nitrogen, and sulfur. The binding energy (BE) values used in this work for C1s, O1s, and N1s peaks are given in Table 3, Table 4, and Table 5, respectively. Presence of different elements in the vicinity of an element may influence the binding energy (BE) of electrons of that element. Therefore, the ranges of BE were chosen based on published works 22-
26. It should be noted that pitch is a combination of different chemical compounds. The BE of electrons may vary due to the presence of neighboring species. Thus, a certain range of BE was used for the deconvolution of the peaks obtained by XPS.
XPS analysis provides information on the distribution of different surface atoms based on their electronic binding energy. High-resolution spectra of XPS give an idea about the nature of bonds and elemental analysis. It can also give quantitative information about different chemical functional groups.
Figure 2 (a) shows an example of the survey spectra obtained using XPS scan for Pitch-2. The most prominent peak at 284.3 eV was designated as C1s, other notable peaks were the O1s peak at 533 eV, and the N1s peak at 400 eV. The relative positions of these peaks were used to determine the chemical nature of these atoms. High resolution scans and peak fit for C1s, O1s, and N1s regions are shown in Figures 2 (b), (c), (d), respectively.
The quantitative information about the different functional groups was obtained based on the deconvolution of C1s, O1s, and N1s binding energies. XPS results show the percentages of different chemical functional groups corresponding to different atoms (C1s, O1s, and N1s).
Figure 2: XPS spectra of Pitch-2 (a) Survey spectra, (b) De-convoluted C1s spectra, (c) De-convoluted O1s spectra, (d) De-convoluted N1s spectra.
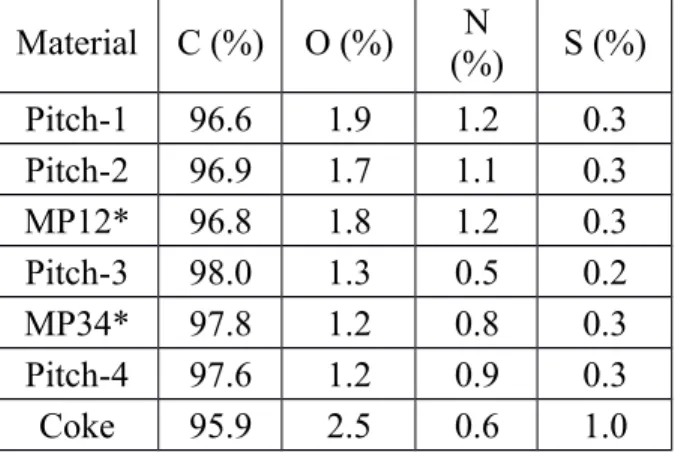
The atomic percentages of different elements in different pitches (pure and blends) are shown in Table 6. In order to study the relationship between chemical properties of the blends and the properties of the pure pitches, one blend of Pitch-1 and Pitch-2 (MP12: 75 % Pitch-1 and 25 % Pitch-2) and one blend of Pitch-3 and Pitch-4 (MP34: 75 % Pitch-4 and 25 % Pitch-3) were
( a )
( b )
( c )
3 22
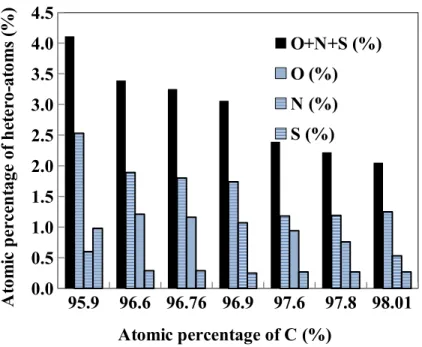
studied using XPS analysis. Table 6 shows that the atomic percentages of carbon in different pure pitch samples in increasing order are: Pitch-1 < Pitch-2 < Pitch-4< Pitch-3. The percentages of different elements of the blends were in between those of the corresponding pure pitches (Pitch-1 < MP-12< Pitch-2, and Pitch-4 < MP-34< Pitch-3). Only in case of MP12, the percentage of S was equal to that of Pitch 1. This can be due to the non-homogeneous distribution of S in the sample. Figure 3 shows that the total percentage of hetero-atoms (O, N and S). The total amount of hetero-atoms and oxygen decreased with increasing carbon percentage while this trend was not observed for nitrogen and sulfur.
Table 6: Atomic percentages of different components in different pitch samples and coke Material C (%) O (%) N
(%) S (%)
Pitch-1 96.6 1.9 1.2 0.3
Pitch-2 96.9 1.7 1.1 0.3
MP12* 96.8 1.8 1.2 0.3
Pitch-3 98.0 1.3 0.5 0.2
MP34* 97.8 1.2 0.8 0.3
Pitch-4 97.6 1.2 0.9 0.3
Coke 95.9 2.5 0.6 1.0
95.9 96.6 96.76 96.9 97.6 97.8 98.01 0.0
0.5 1.0 1.5 2.0 2.5 3.0 3.5 4.0 4.5
O+N+S (%) O (%) N (%) S (%)
Atomic percentage of C (%)
Atomic percentage of hetero-atoms (%)
Figure 3. Change in percentage of different hetero-atoms with carbon percentage present in different pitches
Table 7 shows the AREAraw, LOD, and their ratios for C1s, O1s, and N1s for the pure pitches, their blends, and the coke obtained by analyzing the high resolution spectra. The results showed that N1s for Pitch-3 and coke had a ratio of AREAraw and LOD less than or equal to 3, which suggested the presence of significant amount of noise. Thus, the spectra for these two cases were not deconvoluted. The other spectra were deconvoluted for different functional groups based on the procedure described earlier.
Table 7: The AREAraw, LOD, and their ratios for the different materials
O1s N1s C1s
Sample AREAraw LOD AREAraw
/ LOD AREAraw LOD AREAraw
/ LOD AREAraw LOD AREAraw
/ LOD
Pitch-1 13900 310 45 16141 462 35 150400 100 1498
Pitch-2 3478 161 22 7181 283 25 29957 52 579
Pitch-3 2339 140 17 485 145 3 40401 61 667
Pitch-4 18205 392 46 20204 647 31 237728 129 1841
MP12 16959 352 48 8300 339 24 114990 94 1223
MP34 9534 292 33 3291 245 13 80055 97 823
Coke 30154 329 92 62 31 2 88554 85 1045
The chemical functional groups in different pitches are presented in Table 8, Table 9, and Table 10. The percentage of functional groups obtained from the deconvolution of a particular peak does not represent the amount of that functional group in pitch. To compare the amount of a
particular functional group in different pitches, the percentage of that functional group was multiplied by the atomic percentage of the corresponding element.
Table 8 shows the carbon (C1s) functional groups of different pitches and coke. As the percentages of carbon (C1s) functional groups with elements (O, N, and S) increase, the possibility of the formation of covalent bonds between the functional groups of coke and pitch increases. Pitch-1 and Pitch-2 have higher percentage of hetero-atom containing functional groups compared to those of Pitch-3 and Pitch-4. However, MP12 has lower amount of hetero- atom containing functional groups compared to that for Pitch-1 and Pitch-2. The percentage of hetero-atom containing functional groups for MP34 was within the range of Pitch-3 and Pitch-4.
The decrease of hetero-atom containing functional groups in MP12 might have happened due to reaction of different species in Pitch-1 and Pitch-2. It should be noted that esterification (e.g.
reaction between –COOH and -OH) and condensation reactions (e.g. reaction between –OH and –NH2) can lead to production of small molecules such as water or ammonia which cannot be detected by XPS.
Table 9 shows that Pitch-1 and Pitch-2 have higher amount of COOH functional group compared to that of Pitch-3 and Pitch-4. Pitch-2 has the highest percentage of carboxylic acid group (COOH). Acidic COOH can react with basic functional groups such as amine. Pitch-1 contains highest percentage of C=O and C-O compared to those of the other pitches. Presence of C-O can lead to condensation or esterification reactions.
Table 10 shows that Pitch-1 and Pitch-2 have higher percentages of pyridine (Py), amines (NR3/CN) and pyrroles (PR) compared to those of Pitch-3 and Pitch-4. However, Pitch-1 and Pitch-2 do not contain quaternary ammonium ions (N+) while Pitch-3 and Pitch-4 have them.
Even though pure pitches (Pitch-1 and Pitch-2) do not contain any N+, there is a small amount of N+ in the blend MP12. This is possible if there is a reaction of amine/Py/PR with other molecules. Unlike MP12, MP34 contains N+ and its amount is between the N+ contents of the pure pitches (0 in Pitch-3 and 0.20 in Pitch-4). This indicates that there are reactions taking place between Pitch-1 and Pitch-2. The interaction of N+ with electron-rich centers (such as pi electron cloud of aromatic rings) are electrostatic in nature and the bonds are usually weaker than covalent bonds. They might lead to some interaction, but their quantity is very low. It may be noted that Py and amines are basic in nature, whereas Pr is slightly acidic. Thus, the basic functional groups (Py and amine) can react with the acidic functional groups (PR and COOH)
when the two pitches are mixed. As the levels of acidic and basic functional groups are high in Pitch-1 and Pitch-2 compared to those in Pitch-3 and Pitch-4, MP12 might have lost some active hetero-atom containing functional groups that can bind with coke and decrease the wetting of coke by pitch.
Table 8: Atomic percentages of carbon (C1s) functional groups in different pitch samples and coke
Material C (%)
Functional groups from the
deconvolution of C1s peak (%) Functional groups (%) in pitch
C=C C-C CN/CO/CS/C=O/
CSO2/COOH C=C C-C CN/CO/CS/C=O/
CSO2/COOH
Pitch-1 96.6 81.4 13.0 5.6 78.7 12.6 5.39
Pitch-2 96.9 78.7 16.0 5.4 76.2 15.5 5.21
MP12* 96.8 79.2 15.5 5.4 76.7 15.0 5.18
Pitch-3 98.0 75.0 21.3 3.7 73.5 20.9 3.62
MP34* 97.8 79.5 16.5 4.0 77.8 16.1 3.92
Pitch-4 97.6 81.3 14.4 4.3 79.3 14.1 4.19
Coke 95.9 80.5 12.2 7.3 77.2 11.7 6.95
*MP12: 75 % Pitch-1 and 25 % Pitch-2, MP34: 75 % Pitch-4 and 25 % Pitch-3
Table 9: Atomic percentages of oxygen and oxygen (O1s) functional groups in different pitch samples and coke
Material O (%)
Functional groups from the
deconvolution of O1s peak (%) Functional groups (%) in pitch
C=O C-O C(NH2)COOH C=O C-O C(NH2) COOH
Pitch-1 1.9 44.9 40.4 14.6 0.8 0.8 0.3
Pitch-2 1.7 31.7 37.5 30.8 0.6 0.7 0.5
MP12* 1.8 40.5 41.4 18.1 0.7 0.7 0.3
Pitch-3 1.3 43.5 46.0 10.5 0.5 0.6 0.1
MP34* 1.2 43.5 47.1 9.4 0.5 0.6 0.1
Pitch-4 1.2 42.1 46.3 11.6 0.5 0.5 0.1
Coke 2.5 49.6 40.0 10.4 1.3 1.0 0.3
*MP12: 75 % Pitch-1 and 25 % Pitch-2, MP34: 75 % Pitch-4 and 25 % Pitch-3
Table 10: Atomic percentages of nitrogen and nitrogen (N1s) functional groups in different pitch samples and coke
Material N (%)
Functional groups from the
deconvolution of N1s peak (%) Functional groups (%) in pitch Pyridinic
(Py) NR3/-CN Pyrrolic
(PR) N+ Pyridinic
(Py) NR3/-CN Pyrrolic
(PR) N+
Pitch-1 1.2 28.7 21.4 49.9 - 0.3 0.3 0.6 -
Pitch-2 1.1 31.6 9.5 58.9 - 0.3 0.1 0.6 -
MP12* 1.2 24.0 - 68.9 7.1 0.3 - 0.8 0.1
Pitch-3# 0.5 - - - -
MP34* 0.8 24.6 7.8 52.4 15.2 0.2 0.1 0.4 0.1
Pitch-4 0.9 15.0 5.3 58.7 21.1 0.1 0.0 0.6 0.2
Coke# 0.6 - - - - 0.2 - 0.3 0.1
*MP12: 75 % Pitch-1 and 25 % Pitch-2, MP34: 75 % Pitch-4 and 25 % Pitch-3
#Not deconvoluted
The results are summarized in Figure 4. This figure clearly indicates that there are two major differences between the two pitch pairs (Pitch-1/Pitch-2 and Pitch-3/Pitch-4). First, Pitch- 1/Pitch-2 pair has higher percentage of hetero-atom containing functional groups compared to Pitch-3/Pitch-4 pair. This likely leads to more condensation/esterification reactions between Pitch-1 and Pitch-2 compared to those between Pitch-3 and Pitch-4. Also, Pitch-1 and Pitch-2 both contain acidic and basic functional groups which can cause acid base reaction when Pitch-1 and Pitch-2 are mixed. On the other hand, Pitch-3 and Pitch-4 both contain acidic functional groups (less compared to Pitch-1/Pitch-2). However, Pitch-3 does not contain any basic functional group. This limits the possibility of acid-base reaction between Pitch-3 and Pitch-4.
Thus, blend of Pitch-3 and Pitch-4 could maintain the characteristics of the pure pitches and showed wetting property in the range of the pure pitches.
XPS results are in agreement with the wetting test results. Due to the condensation/acid-base reaction between Pitch-1 and Pitch-2, their blend lost some of the available hetero-atoms capable of binding with coke. This resulted in the reduction of wettability for the blends of Pitch-1 and Pitch-2 compared to those of the parent pitches. As the same coke of a specific granulometry was used and the bed was packed the same way, the differences in the wetting behavior were attributed to the chemical nature of the pitch. XPS was used to identify the surface functional groups of pitches which influence the chemical interactions. The XPS studies could explain the differences in the wettability behavior of the different pitches.
Figure 4: Percentage of hetero-atoms, carboxylic acid, and amine in different pitches used 4. Conclusions
The wettability and XPS results showed that the chemical properties of pitches contribute to the wettability of coke by pitch. The presence of hetero-atom containing functional groups, acidic (COOH and pyrrole) and basic (amine, pyridine) groups might cause condensation/acid- base reaction in pitch blends making them less wetting compared to the pure pitches that they are made of. This can lead to a completely different behavior of pitch blends compared to those of the pitches used to prepare the blends for anode production. Blending pitch is a common industrial practice, however; it has to be kept in mind that it can affect the anode quality depending on the properties of the pure pitches.
5. Acknowledgements
The technical and financial support of Aluminerie Alouette Inc. (AAI) as well as the financial support of the Natural Sciences and Engineering Research Council of Canada (NSERC), Développement économique Sept-Îles, the University of Québec at Chicoutimi (UQAC), and the Foundation of the University of Québec at Chicoutimi (FUQAC) are greatly appreciated.
6. References 3
1. Hulse, K. L., Anode manufacture : raw materials, formulation and processing parameters. R
& D Carbon Ltd.: Sierre [Suisse], 2000; p xxxv, 416 p.
2. Hume, S. M., Anode reactivity : influence of raw material properties. [2nd ed.]. ed.; R & D Carbon Ltd.: Sierre [Suisse], 1999; p xi, 433 p.
3. Couderc, P.; Hyvernat, P.; Lemarchand, J. L., Correlations between ability of pitch to penetrate coke and the physical characteristics of prebaked anodes for the aluminium industry. Fuel 1986, 65, (2), 281-287.
4. Sarkar, A.; Kocaefe, D.; Kocaefe, Y.; Sarkar, D.; Bhattacharyay, D.; Morais, B.; Chabot, J., Coke-pitch interactions during anode preparation. Fuel 2014, 117, (PART A), 598-607.
5. Sarkar, A.; Kocaefe, D.; Kocaefe, Y.; Bhattacharyay, D.; Morais, B.; Pouliot, M. In Characterization of petroleum coke and butts used in anode manufacturing in aluminum industry, Materials Science and Technology Conference and Exhibition 2013, MS and T 2013, Montreal, QC, 2014; Montreal, QC, 2014; pp 2710-2720.
6. Lu.Y, K. D., Kocaefe.Y, Bhattacharyay.D, Huang.X, Morais.B, Study of the wetting of coke by different pitches. In TMS (The Minerals, Metals & Materials Society) Annual Meeting and Exhibition, Williams, E., Ed. Light Metals: Nashville, TN, 2016; pp 871-876.
7. Perruchoud, R. C.; Meier, M. W.; Fischer, W., Worldwide pitch quality for prebaked anodes.
In TMS (The Minerals, Metals & Materials Society) Annual Meeting and Exhibition, Crepeau, P. N., Ed. Light Metals: San Diego, California, 2003; pp 509-518.
8. Stadelhofer, J. W.; Gemmeke, W.; Zander, M., Characterization of binder pitches (iii). In AIME Annual Meeting, Light Metals: Atlanta, Ga, USA, 1983; pp 1211-1221.
9. Mason, B. J.; Najjar, P. M., Laboratory assessment of binder pitch performance. In TMS (The Minerals, Metals & Materials Society) Annual Meeting and Exhibition, Rooy, E., Ed. Light Metals 1991: New Orleans, LA, USA, 1991; pp 585-590.
10. H.Marsh, Introduction to Carbon Science. Butterworth-Heinemann: 1989; p vii.
11. Alscher, A.; Wildfoerster, R.; Sharp, J. A., Performance of binder pitches with decreased QI- content in anode making formation - nature - properties and substitution of quinoline insolubles. In TMS (The Minerals, Metals & Materials Society) Annual Meeting and Exhibition, Bickert, C. M., Ed. Light Metals: San Diego, California. USA, 1990; pp 232-236.
12. Branscomb, J. A.; Dr.V.L.Bullough; H.A.Morrissey, The relationship of pitch properties to anode properties. In https://web.anl.gov/PCS/acsfuel/preprint%20archive/Files/04_3_NEW
%20YORK_09-60_0115.pdf: https://web.anl.gov/PCS/acsfuel/preprint
%20archive/Files/04_3_NEW%20YORK_09-60_0115.pdf, 1966; pp 115-123.
13. Sakai, M.; Wang, Y.; Fukuoka, T.; Hatano, H., Importance of primary quinoline insoluble in binder pitch for anode. In TMS (The Minerals, Metals & Materials Society) Annual Meeting and Exhibition, Suarez, C. E., Ed. Light Metals: Orlando, FL, 2012; pp 1223-1228.
14. Alscher, A.; Gemmeke, W.; Alsmeier, F.; Boenigk, W. In Evaluation of electrode binder pitches for the production of prebaked anodes using a bench scale process, AIME Annual Meeting, Warrendale, PA, USA. Denver, CO, USA, 1987; Light Metals: Warrendale, PA, USA. Denver, CO, USA, 1987; pp 483-490.
15. Belitskus, D.; Hill, W., Properties of bench scale anodes produced using binder pitches varying in primary and secondary QI contents. In TMS (The Minerals, Metals & Materials Society) Annual Meeting and Exhibition, Bickert, C. M., Ed. Light Metals: Anaheim, CA, USA, 1990; pp 577-581.
16. Golubic, T. A.; McKinney, S. A.; Wombles, R. H., High softening point coal tar pitch as anode binder pitch. In TMS (The Minerals, Metals & Materials Society) Annual Meeting and Exhibition, Johnson, J. A., Ed. Light Metals: Seattle, WA, 2010; pp 909-911.
17. Pérez, M.; Granda, M.; García, R.; Menéndez, R.; Romero, E. In Preparation of binder pitches by blending coal-tar and petroleum pitches, Light Metals 2001, New Orleans, LA, 2001; Anjier, J., Ed. New Orleans, LA, 2001; pp 573-579.
18. Cutshall, E.; Maillet, L. In Vertical stud Soderberg emissions using a petroleum pitch blend, 135th TMS Annual Meeting, San Antonio, TX, 2006; San Antonio, TX, 2006; pp 547-552.
19. Huang, X.; Kocaefe, D.; Kocaefe, Y.; Bhattacharyay, D., Wettability of bio-coke by coal tar pitch for its use in carbon anodes. Colloids and Surfaces A: Physicochemical and Engineering Aspects 2016, 490, 133-144.
20. Masao Matsuoka, S. I., Ronaldo D. Mansano, Wilmer Sucasaire, Ricardo A. C. Pinto, Juan C. R. Mittani, Kiyoshi Ogata, Naoto Kuratani X-Ray Photoelectron Spectroscopy and Raman Spectroscopy Studies on Thin Carbon Nitride Films Deposited by Reactive RF Magnetron Sputtering. World Journal of Nano Science and Engineering 2012, 2(02), 92-102.
21. Huang, X.; Kocaefe, D.; Kocaefe, Y.; Bhattacharyay, D., Interaction of bio-coke with different coal tar pitches. Fuel 2016, 179, 179-192.
22. Buckley, A. N., Nitrogen functionality in coals and coal-tar pitch determined by X-ray photoelectron spectroscopy. Fuel Processing Technology 1994, 38, (3), 165-179.
23. Jiménez Mateos, J. M.; Fierro, J. L. G., X-ray photoelectron spectroscopic study of petroleum fuel cokes. Surface and Interface Analysis 1996, 24, (4), 223-236.
24. Estrade-Szwarckopf, H., XPS photoemission in carbonaceous materials: A “defect” peak beside the graphitic asymmetric peak. Carbon 2004, 42, (8–9), 1713-1721.
25. Blyth, R. I. R.; Buqa, H.; Netzer, F. P.; Ramsey, M. G.; Besenhard, J. O.; Golob, P.; Winter, M., XPS studies of graphite electrode materials for lithium ion batteries. Applied Surface Science 2000, 167, (1–2), 99-106.
26. Tran, K. N.; Berkovich, A. J.; Tomsett, A.; Bhatia, S. K., Influence of sulfur and metal microconstituents on the reactivity of carbon anodes. Energy and Fuels 2009, 23, (4), 1909- 1924.