Economic Decision Making
THESIS
presented to the Faculty of Economics and Social Sciences at the University of Fribourg, Switzerland,
in fulfillment of the requirements for the degree of Doctor of Economics and Social Sciences
by
Svitlana Tyahlo
from UkraineAccepted by the Faculty of Economics and Social Sciences on 21 September 2020 at the proposal of
Prof. Dr. Reiner Eichenberger (first advisor) Prof. Dr. Holger Herz (second advisor)
Summary 1
1 How war affects political attitudes: Evidence from eastern Ukraine 3
1.1 Introduction . . . 3
1.2 Background of the conflict in Donbas . . . 7
1.3 Data and treatment definition . . . 9
1.4 Econometric methods and identification . . . 14
1.5 Main results . . . 20
1.6 Robustness checks . . . 23
1.7 Conclusion . . . 28
1.A Additional figures and tables . . . 30
2 Education, fertility and labor force attachment: A mediation analysis of older women 40 2.1 Introduction . . . 40
2.2 Literature . . . 42
2.2.1 Education and labor market outcomes . . . 42
2.2.2 Education and fertility . . . 43
2.2.3 Fertility and female labor supply . . . 44
2.2.4 Our contribution . . . 45 2.3 Data . . . 45 2.4 Methodology . . . 49 2.5 Results . . . 51 2.5.1 Selective mortality . . . 53 2.5.2 Heterogeneous effects . . . 55
2.5.3 Endogenous schooling and fertility . . . 57
2.6 Conclusion . . . 58
2.A Additional tables . . . 60
3 Linguistics and time preferences: The role of language in shaping intertemporal choices 69 3.1 Introduction . . . 69
3.3 Theory, hypotheses and data . . . 74
3.3.1 Time discounting and language . . . 74
3.3.2 Preference measures . . . 76
3.3.3 Procedures . . . 78
3.4 Results . . . 79
3.4.1 Descriptive statistics . . . 79
3.4.2 Analysis of switch points . . . 81
3.4.3 Analysis of individual preference parameters . . . 84
3.4.4 Robustness checks . . . 87
3.5 Conclusion . . . 90
3.A Additional figures and tables . . . 93
4 Intertemporal choice under social comparison: A real-effort experiment 99 4.1 Introduction . . . 99
4.2 Work environment . . . 103
4.3 Experiment . . . 104
4.3.1 Intertemporal choice task . . . 104
4.3.2 Treatments . . . 106
4.3.3 Procedures and data . . . 107
4.4 Conceptual framework . . . 108
4.4.1 Behavioral predictions . . . 108
4.4.2 Behavioral measures . . . 111
4.5 Results . . . 112
4.5.1 Within-group analysis . . . 112
4.5.2 Analysis of treatment effects . . . 115
4.5.3 Robustness checks . . . 119
4.6 Discussion . . . 122
4.6.1 Treatment effects . . . 122
4.6.2 Time in/consistency . . . 124
This dissertation consists of four independent papers on economically relevant topics that cap-tured my attention because of personal background and professional experiences, such as coming from Ukraine, being an educated woman, living in a bilingual Swiss region and observing people delaying their work. Throughout my papers, I empirically analyze the determinants of individual attitudes and behavior that entail important economic consequences. In particular, the first two papers are observational studies related to political economy and labor market policy, respectively, while the last two papers involve incentivized intertemporal choice experiments. Analytical meth-ods are carefully chosen to address specific research questions given the quantity and quality of data. Since the primary goal is to establish causal relationships, the results and thus the identi-fying assumptions are challenged with transparent robustness checks and critical discussions. The papers are organized in chapters as following.
Chapter 1 evaluates the impact of the ongoing war in eastern Ukraine on the political attitudes towards Ukraine and Russia among the population in the war-affected area controlled by the Ukrainian government. This topic is important because political sentiments can shape political powers, voting outcomes and thus prospective institutions, which will govern approaches to conflict resolution and post-war economic recovery in the region. The war geography allows defining two groups of citizens with different war exposure. Based on unique survey data from 2013 (prior to the war) and 2015 (after the outbreak of the war), a before-after analysis and a difference-in-difference approach are applied to examine the effect of war exposure. The results indicate that one year of conflict negatively affected attitudes towards Russia, while no statistically robust differences are found for sentiments towards Ukraine. These findings are in line with the outcome of the 2014 Ukrainian parliamentary elections, when the pro-Russian vote substantially dropped in eastern Ukraine compared to the previous elections.
In Chapter 2, I investigate long-run effects of education on female labor market attachment mediated by realized fertility. In the context of population ageing, educated women are an im-portant resource of labor supply. Investments into female education, however, raise opportunity costs of motherhood in terms of forgone earnings, leading to a trade-off between labor force par-ticipation and fertility decisions. It is therefore important to understand whether education in-creases female working lives mainly through reduced fertility. Using mediation analysis supported by the rich data from the Survey of Health, Ageing and Retirement in Europe, I find that school-ing is positively associated with employment status, workschool-ing hours and labor survival age of older women. Education-induced fertility modestly contributes to the total schooling effects, which is stimulating news for policy makers.
Chapter 3 sheds light on the relationship between language and time preferences. While re-cent evidence suggests that the grammatical association of the present and the future in a lan-guage positively correlates with patience across lanlan-guage groups, the underlying mechanisms re-main unclear. Our study compares time preferences of two language groups that differ in their encoding of time. More precisely, we conduct incentivized choice experiments among French and German speakers in a bilingual region in Switzerland, with shared institutions and very similar socioeconomic conditions between the two language groups. We find that German speakers are significantly more patient than French speakers, and differences are particularly pronounced when immediate payments are involved. The estimated preference parameters of a quasi-hyperbolic dis-counting model suggest that German speakers display lower disdis-counting and are significantly less prone to present bias than French speakers.
Chapter 4 also examines intertemporal choice behavior. The context however differs. In a ran-domized real-effort experiment with Amazon Mechanical Turk workers, I study the impact of so-cial comparison on intertemporal choice. Soso-cial comparison entails varying information about ef-fort reallocations of previous participants who completed a similar task. I find that social compar-ison affects effort allocations of men and women differentially. Observing that 48% of past partici-pants behaved time-consistently, men are significantly more likely to make dynamically consistent choices, while women are significantly less likely to do so. On average, men also exhibit signif-icantly smaller estimates of the present-bias parameter of a quasi-hyperbolic discounting model. I further find that observing peer procrastination significantly increases the propensity of women to behave time-consistently but does not affect men. These findings suggest that gender-specific social comparison based on situational similarity can be an effective solution to dynamic inconsis-tency in effort even when individual time preferences are not known beforehand.
eastern Ukraine
1Overview
This study empirically evaluates the impact of the ongoing war in eastern Ukraine on the political attitudes towards Ukraine and Russia among the population living close to the war zone on the territory controlled by the Ukrainian government. Exploiting unique survey data from 2013 (prior to the war) and 2015, we employ a before-after analysis and a difference-in-differences approach to infer how the war has affected two different groups defined by exposure to the war zone. We consider both linear and semiparametric estimation based on inverse probability weighting. Our results suggest that one year of conflict negatively affected attitudes towards Russia, while no statistically robust differences were found for sentiments towards Ukraine.
1.1
Introduction
How does a military conflict affect the political capital of neighboring countries with historical connections among the war-exposed population? We address this question empirically by evaluat-ing the impact of the ongoevaluat-ing military conflict in eastern Ukraine on the political attitudes held by the population in the war-affected area towards Ukraine and Russia.
The pro-Russian unrest in the east of Ukraine, which started shortly after the “Euromaidan” movement and Russia’s annexation of Crimea, escalated to a violent war in April 2014, where pro-Ukrainian and pro-Russian views clashed. Given its geopolitical context and its implications for lasting stability and security in Europe, this military conflict echoed far beyond in multilateral
political and economic relations.2 Exploiting unique survey data from a repeated cross section, we
investigate how preferences about the political status of Ukraine and sentiments towards Ukraine and Russia evolved among individuals living close to the war zone on the Ukrainian-controlled
1This chapter is co-authored with Martin Huber. The earlier version of this paper is available as SES Working
Paper No 472 (2016). The collection of the data used in this study was funded by the Grant CR11I1L 135348 “Region, Nation and Beyond. A Transcultural and Interdisciplinary Reconceptualization of Ukraine” of the Swiss National Science Foundation (2013–2015) and the Wolodymyr George Danyliw Foundation (2015).
2In response to Russia’s supposed role in the conflict in Ukraine, the European Union (EU) and other countries
(e.g. the United States, Canada, Norway, Switzerland, Japan, and Australia) introduced a range of diplomatic and economic sanctions against a list of individuals and companies from Russia and Ukraine. Resorting to countermea-sures, Russia banned food imports from a number of countries. Christen et al. (2015) assess the potential economic consequences of export sanctions between the EU plus Switzerland and Russia.
territory between early 2013, i.e. 13 months before the war, and 2015, i.e. 11 months after the outbreak of the war. Our analysis therefore focuses on the eastern part of Ukraine as far as controlled by government forces, namely Donetsk, Luhansk, Kharkiv, Dnipropetrovsk, and Zaporizhia oblasts (administrative units), which before the war used to share strong cultural and socioeconomic ties. Specifically, these regions represent the most extensively Russian-speaking part of Ukraine that had the longest common history with Russia (see Barrington and Herron, 2004).
We use this setting to answer two key questions: How does exposure to a military conflict affect the opposing — pro-Ukrainian vs. pro-Russian — political views? Does the degree of exposure to the conflict matter? These are important questions to address because political sentiments can shape political powers, voting outcomes and thus prospective institutions, which will govern approaches to conflict resolution and post-war economic recovery in the region. Hence, this paper
sheds light on the political costs of the ongoing war to the involved parties.3 As to the first
question, the effect of war on political attitudes is not a priori obvious but depends on people’s perceptions of who is an aggressor and who is a defender, which is context specific. For the second question, we anticipate a stronger effect in the population with higher exposure to war because of greater inconveniences these people experience.
To infer the causal effect of the conflict, our empirical strategy relies on variability in exposure to war across the country. In fact, the violent fighting only took place in certain parts of Donetsk and Luhansk oblasts, the so-called Donbas region. However, due to the conflict, the access to important services provided in the cities of Donetsk and Luhansk — the administrative centers that fell under the control of pro-Russian forces — got disrupted, affecting all people in Donbas. Furthermore, the entire country was affected by the conflict, for instance, through the economic and social consequences, the recruitment of troops, the discussions in politics, the media, and the civil society. This allows splitting the sample into two treatment groups: individuals in Donetsk and Luhansk oblasts (the Donbas region) represent the high exposure group, while individuals in other eastern oblasts belong to the low exposure group.
We employ two econometric approaches. First, we apply a before-after analysis to examine intra-group changes in attitudes over time. This only yields unbiased effect estimates if time trends
latter is based on inverse probability weighting by the propensity score to belong to the high exposure group.
Our findings suggest that the political attitudes towards Russia have deteriorated as a con-sequence of the war. In either group, the before-after differences in supporting a union or one state with Russia are substantially negative and highly significant in the majority of our speci-fications. Furthermore, for the view that the Ukrainian and Russian cultures are the same, the DiD approach yields a sizable and significant negative effect in the main specification, which is mostly driven by before-after differences in Donbas. The estimated effects are relatively robust to the choice of control variables and the definition of the treatment groups. In contrast, no statis-tically robust effects on attitudes and sentiments towards Ukraine and Ukrainians, i.e. sympathy for Ukraine and self-association with other Ukrainians, are found.
This study relates to the growing literature investigating the political impacts of exposure to war and violence. For instance, Bellows and Miguel (2009), Blattman (2009), and Voors et al. (2012) find that individuals who personally experienced wartime violence and trauma during civil wars in Africa increase their political and civic engagements and community leadership. Also Bateson (2012) provides cross-country evidence that individuals who report recent crime victimization are more politically active than their non-victimized peers. Applying a regression discontinuity-type design, Garcia-Ponce and Pasquale (2015) document that individuals indirectly exposed to political repression in Zimbabwe self-report higher levels of trust into the state and its institutions. Erikson and Stoker (2011) examine how the 1969 Vietnam draft lottery influenced political attitudes of males in the United States. Men with vulnerable draft numbers are found to be more antiwar and liberal in their voting behavior than those with safe draft numbers. Employing a DiD and synthetic control approach, Montalvo (2011) shows that the terrorist attacks in Madrid shifted voters’ choices in the 2004 congressional election. Though Balcells and Torrats-Espinosa (2018) confirm that terrorist attacks in Spain enhance individuals’ intent to participate in a future election, they find no evidence that the attacks change support for the incumbent party.
More closely related to our paper, Rohner et al. (2013), who employ an instrumental variable method to study the effect of the civil conflict in Uganda, find that intense violence strengthens within-ethnic group ties but significantly weakens trust towards other Ugandans. Using endorsement experiments, Lyall et al. (2013) document the asymmetric effects of wartime violence on attitudes towards out-group vs. in-group combatants in Afghanistan: while violence by the out-group leads to reduced support for that group and increased support for the in-group,
in-group violence does not lead to a transfer of support to the out-group. As one potential
mechanism of war, DellaVigna et al. (2014) investigate how exposure to nationalistic cross-border Serbian public radio affects the voting behavior and anti-Serbian sentiment in the post-conflict region of Croatia at the border with Serbia.
In the case of Ukraine, Rozenas et al. (2017) analyze long-term political effects of Soviet state violence in western Ukraine. Using an instrumental variable approach and a fuzzy regression
discontinuity design, they find that communities subjected to a greater intensity of deportation in the 1940s are now less likely to vote for pro-Russian parties. Most relevant for our work is the study
by Coup´e and Obrizan (2016b), which investigates the effects of violence on political outcomes in
two cities of the Donetsk region that were temporarily controlled by the pro-Russian militants. Relying on cross sectional survey data, their results suggest that physical damage is negatively associated with the turnout probability and the likelihood to know local political representatives. Property damage, on the other hand, increases self-reported votes for pro-Western parties and reduces support for Donbas remaining a part of Ukraine or for any compromise with the pro-Russian forces.4
In contrast to the majority of studies that focus on post-violence outcomes, our analysis — like
the one by Coup´e and Obrizan (2016b) — concerns a point in time when the war was still ongoing.
However, our study differs from that of Coup´e and Obrizan (2016b) in three dimensions. First,
the outcome variables considered mostly differ: while the present work has a stronger focus on
political attitudes towards Ukraine and Russia, Coup´e and Obrizan (2016b) predominantly (but
not exclusively) examine election behavior. We believe that political attitudes — though they may not entirely be covered by available political choices — positively correlate with individual
voting behavior, which in turn shapes the resulting institutions. Second, Coup´e and Obrizan
(2016b) rely on observations within an area of intense fighting, while we exploit variation across
areas with higher and lower exposure to war. Third, while Coup´e and Obrizan (2016b) use a
single cross section, our repeated cross section allows observing the outcome variables already prior to the conflict and applying a DiD approach in order to tackle confounding related to time-constant unobservables. In addition to an OLS-based implementation, we base DiD estimation on a semiparametric weighting approach, which is more flexible in terms of functional form assumptions than the estimators conventionally used in the empirical literature.
Our findings confirm our hypotheses and the general result from previous studies that exposure to war and violence has consequences with respect to political attitudes, albeit the context differs from much of the literature. Specifically, our estimates suggest that the attitude towards Russia has deteriorated as a consequence of the war, which is probably driven by Russia’s perceived role as a major proponent of the separatist objectives through its politics, media, and
as some might have speculated in the light of the close linguistic and cultural ties with Russia. Quite the contrary, Russia appears to have lost political capital in the most Russian-speaking part of Ukraine, while no statistically significant negative effects on attitudes and sentiments
towards Ukraine were found. These results are somewhat in line with the finding of Coup´e and
Obrizan (2016b) that the experience of property damage decreases the support for the view
that the Ukrainian government should compromise with Russia. Our data also confirm the
outcome of the 2014 Ukrainian parliamentary elections, when the vote share for the pro-Russian parties substantially dropped in eastern Ukraine, particularly in the unoccupied area of Donbas, compared to the previous elections in 2012.
The remainder of this paper is organized as follows. Section 1.2 describes the conflict back-ground. Section 1.3 presents the data and the treatment groups. Section 1.4 outlines our econo-metric approaches based on paraecono-metric and semiparaecono-metric before-after and DiD estimation and discusses identification issues, such as migration patterns in the region. Sections 1.5 and 1.6 report the main results and robustness checks, respectively. Section 1.7 concludes.
1.2
Background of the conflict in Donbas
Since independence, the territory of Ukraine had been free from military confrontations until the
pro-Russian unrest in Donbas (Donetsk and Luhansk oblasts)6 escalated to the status of war in
April 2014 following a series of relevant events. The underlying context is important to understand the impact of the conflict on political sentiments analyzed in this paper.
The signing of the EU-Ukraine Association Agreement, a core element of which was closer economic integration through the Deep and Comprehensive Free Trade Area (DCFTA) between
the EU and Ukraine, was intended for late November 2013.7 In response, Russia — dissatisfied
with the potential agreement — imposed import restrictions on certain Ukrainian products and warned of tighter sanctions if the agreement got signed. In September 2013, the chief economic adviser of the Russian president explicitly voiced the possibility of separatist movements in the Russian-speaking regions of Ukraine and suggested that Russia would consider the bilateral treaty
defining the countries’ border to be void.8
Reportedly concerned about the industrial production decline and relations with the members
6
The territory of Donbas is historically associated with the Ukrainian Cossacks, the so-called Zaporizka Sich (16th–18th centuries). The region was controlled by the Russian Empire from the late 18th century and then by the Soviet Union. Despite a large immigration of Russians into Donbas after World War II, ethnic Ukrainians were still in the majority. There is, however, no agreement between the Ukrainian and Russian versions of the Donbas history (see Wilson, 1995).
7
The Guide to the EU-Ukraine Association Agreement is available at eeas.europa.eu/images/top stories/ 140912 eu-ukraine-associatin-agreement-quick guide.pdf, retrieved 23 April 2016.
8
See www.theguardian.com/world/2013/sep/22/ukraine-european-union-trade-russia, retrieved 4 Novem-ber 2018.
of the Commonwealth of Independent States (CIS), the Ukrainian government decided to
temporarily suspend the preparation for signing the Association Agreement with the EU.9
Consequently, the “Euromaidan” movement — a wave of public demonstrations — spread from
Kyiv to major cities of Ukraine. The initial demand for closer European integration quickly
expanded to requests for political change in the country. The culmination came in February 2014, when violent fights with fatalities in the center of Kyiv led to the ouster of the then president who fled the country. The Ukrainian interim government signed the political provisions of the Association Agreement with the EU in late March 2014, and the newly elected president signed the economic part in June 2014.
Mid-March 2014, the “referendum” on the status of Crimea — with no option to vote for the
status quo10 — took place,11 after the peninsula had already been penetrated by armed forces
without insignia most likely belonging to the Russian army.12 The “referendum” led to Russia’s
annexation of Crimea. Consequently, the Ukrainian government de facto lost control over the peninsula.
In April 2014, the unrest moved to Donbas, where pro-Russian forces occupied governmental buildings in Donetsk and Luhansk and self-declared the “Donetsk People’s Republic” followed
by the “Luhansk People’s Republic”.13 Ukraine’s interim president in turn launched an
“anti-terrorist operation” against the pro-Russian fighters. Despite attempts to de-escalate the
conflict in Donbas,14 “referendums” took place on the occupied territories to legitimize the
self-declared Donetsk and Luhansk People’s Republics.15 Avoiding formal diplomatic recognition,
Russia expressed its respect for the outcomes of the “referendums” and its hope for the “civilized
implementation” thereof.16 Consequently, neither annexed Crimea nor the occupied areas of
Donbas participated in the subsequent Ukrainian presidential or parliamentary elections in 2014. Since the beginning of the war in Donbas, several waves of army mobilization followed across the territories governed by the Ukrainian authorities. In addition, the military tax was introduced
9See en.interfax.com.ua/news/general/176144.html, retrieved 23 April 2016. 10
See www.nytimes.com/2014/03/15/world/europe/crimea-vote-does-not-offer-choice-of-status-quo. html? r=0, retrieved 23 April 2016.
11The Organization for Security and Co-operation in Europe (OSCE) considered the Crimean “referendum” illegal.
The OSCE press release is available at www.osce.org/cio/116313, retrieved 23 April 2016.
in August 2014. Furthermore, the Russian state-controlled media — a source of anti-Ukrainian narratives — were banned in the government-held part of Ukraine. Hence, the entire country was affected by the war in Donbas.
As the ceasefire agreement of 5 September 201417 had failed to resolve the conflict in Donbas,
the intense consultations of the trilateral contact group — consisting of Ukraine, Russia and the
Organization for Security and Co-operation in Europe (OSCE) — continued.18 In January 2015,
Ukraine declared Russia an aggressor state supporting terrorism.19 In March 2015, the Ukrainian
parliament approved a law on the “special status” of certain parts of Donbas with the aim of
holding local elections there.20 After months of violations, Ukraine and the pro-Russian fighters
ultimately decided to respect the ceasefire from 1 September 2015 on. That entailed a considerable
reduction in fighting, yet clashes and casualties continued and lasting peace was still out of reach.21
The conflict in Donbas and the preceding events challenged the status quo of Ukraine as an independent and neutral state. Though Ukraine’s relationship with Russia had always been a sensitive topic, the decision to join the DCFA with the EU rather than the Customs Union with Russia led to the loss of Ukraine’s control over part of its territory and population with substantial
economic and human consequences.22 The split of the country and the annexation of Crimea by
Russia became a reality.
1.3
Data and treatment definition
Our data come from a representative population survey in Ukraine conducted in February-March 2013 by the sociological institute “Rating” and repeated in March-April 2015 by the company
“Socioinform” on behalf of an interdisciplinary research project on regionalism in Ukraine.23 The
sample consists of a repeated cross section with 6000 individual observations per survey year.24
The first wave includes all 24 oblasts (administrative units) plus the Autonomous Republic of Crimea and the city of Sevastopol, while the second wave only covers the territory controlled by
17
The document is available in Russian at www.osce.org/home/123257, retrieved 23 April 2016.
18
The Minsk II protocol of 12 February 2015 is available in Russian at www.osce.org/cio/140156, retrieved 23 April 2016.
19
See www.unian.info/politics/1036816-ukrainian-parliament-declares-russia-aggressor-state.html, retrieved 23 April 2016.
20See www.reuters.com/article/us-ukraine-crisis-status-idUSKBN0MD1ZK20150317, retrieved 23 April 2016. 21
See, for instance, the UN report at www.un.org/press/en/2015/sc12154.doc.htm, retrieved 23 April 2016.
22In 2019, the International Court of Justice has agreed it has jurisdiction to hear claims by Ukraine against
Russia related to the conflict in eastern Ukraine. See https://news.un.org/en/story/2019/11/1051001?fbclid= IwAR3e 2GRvrKvydI451 3FXiUwNwUSEgZDVx8LerAz RiUri76wHmOOrfI4A, retrieved 23 November 2019.
23The research project involved historians, sociologists, anthropologists, economists, literary critics and linguist
from Austria, Canada, Germany, Poland, Russia, Switzerland, Ukraine and the USA. Further details are available at https://gce.unisg.ch/de/ua-regio, retrieved 3 December 2019.
24
Since interviews were conducted by different survey agencies, there is no information whether any respondent or household participated in both survey waves.
the Ukrainian authorities at that time. For this reason, Crimea, which was annexed by Russia in March 2014, is excluded, as well as those parts of Donetsk and Luhansk oblasts controlled by the pro-Russian fighters. The sampling was based on stratification by gender, age and municipality type.
The face-to-face interviews were conducted either in Ukrainian or Russian, as preferred by a respondent. Therefore, no misunderstandings related to language issues are to be expected. Interviewers came from the main cities of the oblasts in which they conducted interviews, i.e. interviewers travelled within one oblast only, which reduced the likelihood of an interviewer to be
perceived as stranger by respondents and consequently mistrusted.25 Furthermore, interviewers
were instructed to emphasize that the survey was carried out for research purposes only and that analyses would be performed anonymously on the aggregate level, in order to minimize mistrust and reluctance to answer politically sensitive questions. Indeed, response rates are rather high as outlined further below. It is worth mentioning that respondents did not receive any material incentives for their survey participation which could otherwise potentially influence the observed response rates or expressed opinions.
This study focuses on questions about preferences for the political future of Ukraine, attitudes
about Ukrainian–Russian relations and sentiments towards Ukraine and Ukrainians.26
Respon-dents were asked, inter alia, to state their most preferred option out of several mutually exclusive scenarios: Ukraine remains an independent and neutral state, Ukraine enters a large union
includ-ing Russia, Ukraine splits into separate states.27 In our analysis each option is a binary variable
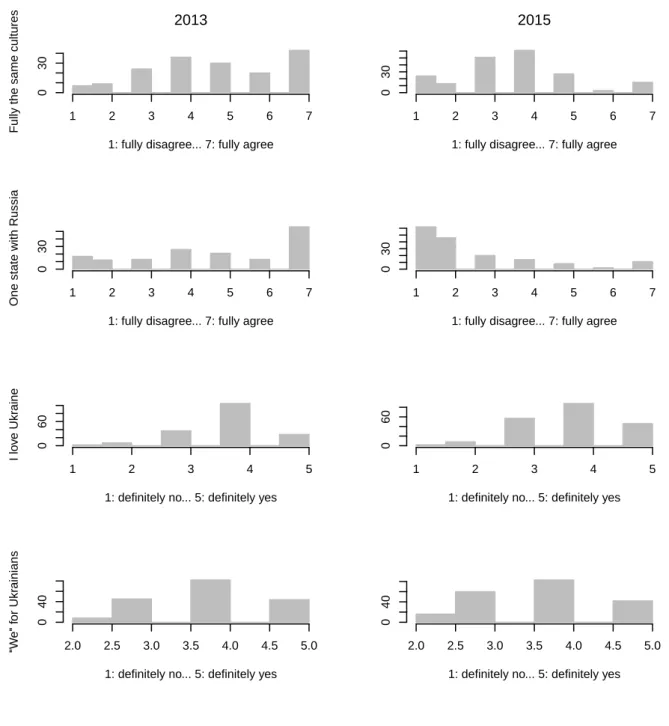
which is coded as one if it is picked as preference and zero otherwise. Furthermore, interviewees were asked to which extent they agreed or disagreed with the following statements: the Ukrainian and Russian cultures are exactly the same, Ukraine and Russia should form one state, they love Ukraine, and they speak about Ukrainians as “we” and not as “they”. The former two questions are evaluated on a point scale from 1 (“fully disagree”) to 7 (“fully agree”), and the latter two are assessed on a scale from 1 (“definitely no”) to 5 (“definitely yes”). Besides the outcomes of interest, the data also include a range of socioeconomic information about the respondents, such as gender, age, education, native language, religion, occupation, marital status, household size, residence and self-assessed material conditions.
further oblasts: Kharkiv, Dnipropetrovsk, and Zaporizhia (hereinafter referred to as the remainder of the east ). Taken together, these five oblasts form the east of Ukraine, which is characterized by a high concentration of native Russian speakers and heavy industry as well as the geographic proximity and historic connections to Russia. Figure 1.1 illustrates the front line in Donbas end of March 2015 to show which parts of Donetsk and Luhansk oblasts were under government control at the time of the second survey.
Figure 1.1: Front line in Donbas as of 31 March 2015
Source: Information Analysis Center of the National Security and Defense Council of Ukraine, www.mediarnbo.org, retrieved 24 July 2015.
Given that the interviewers could reach only areas controlled by the Ukrainian authorities in early 2015 and that the sociological agencies conducting the surveys were different in the two periods, the included cities and villages in eastern Ukraine only partially coincide across the survey
waves. To maximize the comparability of observations in 2013 and 2015, and thus to control for municipality-specific unobservables, our main analysis and most robustness checks only include
cities that were observed in both periods.28 The evaluation sample consists of 920 observations in
2013 and 1153 observations in 2015 (see Appendix Table 1.A1), and also includes 8 municipalities with 380 observations over both periods in Donbas and 19 municipalities with 1693 observations in the remainder of the east. However, our several robustness checks (see Tables 1.7 and 1.8 below) use all of the identifiable municipalities, no matter whether they were sampled in both waves or one wave only.
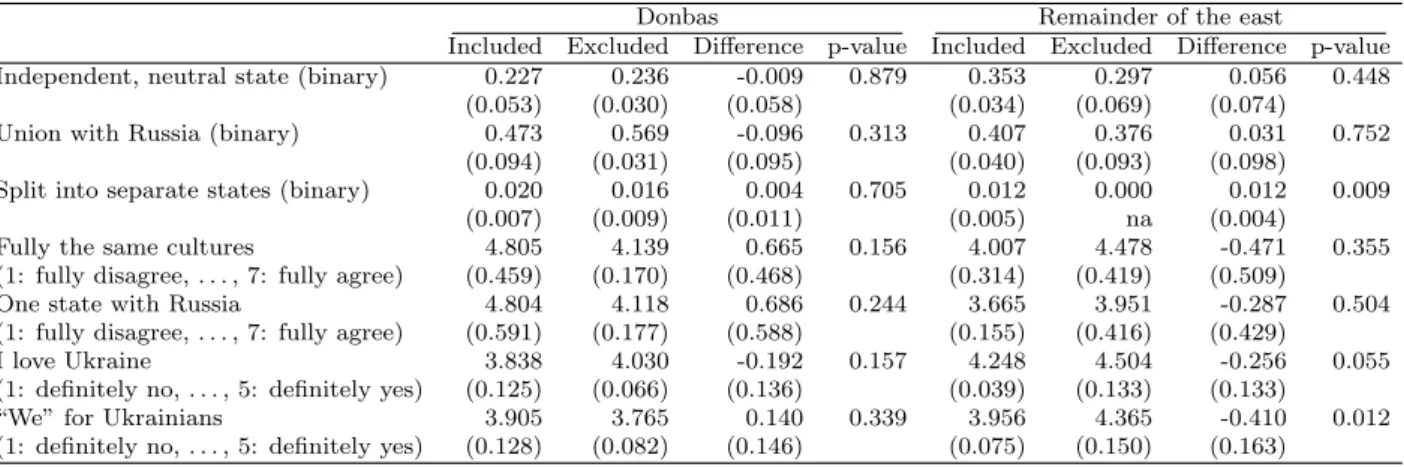
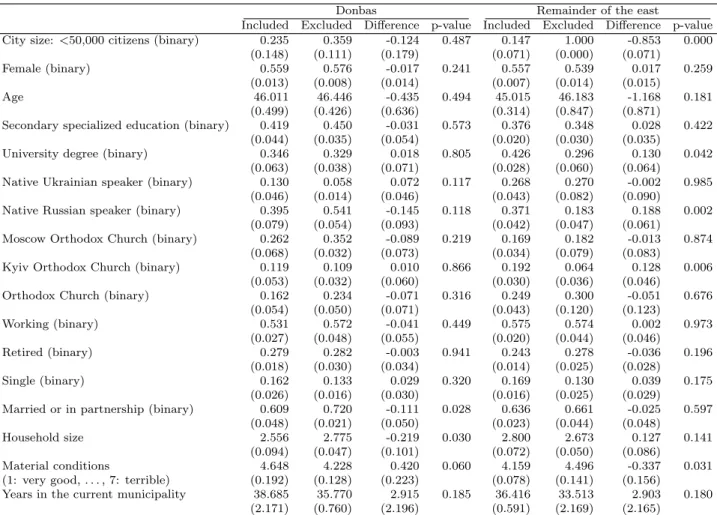
To assess whether the evaluation sample is representative for the east of Ukraine prior to the war, we test for differences in means of both outcome and control variables across the included and excluded observations, separately for Donbas and the remainder of the east in the first wave. Ap-pendix Tables 1.A2 and 1.A3 document the corresponding descriptive statistics and t-test results. We do not find any significant differences in outcome variables between the included and excluded Donbas cities. In the remainder of the east, the included cities were on average less pro-Ukrainian and more likely to support the country split than the excluded cities. Concerning socioeconomic characteristics, we observe some significant differences across the groups. On average, respondents in the excluded Donbas cities lived in larger households, reported better material conditions, and were more likely to have a spouse or a partner than respondents in the included cities. The com-parison of the included and excluded cities in the rest of the east suggests that the former were on average significantly larger, with a higher share of university-educated respondents, native Russian speakers, and followers of the Kyiv Orthodox Church. We therefore bear in mind that in terms of pre-war outcome and control variables, our evaluation sample appears to be much more represen-tative for Donbas than for the remainder of the east. However, the latter seems to be only a minor caveat in the context of our quantitative analysis, which focuses on the effect in the war-affected Donbas.
Our DiD approach outlined in Section 1.4 exploits variability in exposure to war across the country. Since the onset of the conflict, only some parts of Donetsk and Luhansk oblasts have experienced hostilities. Though the front line has moved, the regional capitals of Donetsk and
individuals residing in the other eastern oblasts belong to the low treatment group.
Table 1.1 reports descriptive statistics and t-test results for political attitudes across the treat-ment groups in the two periods. Compared to the rest of the east, Donbas on average shows signif-icantly lower preference for independent Ukraine, stronger support for one state with Russia, and weaker affinity with Ukraine in the first wave. In the second wave, Donbas appears significantly less sympathetic towards Ukraine and Ukrainians and more likely to opt for the country split than the rest of the east.
Table 1.1: Mean outcome values for Donbas and the remainder of the east
2013 2015
Donbas East Difference p-value Donbas East Difference p-value
Independent, neutral state (binary) 0.227 0.353 -0.127 0.036 0.429 0.449 -0.020 0.873
(0.053) (0.034) (0.060) (0.107) (0.076) (0.127)
Union with Russia (binary) 0.473 0.407 0.066 0.500 0.117 0.101 0.016 0.784
(0.094) (0.040) (0.098) (0.060) (0.011) (0.058)
Split into separate states (binary) 0.020 0.012 0.008 0.286 0.136 0.034 0.103 0.024
(0.007) (0.005) (0.008) (0.046) (0.013) (0.045)
Fully the same cultures 4.805 4.007 0.798 0.138 3.634 4.120 -0.486 0.145
(1: fully disagree, . . . , 7: fully agree) (0.459) (0.314) (0.537) (0.219) (0.261) (0.333)
One state with Russia 4.804 3.665 1.139 0.052 2.448 2.458 -0.010 0.976
(1: fully disagree, . . . , 7: fully agree) (0.591) (0.155) (0.584) (0.284) (0.209) (0.341)
I love Ukraine 3.838 4.248 -0.410 0.001 3.836 4.423 -0.587 0.000
(1: definitely no, . . . , 5: definitely yes) (0.125) (0.039) (0.125) (0.104) (0.052) (0.112)
“We” for Ukrainians 3.905 3.956 -0.050 0.724 3.751 4.176 -0.425 0.044
(1: definitely no, . . . , 5: definitely yes) (0.128) (0.075) (0.143) (0.194) (0.103) (0.211)
Note:Donetsk and Luhansk oblasts form the high treatment group (‘Donbas’), while the rest of the east forms the
low treatment group (‘East’). Each variable is averaged over non-missing values. Standard errors are clustered at the city level and reported in parentheses.
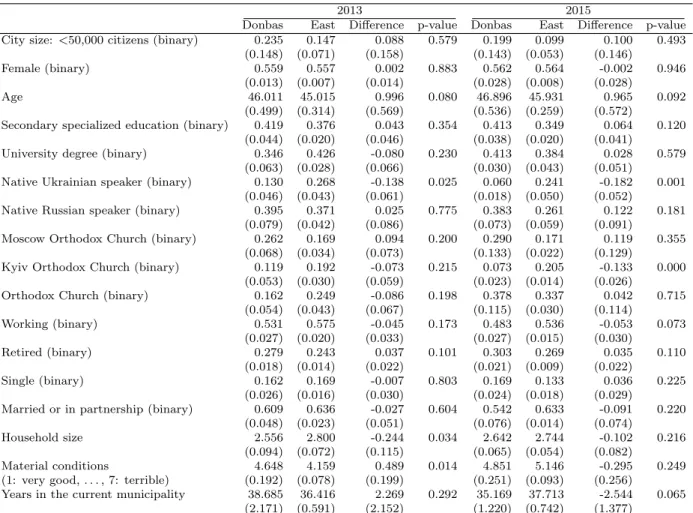
In Table 1.2, we present descriptive statistics and t-test results for control variables. It is mostly municipalities with more than 50,000 inhabitants that contribute to our data. Females compose more than 50% of the sample and the average respondents’ age is 45–47 years. The majority have at least secondary education, follow one of the Orthodox Churches, work, and are married or in partnership. The data suggest that respondents have on average resided at least 35 years in their actual municipalities. Concerning native language, Russian is more common than Ukrainian in
either treatment group.30 In both waves, we observe that the share of native Ukrainian speakers
is significantly lower and the average age of respondents is significantly higher in Donbas than in the rest of the east. In 2013, Donbas also significantly differs by a higher retirement rate, a smaller average household size, and worse off material conditions. In 2015, the share of followers of the Kyiv Orthodox Church, the employment rate and residents’ loyalty are significantly lower in Donbas compared to the rest of the east.
30
Many respondents are bilingual, both native Ukrainian and Russian speakers. In 2013, the share of bilingual re-spondents is 0.373 in Donbas and 0.336 in the rest of the east (p = 0.660, two-sided t-test). In 2015, the corresponding shares are 0.507 and 0.435 (p = 0.341, two-sided t-test).
Table 1.2: Mean covariate values for Donbas and the remainder of the east
2013 2015
Donbas East Difference p-value Donbas East Difference p-value
City size: <50,000 citizens (binary) 0.235 0.147 0.088 0.579 0.199 0.099 0.100 0.493
(0.148) (0.071) (0.158) (0.143) (0.053) (0.146)
Female (binary) 0.559 0.557 0.002 0.883 0.562 0.564 -0.002 0.946
(0.013) (0.007) (0.014) (0.028) (0.008) (0.028)
Age 46.011 45.015 0.996 0.080 46.896 45.931 0.965 0.092
(0.499) (0.314) (0.569) (0.536) (0.259) (0.572)
Secondary specialized education (binary) 0.419 0.376 0.043 0.354 0.413 0.349 0.064 0.120
(0.044) (0.020) (0.046) (0.038) (0.020) (0.041)
University degree (binary) 0.346 0.426 -0.080 0.230 0.413 0.384 0.028 0.579
(0.063) (0.028) (0.066) (0.030) (0.043) (0.051)
Native Ukrainian speaker (binary) 0.130 0.268 -0.138 0.025 0.060 0.241 -0.182 0.001
(0.046) (0.043) (0.061) (0.018) (0.050) (0.052)
Native Russian speaker (binary) 0.395 0.371 0.025 0.775 0.383 0.261 0.122 0.181
(0.079) (0.042) (0.086) (0.073) (0.059) (0.091)
Moscow Orthodox Church (binary) 0.262 0.169 0.094 0.200 0.290 0.171 0.119 0.355
(0.068) (0.034) (0.073) (0.133) (0.022) (0.129)
Kyiv Orthodox Church (binary) 0.119 0.192 -0.073 0.215 0.073 0.205 -0.133 0.000
(0.053) (0.030) (0.059) (0.023) (0.014) (0.026)
Orthodox Church (binary) 0.162 0.249 -0.086 0.198 0.378 0.337 0.042 0.715
(0.054) (0.043) (0.067) (0.115) (0.030) (0.114) Working (binary) 0.531 0.575 -0.045 0.173 0.483 0.536 -0.053 0.073 (0.027) (0.020) (0.033) (0.027) (0.015) (0.030) Retired (binary) 0.279 0.243 0.037 0.101 0.303 0.269 0.035 0.110 (0.018) (0.014) (0.022) (0.021) (0.009) (0.022) Single (binary) 0.162 0.169 -0.007 0.803 0.169 0.133 0.036 0.225 (0.026) (0.016) (0.030) (0.024) (0.018) (0.029)
Married or in partnership (binary) 0.609 0.636 -0.027 0.604 0.542 0.633 -0.091 0.220
(0.048) (0.023) (0.051) (0.076) (0.014) (0.074)
Household size 2.556 2.800 -0.244 0.034 2.642 2.744 -0.102 0.216
(0.094) (0.072) (0.115) (0.065) (0.054) (0.082)
Material conditions 4.648 4.159 0.489 0.014 4.851 5.146 -0.295 0.249
(1: very good, . . . , 7: terrible) (0.192) (0.078) (0.199) (0.251) (0.093) (0.256)
Years in the current municipality 38.685 36.416 2.269 0.292 35.169 37.713 -2.544 0.065
(2.171) (0.591) (2.152) (1.220) (0.742) (1.377)
Note:Donetsk and Luhansk oblasts form the high treatment group (‘Donbas’), while the rest of the east forms the
low treatment group (‘East’). Each variable is averaged over non-missing values. Standard errors are clustered at the city level and reported in parentheses.
1.4
Econometric methods and identification
We use two econometric approaches to infer the effect of the war on political preferences and sentiments of the two treatment groups with high and low exposure to the conflict in eastern Ukraine as outlined in Section 1.3. First, we apply a before-after analysis to examine changes in
where Y is the outcome, 1{year2015} is an indicator for the year 2015, X is a vector of the control
variables defined in Section 1.3, and U is the error term. Coefficient β1 yields the war effect on the
outcome of interest. However, if the assumption of no time trends in unobservables (e.g. industry-specific economic relations with Russia) is violated, we cannot separate the war effect from the
trend using the before-after comparison, because 1{year2015} is correlated with U even conditional
on X. Albeit we suspect time trends in political preferences and sentiments to be rather negligible given our time window of just two years, we cannot rule them out entirely.
Second, we use a difference-in-differences (DiD) approach to compare the change in attitudes for the high treatment group relative to the low treatment group before and after the outbreak of the war. DiD estimation conventionally assumes that (i) both a treatment and a control group, with the latter not being exposed to the treatment at all, are available, and that (ii) the (hypothetical) average outcomes of the treated and control groups, if neither group had actually received the treatment, would follow a common time trend while their levels may differ across groups. As discussed in Lechner (2011), this is, for instance, satisfied if the effects of unobservables on the outcome, which differ across treatment groups, are constant over time. In our empirical context, however, the assumption of a proper control group with zero treatment intensity does not seem to hold because the entire country is affected by the conflict in Donbas through the economic and social consequences, the recruitment of troops, the discussions in politics, the media, and the civil society.
Adding to the conventional common trend assumption, Fricke (2017) suggests further restrictions which allow comparing high and low (rather than zero) treatment groups over time. His approach identifies a lower bound on the absolute magnitude of effect of a high treatment vs. no treatment in the high treatment group even if the no treatment case is not observed in the data. The identifying assumptions imply that (i) the treatment affects the high and low treatment groups in the same direction compared to no treatment, and that (ii) the effect of the high treatment in the high treatment group is in absolute terms stronger than the effect of the
low treatment in the low treatment group.31 Assuming linearity, DiD estimation is based on the
following regression model:
Y = β0+ 1{year2015}β1+ 1{Donbas}β2+ 1{Donbas∗year2015}β3+ X0β4+ U, (1.2)
where Y is the outcome of interest, 1{year2015} is an indicator for the year 2015, 1{Donbas} is an
indicator for residing in either Donetsk or Luhansk oblast, 1{Donbas∗year2015} is the interaction of
the indicators, X is a vector of the control variables, and U is the error term. Under the stated
conditions, coefficient β3 corresponds to the lower bound of the war effect.
The interpretation of the DiD results presented in Section 1.5 crucially depends on whether the
31
Fricke (2017) also demonstrates that the conventional common trend assumption defined upon treatment vs. no treatment does not even allow point identifying the effect of a high vs. a low treatment, unless effect homogeneity across treatment groups is assumed.
mentioned identifying assumptions are satisfied in our empirical context. Given the comparably strong cultural coherence of the region considered (see, for example, Arel, 2006), assuming com-mon trends in political attitudes toward Russia and Ukraine in the absence of war appears quite
plausible, at least after controlling for important socioeconomic factors defined in Section 1.3.32
To gauge the plausibility of the common trend assumption, Figure 1.2 compares the vote shares for two pro-Russian parties — the Party of Regions (PR) and the Communist Party of Ukraine (CPU) — in the parliamentary elections in Donbas and the rest of the east before and after the conflict outbreak. While we observe nearly parallel trends in the vote shares in the two areas prior
to the conflict, there is a marked divergence in trends of 9.1 percentage points afterwards.33
Figure 1.2: Dynamics of regional vote shares (%) in the parliamentary elections 2006–2014
(a) Party of Regions
73.9 72.6 62.3 48.8 50.4 38.8 2006 2007 2012 Year
(b) Communist Party of Ukraine
3.6 6.9 21 5.2 8 20.3 2006 2007 2012 Year
(c) Pro-Russian parties jointly
77.5 79.5 83.3 48.9 54 58.4 59.1 33.8 2006 2007 2012 2014 Year
Note: The solid and dashed lines present Donbas and the rest of the east, respectively. In 2014, the pro-Russian parties include the Opposition Bloc and the Communist Party of Ukraine. Vote shares are calculated using the official data of the Central Election Commission, www.cvk.gov.ua, retrieved 18 June 2019.
In Section 1.6, we further examine the credibility of the common trend assumption using a placebo test, which is an alternative to testing parallel trends in previous periods. Besides, we also believe that the additional restrictions of Fricke (2017) are satisfied. First, treatment intensity can likely be ordered as a function of exposure to war. Second, the effect of war on political attitudes towards Russia and Ukraine should, at least on average, have the same sign across subregions of
eastern Ukraine.34
32
We estimate equations (1.1) and (1.2) based on OLS, which linearly controls for differences in observed characteristics. As the linearity assumptions may, however, be violated in reality, we also consider a semiparametric approach. The latter is based on inverse probability weighting by the propensity score, i.e. the probability of receiving the treatment conditional on the observed covariates (see Horvitz and Thompson, 1952; Hirano et al., 2003; Abadie, 2005, in the context of DiD estimation). In the first step, we estimate the treatment propensity score by logistic regression. In the second step, we reweight observations (i) in the high treatment group before the war, (ii) in the low treatment group before the war, and (iii) in the low treatment group after the outbreak of the war to match the distribution of covariates in the high treatment group after the outbreak of the war. Finally, we take differences in the mean differences of the reweighted outcomes within treatment groups over time. Concerning inference, we use a block bootstrap procedure (with 999 replications) that accounts for clustering at the municipal level and estimates the standard errors to be used in the t-statistics based on the bootstrap distributions of the resampled parametric and semiparametric effect estimates.
At this point, it is important to acknowledge that several of our control variables (e.g. employ-ment status, material conditions, household size, and residence) are likely to be affected by the conflict and thus endogenous. For this reason, the next section also presents before-after and DiD estimates without controlling for X. Despite the obvious trade-off between dropping covariates at the risk of omitted variable bias and including covariates at the risk of endogeneity (or selec-tion) bias, the obtained estimates are often not significantly affected by the choice of X. The same
applies to using only a subset of the observables.35
A final concern for our econometric approaches is sample selection due to migration movements between the two waves that may importantly affect the composition of the population in the area. That is, individuals with particular characteristics might have been more likely to migrate.
For instance, Coup´e and Obrizan (2016b) report that in their sample coming from two cities in
Donetsk, those who stayed and those who temporarily left the cities during military confrontations differed by age, education level, religiousness and ability to speak both Ukrainian and Russian. In our models, we control for these and even more characteristics, but sample selection bias in particular related to unobservables might nevertheless be an issue. For instance, pro-Russian individuals could have left the government-held territory for Russia or the occupied areas, while pro-Ukrainian individuals might have done vice versa or migrated further away from the front line within the government-held areas. A specific threat is that the war has induced mass migration out of Donbas such that the residents in 2015 are not representative of those in 2013 anymore, which would jeopardize both our before-after and DiD analyses.
To judge the relevance of such issues, Table 1.3 reports the net internal migration in five oblasts
larger in the high treatment group. If time trends were absent such that before-after estimation was unbiased, this would provide empirical evidence in favor of the additional restrictions in Fricke (2017).
35
of eastern Ukraine over 2012–2015, as provided by the Statistics Department of Ukraine based on
administrative data on the change of permanent residence.36 While net migration in Donbas —
Donetsk and Luhansk oblasts — has already been negative in 2012 and 2013, net outmigration roughly doubled in the war year of 2014. Quite the contrary, net migration to the remainder of the east considerably increased in that year, most likely due to incoming migrants from Donbas. In 2015, all oblasts — except for Kharkiv oblast — experienced net outmigration. Even though we do see a noticeable change in net migration patterns during the war, the movements out of Donbas, for instance, appear moderate compared to the entire population of the area (roughly 6.6
million in 2013, including both government-help and occupied territories).37
Table 1.3: Net internal migration (persons) in eastern Ukraine over 2012–2015
Oblasts 2012 2013 2014 2015 Dnipropetrovsk -1,564 -2,169 431 -1,351 Donetsk -4,449 -4,516 -10,677 -9,239 Kharkiv 1,984 1,741 8,261 4,981 Luhansk -4,034 -4,365 -8,120 -5,634 Zaporizhia -1,361 -1,916 -847 -797
Source: State Statistics Service of Ukraine, www.ukrstat.gov.ua, retrieved 12 November 2018.
As an important caveat, however, the statistics do not cover migrants or refugees that did not register in their destination municipality. For this reason, we also consider information from the Interagency Headquarters, a governmental agency that provides estimates for the number of the internally displaced persons (IDPs) as a consequence of the events in Crimea and Donbas. As of 31
March 2015, it is claimed that there were 810,060 IDPs in total, including 789,670 from Donbas,38
which is a much higher figure than the administrative records indicate. As shown in Figure 1.3, about 69% of IDPs were accommodated in eastern Ukraine: Kharkiv oblast hosted the highest number of IDPs, and nearly 32% moved to the government-held parts of Donbas. Hence, many IDPs relocated within the Donbas region. In addition to internal migration, many Ukrainians also fled to Russia, starting from 2014. Table 1.4 illustrates a dramatic increase in the number of Ukrainians registered with the legal status of refugee or temporary asylum in Russia which reached 311,407 at the end of 2015.
Figure 1.3: Internally displaced persons by destination region as of 31 March 2015 157.332 Kharkiv 154.789 Luhansk 103.758 Donetsk 82.734 Dnipropetrovsk 60.742 Zaporizhia 39.047 Kyiv City 37.060 Kyiv 174.598 Other 0 20 40 60 80 100 120 140 160 Thousands of IDPs
Source: Governmental Portal, www.kmu.gov.ua, retrieved 12 November 2018.
Table 1.4: Ukrainians registered with refugee or temporary asylum status in Russia over 2012–2015
Status 2012 2013 2014 2015 Refugee 5 5 229 273 Temporary asylum 0 0 231,558 311,134 Total 5 5 231,787 311,407
Source:General Administration for Migration Issues of the Interior Ministry of Russia, http://xn--b1ab2a0a.xn--b1aew.xn--p1ai/about/activity/stats/Statistics/Predostavlenie ubezhishha v Rossijskoj, retrieved 4 May 2016.
political attitudes towards Russia. If pro-Ukrainian individuals left the war-affected areas to re-settle somewhere else in eastern Ukraine, the drop in the support of Russia would be overesti-mated in the low treatment group (either through the migrants themselves or through interaction effects with locals) and underestimated in the high treatment group. This would squeeze the ab-solute magnitude of the negative DiD estimates. On the other hand, this could be countervailed by pro-Russian individuals leaving the war-affected area for territories outside the control of the Ukrainian government, in particular Russia. In this context, it is worth noting that the figures suggest that migration to Russia was lower than to other Ukrainian regions, such that we suspect attenuation bias to be the more relevant threat. Similarly to our identifying assumptions outlined above, this suggests that our main DiD effects on attitudes towards Russia are in absolute magni-tude lower bounds for the true effects. Likewise, the resulting attenuation bias could mask positive effects on the pro-Ukrainian sentiments. Again, we notice that our estimates are not very sensi-tive to the choice of the socioeconomic characteristics, which one would suspect to correlate with migration decisions. Consequently, our data do not provide evidence that the observed changes
in the population composition, potentially due to the war-induced migration, systematically influ-ence our results.
1.5
Main results
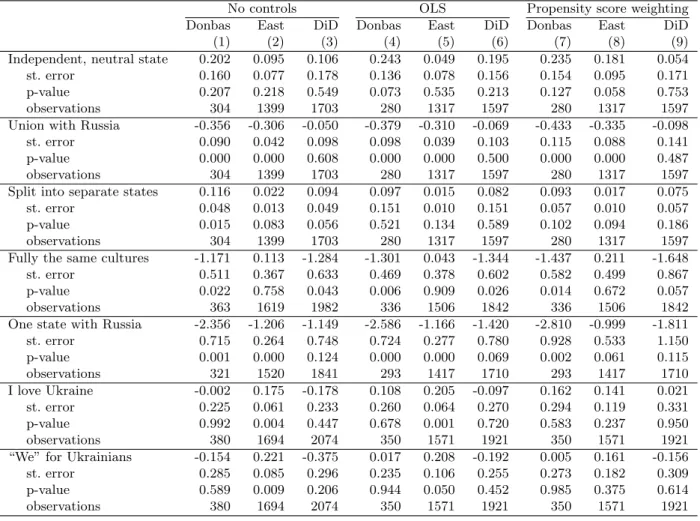
Table 1.5 provides the estimates for our main specification, namely when we distinguish between Donbas and the remainder of the east as the high and low treatment groups, and when our evaluation sample consists of the cities observed in both waves. We present the results for before-after and DiD estimations based on (i) unconditional mean differences (columns 1–3) obtained by excluding controls in equations (1.1) and (1.2), (ii) OLS controlling for the socioeconomic factors described in Section 1.3 (columns 4–6), and (iii) propensity score weighting (columns 7–9). This entails altogether nine different estimators which produce the before-after estimates for the high and low treatment groups separately (columns ‘Donbas’ and ‘East’, respectively) as well as the DiD estimates (columns ‘DiD’).
OLS and weighting deliver in general quite similar results in terms of effect directions and mag-nitudes. We mostly find no statistically significant shift in the sympathy towards Ukraine and self-association with Ukrainians, except for the positive and statistically significant effects based on OLS and estimation without controls in the rest of the east. In contrast, several statistically significant negative associations are found between exposure to war and political attitudes towards
Russia, which is somewhat in line with the finding of Coup´e and Obrizan (2016b) that the
experi-ence of property damage decreases the support for the view that the Ukrainian government should compromise with Russia. For instance, Donbas’ perception of the Ukrainian and Russian cultures as fully the same significantly weakened over time, while no significant change is observed in the rest of the east. Hence, the corresponding DiD effects based on the inter-group changes over time are significantly negative.
Furthermore, the preference for a union with Russia significantly declined by more than 30 percentage points in either treatment group. Though the before-after estimates are larger for Don-bas, none of the corresponding DiD estimates is statistically significant. We observe a very similar pattern with respect to the preference for one state with Russia. The share of supporters of
in-Table 1.5: Estimates for Donbas and the remainder of the east
No controls OLS Propensity score weighting Donbas East DiD Donbas East DiD Donbas East DiD (1) (2) (3) (4) (5) (6) (7) (8) (9) Independent, neutral state 0.202 0.095 0.106 0.243 0.049 0.195 0.235 0.181 0.054 st. error 0.160 0.077 0.178 0.136 0.078 0.156 0.154 0.095 0.171 p-value 0.207 0.218 0.549 0.073 0.535 0.213 0.127 0.058 0.753 observations 304 1399 1703 280 1317 1597 280 1317 1597 Union with Russia -0.356 -0.306 -0.050 -0.379 -0.310 -0.069 -0.433 -0.335 -0.098 st. error 0.090 0.042 0.098 0.098 0.039 0.103 0.115 0.088 0.141 p-value 0.000 0.000 0.608 0.000 0.000 0.500 0.000 0.000 0.487 observations 304 1399 1703 280 1317 1597 280 1317 1597 Split into separate states 0.116 0.022 0.094 0.097 0.015 0.082 0.093 0.017 0.075 st. error 0.048 0.013 0.049 0.151 0.010 0.151 0.057 0.010 0.057 p-value 0.015 0.083 0.056 0.521 0.134 0.589 0.102 0.094 0.186 observations 304 1399 1703 280 1317 1597 280 1317 1597 Fully the same cultures -1.171 0.113 -1.284 -1.301 0.043 -1.344 -1.437 0.211 -1.648 st. error 0.511 0.367 0.633 0.469 0.378 0.602 0.582 0.499 0.867 p-value 0.022 0.758 0.043 0.006 0.909 0.026 0.014 0.672 0.057 observations 363 1619 1982 336 1506 1842 336 1506 1842 One state with Russia -2.356 -1.206 -1.149 -2.586 -1.166 -1.420 -2.810 -0.999 -1.811 st. error 0.715 0.264 0.748 0.724 0.277 0.780 0.928 0.533 1.150 p-value 0.001 0.000 0.124 0.000 0.000 0.069 0.002 0.061 0.115 observations 321 1520 1841 293 1417 1710 293 1417 1710 I love Ukraine -0.002 0.175 -0.178 0.108 0.205 -0.097 0.162 0.141 0.021 st. error 0.225 0.061 0.233 0.260 0.064 0.270 0.294 0.119 0.331 p-value 0.992 0.004 0.447 0.678 0.001 0.720 0.583 0.237 0.950 observations 380 1694 2074 350 1571 1921 350 1571 1921 “We” for Ukrainians -0.154 0.221 -0.375 0.017 0.208 -0.192 0.005 0.161 -0.156 st. error 0.285 0.085 0.296 0.235 0.106 0.255 0.273 0.182 0.309 p-value 0.589 0.009 0.206 0.944 0.050 0.452 0.985 0.375 0.614 observations 380 1694 2074 350 1571 1921 350 1571 1921 Note: Sample includes the cities observed in both waves. Donetsk and Luhansk oblasts form the high treatment
group (‘Donbas’), the rest of the east forms the low treatment group (‘East’). Propensity scores are estimated by logistic regression. Standard errors are clustered at the city level using 999 bootstrap replications.
To sum up, both the before-after and DiD estimates suggest that the political attitudes towards Russia have deteriorated as a consequence of the war, while this is not the case for sentiments towards Ukraine at least in Donbas. Compared to the rest of the east, the distinction between the Ukrainian and Russian cultures significantly increased in Donbas. The frequency distributions of the non-binary outcomes for Donbas over time also reveal a negative shift in sentiments towards Russia but no pronounced change with respect to Ukraine (see Appendix Figure 1.A1).
These results echo a sharp decline in the pro-Russian vote of 34.4 percentage points in Donbas and 25.3 percentage points in the rest of the east between the parliamentary elections 2012 and 2014 (see Figure 1.2). A possible reason is that people may believe that Russia has contributed to the conflict escalation in Donbas. Indeed, opinions that Russia is involved in the war and that the ongoing conflict is a war with Russia negatively correlate with attitudes towards Russia but
of armed groups, 50% for negotiations and compromise, 10.5% for federalization of the country, and 13.4% for giving up fighting for these areas — can live as they want.
positively correlate with sentiments towards Ukraine (see Appendix Table 1.A4). A possible ex-planation is that respondents updated their perceptions of Russia during the conflict, for instance, through personal experience, communication, or a change in exposure to information and/or dis-information. Information received from mass media, social networks and/or personal experiences (trauma) could have a learning or persuasion effect on respondents. Note that the presentation of events in Donbas (and Crimea) by Ukrainian and Russian media went opposite directions, and cer-tain Russian media were banned in the unoccupied territory of Ukraine shortly after the conflict outbreak. There is in fact empirical evidence suggesting that media exposure can affect political sentiments expressed in voting behavior (e.g. DellaVigna and Kaplan, 2007; Gerber et al., 2009; Enikolopov et al., 2011; DellaVigna et al., 2014). Hence, media are a plausible mediator of chang-ing attitudes towards Russia in eastern Ukraine, at least in the government-controlled areas.
Since the majority of respondents in our evaluation sample report either Russian or both Ukrainian and Russian as their native language(s), we extend our main analysis to investigate effect heterogeneity for these two language groups. Appendix Tables 1.A5 and 1.A6 report the results obtained in the corresponding subsamples. The directional patterns of the estimated effects are generally comparable to the main results. In the bilingual subsample, however, we observe more pronounced positive effects on individual preferences for independent Ukraine and negative effects on sentiments towards Russia. The findings also suggest that bilingual respondents have weakened their support for one state with Russia significantly more in Donbas than in the rest of the east. In contrast, we generally find less significant negative effects on the attitudes towards Russia among native Russian speakers. Comparing the two language groups, conditional OLS yields significant effect heterogeneity in the before-after estimates for the union with Russia in the rest of the east (p < 0.01, two-sided test). As regards the country split, the share of its Russian-speaking supporters has significantly increased in Donbas compared to the rest of the east; effect heterogeneity is statistically significant for the before-after estimates in Donbas (p < 0.05, two-sided tests) and for the DiD results (p < 0.1, two-sided tests), except for conditional OLS. We find no evidence that native Russian speakers significantly changed their sentiments towards Ukraine or Ukrainians as a consequence of the war, and the DiD estimates remain insignificant in either subsample; the corresponding estimates are not significantly different across language
(p < 0.1, two-sided tests), and the conditional OLS estimates for the same scenario in the rest of the east (p < 0.05, two-sided test). In addition, there is no evidence of any significant changes in the preference for the country split among the older respondents; we find a weakly significant effect heterogeneity in the unconditional before-after estimates for the rest of the east (p < 0.1, two-sided test).
We also observe some attitude measures with missing values in our sample. Since, due to the war, respondents in Donbas could have become less likely to answer politically sensitive questions than respondents in the rest of the east, we examine whether item non-response in the outcome variables is selective in our sample, i.e. varies systematically over time and across treatment groups. For this purpose, we create missing dummies for our outcomes of interest and use them as dependent variables in our estimators. We generally find no evidence for selective item non-response within treatment groups over time or across time trends of treatment groups (see Appendix Table 1.A9).
1.6
Robustness checks
We run several sensitivity checks to investigate the robustness of our results with respect to the definition of the treatment groups.
One concern regarding our analysis is that we only consider the remainder of the east as the low treatment group. Though ethnically less Russian than the east, the south of Ukraine is often also perceived as pro-Russian in view of its historical ties with Russia, proportion of Russian-speaking population, and support for pro-Russian parties in elections. To address this concern, we extend our evaluation sample to three southern oblasts: Kherson, Mykolaiv and Odessa. Along with the rest of the east, the south now belongs to the low treatment group, while Donbas remains the high treatment group as in the main specification. The results in Table 1.6 indicate that the before-after estimates for the low treatment group are only marginally affected. We again observe positive tendencies in the low treatment group with respect to the support for independent Ukraine and connectedness with Ukraine and Ukrainians, but the DiD estimates stay insignificant. The results also suggest that the support for the country split has significantly increased in either treatment group, but no strong evidence is found for inter-group changes over time. The negative DiD estimates on the similarity of the Ukrainian and Russian cultures are significant at the 5% level, and the negative before-after estimates for a union or one state with Russia are significant at the 1% level.
Because of incomplete regional overlap between the waves, we have so far focused on the cities observed in both waves to control for municipality-specific unobservables. We now additionally check whether the dropped observations have an impact on the estimates when including them into
the evaluation sample.40 Table 1.7 documents a significant increase in the support for independent
Table 1.6: Estimates using the extended sample with the south
No controls OLS Propensity score weighting
Donbas East & South DiD Donbas East & South DiD Donbas East & South DiD
(1) (2) (3) (4) (5) (6) (7) (8) (9)
Independent, neutral state 0.202 0.125 0.077 0.243 0.073 0.170 0.235 0.182 0.053
st. error 0.158 0.062 0.168 0.126 0.057 0.140 0.155 0.071 0.165
p-value 0.202 0.043 0.649 0.053 0.201 0.224 0.129 0.010 0.748
observations 304 2035 2339 280 1930 2210 280 1930 2210
Union with Russia -0.356 -0.315 -0.042 -0.379 -0.313 -0.066 -0.433 -0.333 -0.099
st. error 0.092 0.032 0.097 0.099 0.034 0.106 0.120 0.058 0.128
p-value 0.000 0.000 0.670 0.000 0.000 0.533 0.000 0.000 0.438
observations 304 2035 2339 280 1930 2210 280 1930 2210
Split into separate states 0.116 0.033 0.083 0.097 0.031 0.066 0.093 0.042 0.051
st. error 0.046 0.012 0.048 0.047 0.012 0.049 0.051 0.024 0.059
p-value 0.012 0.005 0.083 0.041 0.009 0.174 0.071 0.082 0.388
observations 304 2035 2339 280 1930 2210 280 1930 2210
Fully the same cultures -1.171 0.240 -1.411 -1.301 0.088 -1.389 -1.437 0.297 -1.734
st. error 0.496 0.268 0.561 0.517 0.276 0.572 0.588 0.401 0.816
p-value 0.018 0.369 0.012 0.012 0.749 0.015 0.015 0.458 0.033
observations 363 2328 2691 336 2182 2518 336 2182 2518
One state with Russia -2.356 -1.209 -1.146 -2.586 -1.182 -1.404 -2.810 -1.071 -1.739
st. error 0.753 0.196 0.782 0.913 0.220 0.943 0.930 0.373 1.085 p-value 0.002 0.000 0.143 0.005 0.000 0.136 0.003 0.004 0.109 observations 321 2168 2489 293 2033 2326 293 2033 2326 I love Ukraine -0.002 0.149 -0.151 0.108 0.131 -0.023 0.162 0.052 0.109 st. error 0.222 0.061 0.228 0.270 0.071 0.281 0.293 0.109 0.293 p-value 0.992 0.015 0.509 0.689 0.064 0.935 0.582 0.630 0.710 observations 380 2469 2849 350 2309 2659 350 2309 2659
“We” for Ukrainians -0.154 0.049 -0.203 0.017 0.019 -0.002 0.005 -0.093 0.098
st. error 0.288 0.081 0.297 0.241 0.090 0.253 0.294 0.161 0.309
p-value 0.593 0.543 0.495 0.945 0.836 0.994 0.986 0.564 0.751
observations 380 2469 2849 350 2309 2659 350 2309 2659
Note: Sample includes the cities observed in both waves. Donetsk and Luhansk oblasts form the high treatment group (‘Donbas’), the rest of the east and the south form the low treatment group (‘East & South’). Propensity scores are estimated by logistic regression. Standard errors are clustered at the city level using 999 bootstrap replications.
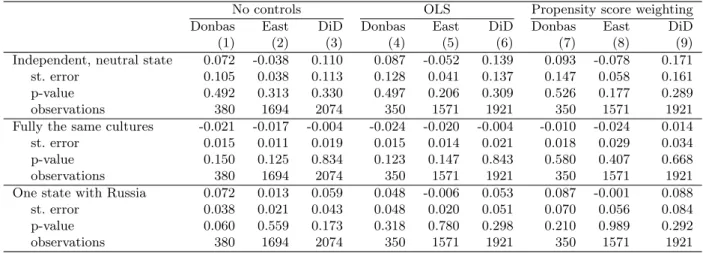
and neutral Ukraine in Donbas over time. We now find that positive sentiments towards Ukraine have significantly increased in the rest of the east compared to Donbas, where the corresponding before-after estimates remain insignificant. Furthermore, the significant growth in the preference for the country split in Donbas translates into the highly significant DiD estimates. We again confirm that either treatment group has significantly diminished its support for a union or one state with Russia. This time, no significant effects are found for the opinion that the Ukrainian
Table 1.7: Estimates using all observations in eastern Ukraine
No controls OLS Propensity score weighting Donbas East DiD Donbas East DiD Donbas East DiD (1) (2) (3) (4) (5) (6) (7) (8) (9) Independent, neutral state 0.199 0.125 0.074 0.193 0.101 0.091 0.217 0.190 0.027 st. error 0.088 0.064 0.106 0.090 0.065 0.108 0.096 0.081 0.118 p-value 0.024 0.051 0.485 0.033 0.116 0.399 0.024 0.019 0.817 observations 945 1908 2853 870 1799 2669 870 1799 2669 Union with Russia -0.402 -0.316 -0.085 -0.403 -0.317 -0.086 -0.432 -0.325 -0.107 st. error 0.059 0.033 0.067 0.043 0.032 0.054 0.050 0.060 0.081 p-value 0.000 0.000 0.199 0.000 0.000 0.110 0.000 0.000 0.187 observations 945 1908 2853 870 1799 2669 870 1799 2669 Split into separate states 0.126 0.014 0.112 0.126 0.007 0.119 0.116 0.015 0.101 st. error 0.036 0.012 0.038 0.035 0.009 0.037 0.033 0.012 0.037 p-value 0.000 0.241 0.003 0.000 0.450 0.001 0.000 0.216 0.006 observations 945 1908 2853 870 1799 2669 870 1799 2669 Fully the same cultures -0.477 -0.059 -0.418 -0.462 -0.100 -0.362 -0.581 0.107 -0.689 st. error 0.299 0.282 0.406 0.320 0.290 0.425 0.362 0.407 0.581 p-value 0.110 0.835 0.303 0.149 0.731 0.395 0.108 0.792 0.236 observations 1120 2204 3324 1032 2056 3088 1032 2056 3088 One state with Russia -1.451 -1.355 -0.095 -1.614 -1.311 -0.302 -1.799 -1.089 -0.709 st. error 0.383 0.217 0.450 0.418 0.244 0.484 0.467 0.396 0.654 p-value 0.000 0.000 0.833 0.000 0.000 0.532 0.000 0.006 0.278 observations 1041 2074 3115 956 1936 2892 956 1936 2892 I love Ukraine -0.171 0.172 -0.343 -0.174 0.176 -0.350 -0.181 0.102 -0.283 st. error 0.135 0.054 0.145 0.132 0.054 0.141 0.143 0.089 0.171 p-value 0.205 0.001 0.018 0.187 0.001 0.013 0.205 0.254 0.097 observations 1158 2303 3461 1064 2144 3208 1064 2144 3208 “We” for Ukrainians -0.035 0.179 -0.215 -0.006 0.130 -0.136 -0.035 0.044 -0.079 st. error 0.196 0.074 0.209 0.179 0.083 0.193 0.197 0.123 0.229 p-value 0.858 0.016 0.304 0.972 0.119 0.481 0.860 0.722 0.732 observations 1158 2303 3461 1064 2144 3208 1064 2144 3208 Note: Donetsk and Luhansk oblasts form the high treatment group (‘Donbas’), the rest of the east form the low
treatment group (‘East’). Propensity scores are estimated by logistic regression. We additionally control for a village dummy in the conditional regression analyses. Standard errors are clustered at the city level using 999 bootstrap replications.
treatment group remains the same as in the previous robustness check, while the low treatment group includes the rest of Ukraine. The findings in Table 1.8 suggest that love towards Ukraine has significantly increased in the latter compared to the former. Furthermore, the DiD estimates in the unconditional and conditional OLS analyses show that the increase in the share of respondents opting for independent Ukraine is significantly greater in Donbas than in the rest of Ukraine. Similar to the earlier results, the preference for the country split has grown significantly more in Donbas. Again, the before-after estimates concerning a union or one state with Russia are significantly negative at the 1% level. For a union with Russia, the negative DiD results are also highly significant. Unlike in the main specification, we find insignificant DiD estimates on the similarity between Ukrainian and Russian cultures as the negative time trends in either treatment
therefore also excluded from the analysis. The inclusion of Crimea does not change the results that are not reported but available on request.