Clean Development Pathways for India: Evaluating Feasibility
and Modeling Impact of Policy Options
by
Arun Singh
B.Tech. Chemical Engineering
Indian Instititute of Technology, Roorkee, 2011
SUBMITTED TO THE INSTITUTE FOR DATA, SYSTEMS, AND SOCIETY IN PARTIAL FULFILLMENT OF
THE REQUIREMENTS FOR THE DEGREE OF
MASTER OF SCIENCE IN TECHNOLOGY AND POLICY
AT THE
MASSACHUSETTS INSTITUTE OF TECHNOLOGY
JUNE 2017
© 2017 Massachusetts Institute of Technology. All rights reserved.
Signature of Author ………
Institute for Data, Systems, and Society
May 12, 2017
Certified by ………
Valerie Karplus
Asst. Professor, MIT Sloan School of Management
Thesis Supervisor
Certified by ………
Niven Winchester
Principal Research Scientist, MIT Joint Program
Thesis Supervisor
Accepted by ………..
Munther Dahleh
Professor, Electrical Engineering and Computer Science
Director, Institute for Data, Systems, and Society
3
Clean Development Pathways for India: Evaluating Feasibility and Modeling
Impact of Policy Options
by
Arun Singh
Submitted to the Institute for Data, Systems, and Society on
May 12, 2017 in Partial Fulfillment of the Requirements for the
Degree of Master of Science in Technology and Policy
Abstract
Sustaining rapid economic growth and satisfying increasing energy demand while limiting greenhouse gas (GHG) emissions is a central challenge in India. Proposed policy solutions should be evaluated according to their impacts on the energy system and the economy to identify efficient policies. I have developed an energy-economic model for India that provides a comprehensive foundation for analyzing energy technologies and policies. This novel model based on a general equilibrium approach simulates the Indian economy, with detailed inter-sectoral linkages, and facilitates an understanding of economy-wide impacts of policies. The model allows for analysis of tradeoffs among different technology and policy choices in terms of their costs and efficiency in GHG emissions reduction.
While comprehensive carbon pricing is arguably the most economically efficient measure for emissions reduction, political considerations often favor technology-specific choices. Support for renewable energy factors prominently in India’s climate change mitigation strategy. To study the impact of policies that promote renewable energy, the model represents renewable electricity in detail. Impact of incentives and scale factors are also incorporated in projecting renewables expansion. I simulate India’s Nationally Determined Contributions (NDCs) to the Paris Agreement and compare their effectiveness, benchmarking them against the theoretical least-cost alternative of broad-based carbon pricing. Specifically, India’s NDCs include targets on non-fossil electricity capacity expansion and CO2 emissions intensity of GDP (GoI
2015a). This work provides valuable quantitative insights on the impact of these policy measures, and fills a critical knowledge gap in the design and implementation of effective climate policies in India.
My findings suggest that compared to a reference case of no policy constraint, the average cost of reducing a tonne of CO2 is lowest in a scenario with an emissions intensity target implemented via CO2
pricing, and more than 43 times higher in the pure non-fossil electricity target scenario. Further, emissions intensity targets result in a 6.3% drop in total electricity demand, as the cost of fossil fuel based electricity increases. As CO2 emitting electricity sources become more expensive, non-fossil sources - particularly
solar and wind - increase in the mix. Enforcing non-fossil electricity capacity targets leads to an additional 15.6% drop in total electricity demand as average electricity prices increase to account for a higher share of costlier non-fossil electricity. Non-fossil electricity capacity targets also result in leakage of emissions to non-electricity energy sectors. The magnitude of differences among these results depends on wind and solar electricity costs. Cheaper costs of wind and solar power lead to lower welfare losses and electricity demand levels that are comparable across scenarios.
4
Acknowledgements
I am deeply grateful to my advisor Prof. Valerie Karplus for her guidance and support throughout the course of this work. Valerie has always motivated me to push boundaries and has helped provide shape and method to my vaguely defined research ideas. I owe to Valerie not only the completion of this thesis, but a great extent of my professional development at MIT.
Equally important has been the role of Dr. Niven Winchester in helping me learn and use computable general equilibrium modeling. Niven patiently guided me as I moved from asking incredibly stupid questions in the beginning to slightly less stupid questions towards the end. The numerous modeling discussions with Niven have been thoroughly intellectually stimulating.
My heartfelt thanks to Dr. Rob Stoner and the Tata Center for Technology and Design for generously supporting my research and my visits to India.
Prof. Sebastian Rausch and his group at ETH Zürich were kind to host me in summer and provided valuable research inputs. I am thankful to MISTI for supporting the visit.
I am also thankful to the people I met in India, particularly those at the NITI Aayog, the Ministry of Power, the Ministry of Coal, NTPC, and CEEW, for their valuable inputs. Santosh Shanbhogue, Rob Stoner, and Andrew Cockerill helped in important ways in arranging the meetings. Mudit Narain, Chintan Vaishnav, and Ambuj Sagar deserve special mention for their help with discussions and collaborations.
Over these two years, the Joint Program has provided a comfortable office space and a community from which I have constantly learned and drawn inspiration. Paul Kishimoto has always been kind with advice on modeling, reporting, software practices, and reading David Foster Wallace. Discussions with Michael Davidson on international climate governance and beyond have been very informative. Raina, Claire, and Ninad offered friendships that now transcend state and national boundaries. Late night stays in the dimly lit cubicles were fun in the company of Danielle, Christoph, and Leila. Fannie and Dimonika cannot be thanked enough for their contribution to the office and the community.
I consider myself particularly fortunate to have been a part of the TPP community. The immensely inspiring, fun, and smart people that constitute TPP have made these two years incredibly fun. Beyond many interesting discussions, the frequent trips to Kendall Cinema with Mahsa, Jieun, Denis, Dhivya, and Chetan provided memorable research breaks.
My friends from before – the amazing people from JPAL, Reliance, IIT Roorkee, Faizabad, and elsewhere – you are too many to name, but you know who you are, and I want to thank you all for the myriad ways in which you have nourished my journey.
Finally, I owe everything that I have been able to do, to the years of toil of my parents. I cannot marvel enough at their endeavors in supporting the early education of me and my siblings, in spite of having limited means. The foundation they helped lay allowed this young boy from a small town in India to believe that he can aspire. My mother’s passionate association with education as a school principal continues to inspire me every day. I dedicate this thesis to my parents as a small effort to express my immense gratitude. I also thank the rest of my family for always being supportive, and hope that I continue to expand and pursue my aspirations.
5
Table of Contents
List of Figures ... 7
List of Tables ... 8
1. Introduction ... 9
1.1. Climate Change, Political Economic Constraints, and India’s climate policies ... 12
1.2. Analyzing the Impact of India’s Climate Policies: A Computable General Equilibrium (CGE) Analysis ... 13
1.3. Winners and Losers, and Institutional Challenges to Implementation... 15
2. Context and Literature Review ... 17
2.1. Climate Change as Multiple Market Failures ... 17
2.2. Carbon Pricing: Addressing Market Failures of Climate Change... 18
2.3. Political Economy Constraints on Carbon Pricing: Rationale for Multiple Policy Instruments . 21 2.4. India: Economy, Electricity Sector, and Access Issues ... 23
2.4.1. Electricity Production Mix ... 24
2.4.2. Transmission, Distribution, and Commercial Losses ... 24
2.4.3. Growth Projections ... 25
2.4.4. Electricity Act of 2003 ... 27
2.4.5. Low Electricity Access and Per Capita Consumption ... 28
2.5. Three Dimensions of India’s Climate Policy Setup: Foundation of this Thesis ... 29
3. Methodology ... 31
3.1. Computable General Equilibrium Analysis: Theory and Examples ... 31
3.2. Equations governing a typical CGE model ... 33
3.3. Prior CGE Analysis for India ... 36
3.4. India CGE Model: Structure and Parametrization ... 37
3.4.1. Model Structure ... 37
3.4.2. Data Sources and Parametrization ... 44
3.4.3. Solving the model ... 48
3.5. Policy Scenarios ... 48
3.5.1. Emissions Intensity Target ... 48
3.5.2. Non-Fossil Target ... 48
3.5.3. Combined emissions intensity and non-fossil electricity targets ... 49
3.6. Sensitivity Analysis ... 49
4. Results... 51
6
4.2. The Impact of Alternative Wind and Solar Costs ... 57
4.2.1. Carbon Price and Welfare Loss under different scenarios and alternative renewable generation costs ... 58
4.2.2. Impact of alternative wind costs on policy outcomes... 59
4.2.3. Impact of alternative solar costs on policy outcomes ... 63
5. Conclusion ... 67
5.1. Distribution of Impacts of India’s Climate Policies ... 68
5.2. Declining Costs of Solar and Wind Power: Path towards Stronger Decarbonizing Policies ... 70
5.3. Institutional Challenges with India’s Electricity Distribution Sector ... 73
5.4. Increasing Energy Access along with GHG Mitigation Policies: Conflicts and Synergies ... 74
5.5. Future Work ... 76
Appendix A: Illustrative Social Accounting Matrix (SAM) ... 77
7
List of Figures
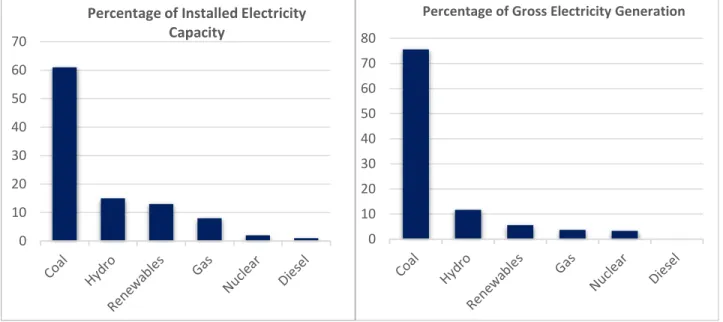
Figure 1: India Energy Mix as of 31-March-2015 (CEA 2015) ... 25
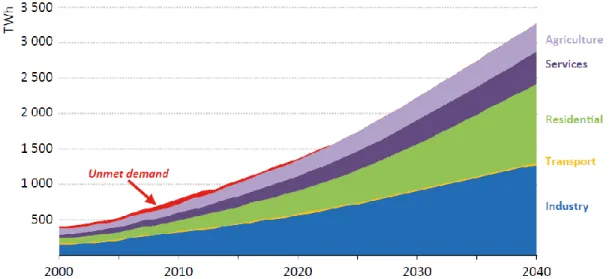
Figure 2: Electricity Demand by Sector in India in the New Policies Scenario. Source: IEA India Energy Outlook - World Energy Outlook Special Report 2015 ... 26
Figure 3: Population without access to electricity and electrification rate in India in the New Policies Scenario. Source: IEA India Energy Outlook - World Energy Outlook Special Report 2015 ... 26
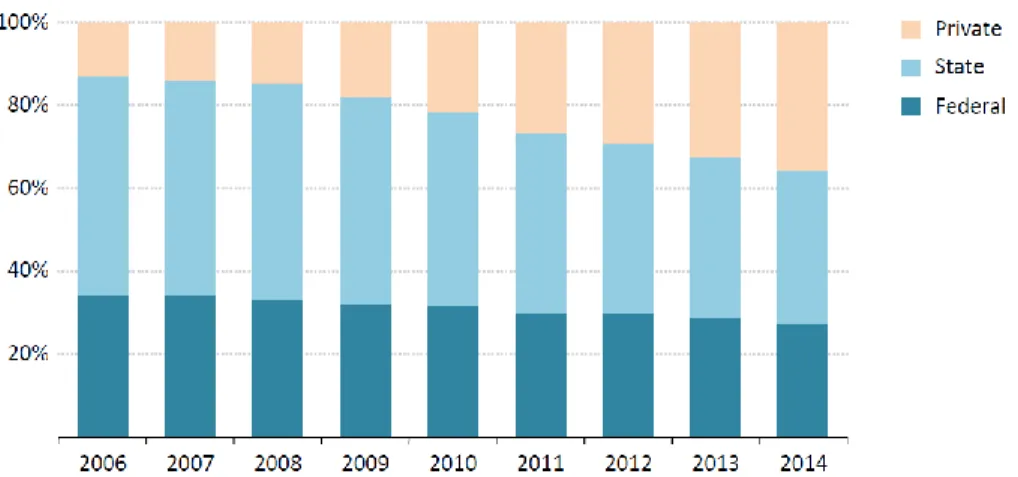
Figure 4: Power generation capacity by type of ownership in India ... 28
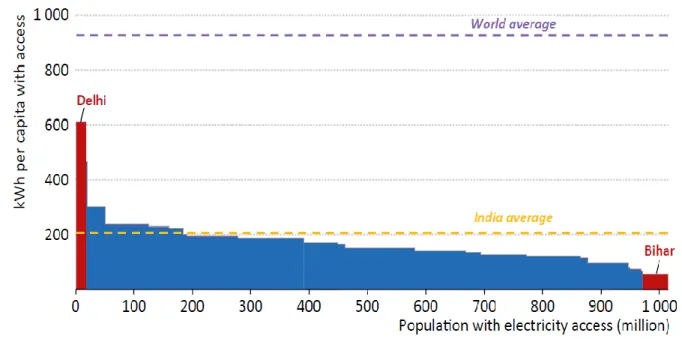
Figure 5: Annual residential electricity consumption per capita by state in India (for those with access), 2013. Source: IEA India Energy Outlook - World Energy Outlook Special Report 2015 ... 29
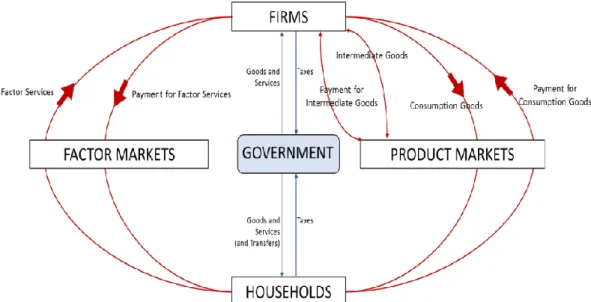
Figure 6: Basic Structure of a CGE Model ... 32
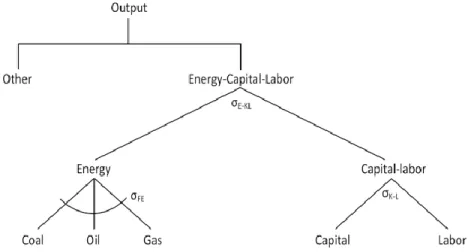
Figure 7: Nesting structure for fossil based electricity generation in EPPA. (Chen et al, 2015) ... 33
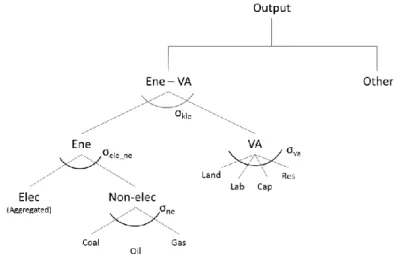
Figure 8: Nesting structures for production blocks in India CGE model ... 42
Figure 9: Price of winning bids for solar auctions in India, adjusted for inflation to INR 2016... 49
Figure 10: Drop in cost of wind power. Source: Bloomberg New Energy Finance ... 50
Figure 11: Change in consumption from reference under different scenarios ... 52
Figure 12: Change in consumption per unit emission reduction under different scenarios in 2030 ... 52
Figure 13: Total emissions and emissions intensity in 2030 under different scenarios ... 53
Figure 14: Emissions by sector in 2030 under different scenarios... 54
Figure 15: Electricity mix in India in 2030 under different scenarios ... 55
Figure 16: Source-wise difference in electricity production w.r.t. reference under different scenarios .... 56
Figure 17: Production trends of different sectors in 2030 under reference and policy scenarios ... 57
Figure 18: Variation in cost of emissions reduction with varying wind costs ... 60
Figure 19: Variation in total emissions with varying wind costs ... 61
Figure 20: Variation in electricity levels with varying wind costs ... 62
Figure 21: Variation in non-fossil subsidy requirement with varying wind costs ... 63
Figure 22: Variation in cost of emissions reduction with varying solar costs ... 64
Figure 23: Variation in total emissions with varying solar costs ... 64
Figure 24: Variation in electricity levels with varying solar costs ... 65
Figure 25: Variation in non-fossil subsidy requirement with varying solar costs ... 66
Figure 26: Global weighted average utility-scale solar PV total installed costs, 2009-25, IRENA (2016)71 Figure 27: Levelised cost of electricity of onshore wind, 1983-2025, IRENA (2016) ... 71
8
List of Tables
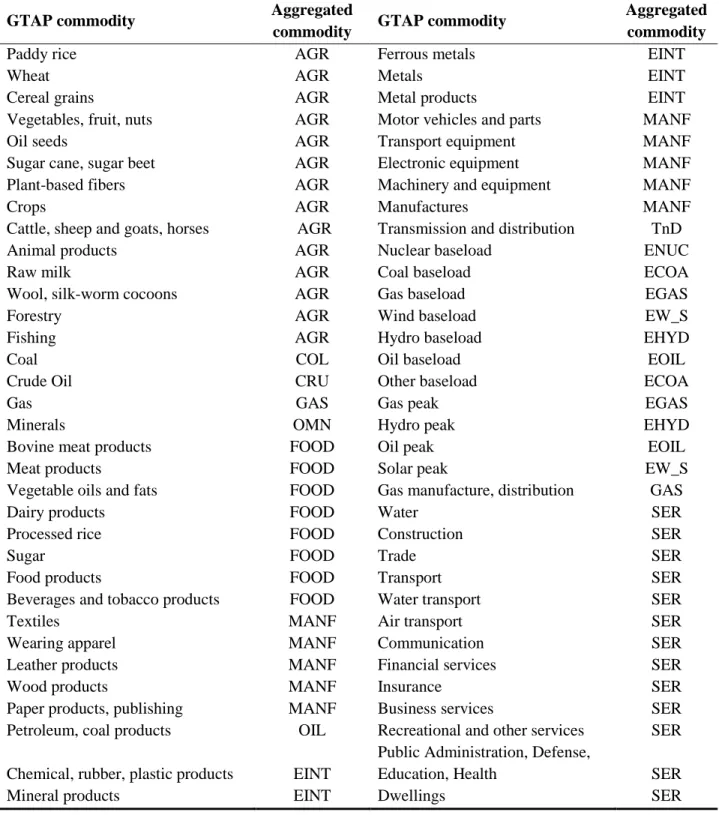
Table 1: Aggregation of GTAP commodities into sectors in the model ... 39
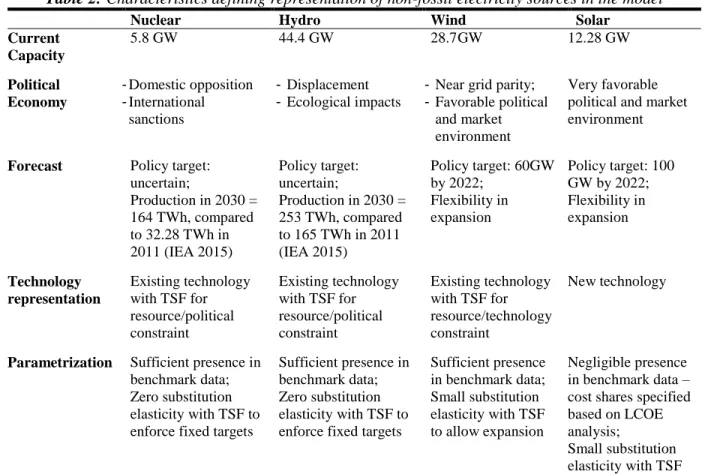
Table 2: Characteristics defining representation of non-fossil electricity sources in the model ... 41
Table 3: Calculation of Cost Shares for Advanced Solar ... 45
Table 4: Additional parameters for policy scenarios ... 45
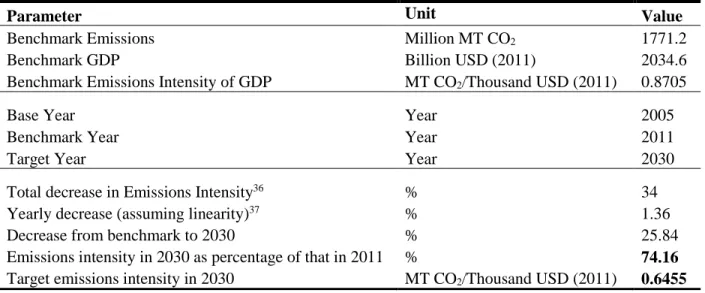
Table 5: Calculation of Emissions Intensity Target ... 46
Table 6: Conversion of non-fossil electricity capacity targets for 2030 to production targets... 47
Table 7: Summary of key base results (All dollar values are in 2011 USD) ... 51
Table 8: Comparison of carbon price and cost of emission reduction under different scenarios ... 58
9
1. Introduction
India stands at a critical juncture in its development path. Economic reforms introduced in 1991 liberalized the domestic economy and opened the country to globalization. India has been the fastest growing of the world’s major economies since 2015, when its growth rate surpassed China’s, and many projections expect this growth to continue (World Bank 2016). Twenty-five years of strong economic growth have driven up energy consumption, with the electricity base alone quadrupling from 70 GW in 1992 to 272 GW in 2015 (CEA 2015). However, given a large population base and multiple challenges with the expansion of energy supply, 1 large sections of the population still lack access to reliable and clean2
sources of energy.
India accounts for 18% of the world's population but uses only 6% of the world's primary energy.3
Nearly 240 million individuals lack access to electricity (IEA 2015). Besides, as of 2012, nearly 76% of rural households depended upon traditional biomass for their cooking needs (Saptarsh 2012). Lack of energy access and poverty are mutually reinforcing – the poor are more likely to remain poor as long as they remain without access to modern energy, a situation termed Energy Poverty.
Satisfying the unmet energy demand as well as fueling the necessary economic growth implies energy consumption would need to rapidly increase in the coming decades. The India Energy Outlook of the International Energy Agency estimates India's energy consumption will more than double to 1900 Mtoe (million tonnes of oil equivalent) by 2040, relative to 2015, accounting for nearly a quarter of the worldwide growth in energy consumption during the period (IEA 2015). A major chunk of proposed growth is likely to occur in the electricity sector, which is expected to more than triple in installed capacity from current 281 GW to 1075 GW in 2040 (roughly equal to the installed capacity in the European Union today, IEA (2015)). Owing to India's large coal reserves, a significant portion of this increase is expected to be from coal based plants.
At the same time, to meet global climate mitigation goals outlined in the 2015 Paris Climate Agreement, every country will need to make significant emissions cuts. India's emission targets submitted in its Nationally Determined Contributions (NDCs) to the 21st Conference of Parties in Paris (COP21) promise
1 We discuss these challenges in greater detail in section 2.4,but put briefly, they include poor institutional and
financial state of state distribution companies (DISCOMs), incomplete implementation of electricity reforms, low purchasing power of rural consumers, and high transmission and distribution losses etc.
2 Here, I use clean to refer to sources of energy, primarily for cooking purposes, that do not adversely impact human
health. Thus, while using biomass for cooking may qualify as cleaner than gas in terms of its CO2 emissions, it could
be considered “unclean” for its impacts on health.
3 OECD defines primary energy consumption as “the direct use at the source, or supply to users without transformation,
of crude energy, that is, energy that has not been subjected to any conversion or transformation process” (United Nations 1997).
10
a reduction in carbon emissions intensity of GDP by 33 to 35 percent by 2030 from 2005 levels. This will be accompanied by an increase in non-fossil based power to about 40% of cumulative installed capacity in 2030 (GoI 2015a).4 In 2015, the government increased its solar power installed capacity target for 2022
fivefold from 20 GW to 100 GW. Against current installed capacity of 12.28 GW (as of March 2017 - MNRE (2017)), the ambitions solar target is often seen as an indication of the commitment of India towards clean energy expansion. Simultaneously, India’s leaders are also pushing forward reforms in coal mining5
and aim to expand thermal power capacity, which, on one hand, appears to be at odds with climate commitments, but, on the other, is seen by policymakers as necessary for sustaining economic growth.
This constitutes the essence of what some call the Indian climate dilemma.6 How does India improve
the living standards of its populace and sustain strong economic growth while restricting carbon emissions to minimize the impact on climate change? There are multiple pathways to clean economic growth, each with associated costs and benefits, and comprehensive policies can be designed to suit priorities.
Economic theory suggests that pricing CO2, either through an emissions tax or a cap-and-trade scheme,
is the most efficient policy to mitigate CO2 emissions (Coase 1960; Stavins 2008; Metcalf & Weisbach
2009). Owing to varied socio-political motivations and constraints, that we discuss later, policymakers however rarely opt for a pure carbon pricing policy7 and rather pursue a mix of policies including, but not
limited to, market mechanisms, regulations, and technology preferences.
Energy forms the foundation of any modern economy and policies affecting energy prices send shocks across the economy, leading to widespread impacts. Putting an appropriate price on CO2 is expected to
account for externalities associated with its release to the atmosphere, thereby increasing the price of fossil fuels and facilitating adoption of relatively expensive non-fossil energy sources.8 Consequently, pricing
CO2 increases energy prices and the change is reflected in the price of goods and services as well as activity
levels across the economy. Pursuing technology-specific policies along with, or independent of, carbon pricing also induces changes in the economy, either through direct increase in energy prices, or through transfers resulting from subsidizing non-fossil energy to keep its prices comparable to fossil energy.
4 With the help of transfer of technology and low cost international finance including from the Green Climate Fund
(GCF)
5 India has set a volumetric target to produce 1.5 billion tonnes of coal by 2020 (IEA 2015). 6 For example, see Down To Earth (2015)
7 While acknowledging the differences between price based (emissions tax) and quantity based (cap and trade scheme)
instruments (Weitzman 1974), I refer to both as carbon pricing for the purpose of this work.
8 Risking simplicity, I sometimes use non-fossil and renewable energy interchangeably. The usage should be
considered in the context. Generally, when speaking about higher costs of non-fossil energy, I am chiefly considering solar and wind power, as the costs of nuclear and hydro power are almost comparable with the cost of fossil energy. Besides, while there is debate about considering nuclear as renewable, my general usage of non-fossil and renewable electricity assumes nuclear to be a renewable source of energy.
11
India’s energy and climate policies, including the targets proposed in its NDCs, also reflect a mix of alternate policy choices. The emissions intensity targets specify reduction in emissions level, with target stringency a function of GDP growth. These targets can be achieved through multiple policy paths, such as economy-wide emission pricing (through emission taxes or tradable permits),9 technology standards,
efficiency measures, and subsidies for cleaner energy sources etc. In principle, emissions-intensity targets would be pursued most efficiently if the least cost abatement options are adopted first, followed by successively costlier measures. Adopted abatement measures would include not only a shift to cleaner energy sources but also, and perhaps more importantly, energy efficiency measures. Studies suggest improvements in energy efficiency to be the low hanging fruit in CO2 abatement (McKinsey 2009). In
principle, emissions intensity targets are effectively a carbon pricing policy implemented via an emissions quota indexed to GDP growth.
In addition to intensity targets, India’s expansion plans for solar energy represent strong support for technology specific policies. This preference for what is arguably a second best policy option (Lipsey & Lancaster 1956; Bennear & Stavins 2007) is not unique to India. The decision processes favoring such preferences are driven by political-economic considerations emerging from the nature of the problem of climate change, and adaptation pathways favored by different sets of policies. At the same time, picking a winner among different abatement options drives changes in the economy through more restricted channels as compared to pure market based schemes, and may have differing impacts based on the transfer processes associated with subsidizing arguably more expensive measures.
Building off of these ideas and real-world policy scenarios, I develop my thesis in three steps. First, I discuss the problem of climate change along with widely accepted mitigation instruments, and the positioning of these instruments within the political economy challenges imposed by India’s electricity sector. Second, I evaluate India’s climate policy preferences by quantifying their impact on the economy, emissions, and electricity system, within a general equilibrium modeling framework. The development of this modeling capability for India’s climate policy evaluation forms the core of my work and constitutes the majority of this thesis. Third, I complete the analysis by identifying winners and losers under different policies, anticipating the interaction of expanding energy access with climate policies, and discussing implementation challenges within the existing electricity distribution sector of India.
My intent with this structure is to first qualitatively frame the setting of the problem faced by energy and climate policymakers in India. This helps identify the specific quantitative questions I deem important, and also motivates the choice of modeling framework. The utility of a model evaluating policy choices
12
should be gauged by the relevance of its analysis within the real world policy scenario, and I attempt to reflect that through the model structure and research questions. Finally, policy implementation entails impacts on winners and losers, and policymakers must grapple with these impacts if they wish to establish a level playing field. Expanding energy access while pursuing GHG mitigation policies makes designing effective policies more challenging. Besides, while model outcomes may suggest winning and losing policies based on specified evaluation criteria, actual implementation of policies is constrained (or facilitated) by the institutional setup within which they are enacted. This dictates the final piece of my inquiry where I identify winners and losers, investigate the access question, and discuss implementation challenges for preferred policies.
I briefly discuss these three components below, and expand upon them in the thesis.
1.1.
Climate Change, Political Economic Constraints, and India’s climate policies
Climate change and its impacts pose a grave challenge to the world as we know it. Developing countries are likely to face the worst impacts, with more frequent extreme weather events, floods and droughts, and shifting crop patterns, among other impacts (IPCC 2014). The threat of extreme impacts of climate change is widely recognized, motivating policy actions for mitigation and adaptation. Economists describe climate change as a problem of multiple market failures, which can be addressed by instituting appropriate policies. These market failures typically include non-accounting of negative externalities of burning fossil fuels (Hoeller & Coppel 1992; Stern 2007), the collective action problem (Olson 1984), and the principal agent problem (Eisenhardt 1989).10
Putting an appropriate price on CO2 and including it in fossil fuel prices is widely argued as the most
efficient means of adjusting for climate change induced market failures (Pigou 1920; Pearce 1991; Nordhaus 1992; Stavins 1997). Economic efficiency, however, is but one component of policy design. The nature of the problem of climate change in its temporal and geographical expanse, and widespread impacts of mitigation policies across varied stakeholders, give traction to several political economy constraints that make achieving a “first-best equilibrium”11 especially challenging (Jenkins 2014; Jenkins & Karplus 2016).
For instance, the collective action nature of the problem when combined with differing historical responsibility leads to stakeholders opting for different levels of action, an approach enshrined in the principle of common but differentiated responsibilities (UNFCCC 1992). Alternately, stakeholders with vested interests may seek to capture the process of designing and implementing climate policies (Stigler
10 I discuss these in detail in section 2.1.
13
1971). In India with its large government owned coal industry, the efforts to influence regulation may not be confined only to private industries.
Jenkins & Karplus (2016) note four important political economy constraints that are widely observed: (1) direct constraint on CO2 price level, (2) constraint on the increase in final energy price, (3) constraint
on decrease in energy consumer surplus, and (4) constraint on decrease in fossil producer surplus. Among these, constraints on final energy price and decrease in consumer surplus could be the primary driving factors behind India’s reluctance to implement carbon pricing and subsidization of renewable electricity to keep prices comparable to fossil electricity. In my discussions with the Ministry of Power of India, “affordability” has been cited as one of the three defining dimensions of India’s energy policy, along with “access” and “availability”. With a GDP per capita (PPP) of US$ 6020 in 2015, India ranks 123 in the world (World Bank 2015b), making affordability of not only energy but also energy intensive goods an important political economic consideration while designing policies.
Arguably, more important than affordability is the dimension of energy access. Nearly 19% of the population of India lacked access to electricity in 2015 (IEA 2015). Opting for aggressive climate policies that impose costs on consumers when a large population lives without modern energy raises ethical concerns.12 Further, lack of energy access also leads to productivity loss. The cost of productivity loss can
be compared with the social and/or private cost of providing electricity to meet that demand. We do not cover this analysis in our present work, beyond acknowledging that energy access remains a cornerstone of energy policy design in India, and arguably the most important driving factor behind India’s energy expansion plans.
These political economy constraints on climate change mitigation policies guide my research questions, and inform the modeling structure.
1.2.
Analyzing the Impact of India’s Climate Policies: A Computable General
Equilibrium (CGE) Analysis
The core of this work is based on quantitative analysis of the impacts of India’s energy policies using a General Equilibrium framework. In particular, I develop a computable general equilibrium model of the
12 By the virtue of its widespread impact, climate change undeniably stirs ethical debates in various forms. For
example, Stern (2007) discusses ethical considerations in deciding discount rates for cost-benefit analysis of climate policies. Aggressive climate policies in developing countries with lack of energy access raises similar ethical questions. Is it ethical for the government to cease expansion of cheaper and technologically more reliable thermal power, keeping large portions of current population devoid of modern energy, for benefits accruing to future generations? As political decisions are generally unfavorable towards policies that harm large sections of the public in the short term, the ethical considerations, in essence, lead to political untenability of policies grounded on pure economic efficiency.
14
Indian economy with detailed representation of key industrial sectors, households, and their economic interlinkages. The general equilibrium structure captures feedbacks to changes in prices as they propagate across sectors in response to policy changes, while simultaneously preserving physical detail in the energy system and associated technologies (Wing 2004). Grounded in economic theory of general equilibrium formalized by Arrow & Debreu (1954), this component of my thesis seeks to evaluate relative impacts of different policy paths, benchmarking them against first best policy option of a comprehensive carbon price, simulated as targets on emissions intensity of the GDP, as stated in India’s NDCs.13 I introduce India’s
climate policy targets for 2030 as policy shocks and assess the resulting state of the economy, electricity use, and emissions under different scenarios. Benchmarking policy choices against a comprehensive emission intensity target that achieves similar levels of emissions reduction offers insights into relative efficiencies and impacts of different energy policies.
As argued earlier, energy policies lead to energy price adjustments. Owing to its deep integration in multiple industrial, commercial, and residential sectors, changes in energy prices propagate across multiple markets in the economy. By modeling the complete economic structure with underlying interactions, the general equilibrium approach attempts to enable better understanding of inherent complexities, within the limitations of modeling assumptions. Over time, CGE modeling has gained significant traction with climate policy researchers as a quantitatively rigorous tool for generating policy relevant insights.14
There exists a significant knowledge gap in quantitative assessment of the impacts of India’s climate policies, and particularly of India’s NDCs. Prior work either evaluates the impact of India’s policies through a global general equilibrium setting (Shukla & Chaturvedi 2012), or is based on old data and strong assumptions about India’s energy mix that are not appropriate to inform decision making today (Ojha 2009). This work offers significant improvements on both fronts. Compared to global modeling approaches, modeling India in a single country framework provides greater granularity in specifying country-level details. It facilitates, for instance, disaggregation of India’s economy into domestically relevant sectors. Furthermore, I model technology specifications in electricity production in great detail, laying out seven separate electricity sectors embedded in the economy. The representation of renewable electricity sectors displays careful attention to domestic factors guiding their expansion. Reflecting India’s ambitious solar targets and impressive cost declines, the model’s representation of solar technology includes domestically calculated cost components. Further, I run sensitivity analyses to simulate various wind and solar pricing scenarios. This level of granularity in model specification enables analysis of impacts on energy use in greater detail and helps evaluate policy choices from the perspective of economic efficiency.
13 I discuss in section 2.5 how targets on emissions intensity essentially simulate a comprehensive carbon price 14 See, for instance, the US Global Change Research Program: http://www.globalchange.gov/
15
1.3.
Winners and Losers, and Institutional Challenges to Implementation
Different policy targets lead to differing economic impacts on industrial sectors and consumers, resulting in winners and losers. Policy implementation requires taking into account these stakeholder impacts to ensure level playing field as well as mitigate regulatory capture should powerful interest groups be exposed to negative impacts. Based on modeling outcomes under different policy scenarios and sensitivity analyses, I discuss projected winners and losers, and explore their impact on policy implementation.
Separately, the institutionally and financially weak electricity distribution system of India is widely recognized as the most important bottleneck in improving electricity access and reliability in India (Kumar & Chaterjee 2012; Pargal & Banerjee 2014; IEA 2015). Operationally and financially inefficient utilities have not only constrained electricity growth in India, but also stand to threaten implementation of climate policies. The high aggregate transmission and commercial (AT&C) losses,15 to the tune of 22.70% in
2013-14 (CEA 202013-14), lead to huge efficiency losses as utilities do not get paid for more than a fifth of the electricity they supply. Combined with underpricing of tariffs for political purposes, unmetered electricity supply for rural consumers, and cross subsidies for agricultural and rural consumers, it is hardly surprising that state distribution companies (DISCOMs) are perpetually bankrupt and have to be bailed out every few years (Pargal & Banerjee 2014). The latest installment in such bailout schemes – Ujwal DISCOM Assurance Yojana (UDAY - Ministry of Power (2015)) – recognizes that financial turnaround of DISCOMs cannot be achieved without improving operational efficiencies, and takes several initiatives to that effect.16
Implementation of India’s climate policies thus have to take into account the constraint imposed by the institutional setup of electricity sector.
Building on these fundamental blocks, my thesis thus develops through the following sections. In section 2, I establish the context by outlining the problem of climate change, policy solutions, and political economy challenges that constrain efficient policies. In section 3, I specify the choice of method, describe CGE modeling principles, and subsequently delve in the modeling structure for India, policy scenarios, and sensitivity analyses. I present and interpret the modeling outcomes in section 4. Finally, in section 5, I conclude the thesis by discussing the implications of model outcomes on winners and losers, the interaction of declining wind and solar costs with the climate policies, the institutional challenges to climate policy implementation, and the implications of expanding energy access while mitigating GHG emissions.
15 AT&C losses in India go beyond traditional transmission and distribution (T&D) losses by also accommodating for
losses resulting from theft, non/under-billing, non-payment of bills, and misclassification of subsidized consumers.
16 Such as demand side management, smart metering, adaptive load shedding protocols etc. We discuss these in more
16
Along with filling critical knowledge gap on rigorous and reliable quantitative analysis of India’s energy policy, this work’s importance lies in developing a comprehensive foundation for understanding India’s energy transition. The complexity of issues discussed earlier, and the growing body of literature on second best policies on mitigating CO2 emissions, illustrate the importance of going beyond modeling
outcomes to acknowledge the role of political economic constraints. Besides, policy recommendations should reflect awareness of institutional mechanisms through which they are to be implemented, and acknowledge the winners and losers. This attempt at understanding the electricity sector of India, its transformation through proposed policies within the institutional structure, and interaction with winning and losing stakeholders is a starting step in this direction, with significant scope for expanding on this research in future work.
17
2. Context and Literature Review
2.1.
Climate Change as Multiple Market Failures
The problem of climate change is a classic example of multiple market failures, creating ground for policy action. A close look at the features of climate change outlines the existence of market failures.
First, burning of fossil fuels generates CO2, which is the largest contributor to global warming (IPCC
2014). Traditional fossil fuel prices do not account for the externality costs of climate change impacts of GHG emissions (see, for example, Hoeller & Coppel (1992)). A negative externality occurs when the effect of production or consumption of goods and services imposes costs on others which are not accounted in the prices of those goods and services. In the context of climate change, as discussed earlier, the impacts are widespread both temporally and geographically, and affect vast and potentially unsuspecting populations, both in present and in the future (Stern 2007; IPCC 2014). GHG emissions from burning fossil fuels add to the global GHG stock, lead to rising temperatures, and consequently contribute to climate change events that result in multiple costs that should be accounted in the price of fossil fuels. Examples of externalities include loss of life and property in climate change induced extreme weather events, fall in crop yields,17
and more indirectly, in violent conflicts (IPCC 2014). Besides climate externalities, fossil fuel combustion also adds to environmental pollution. Estimating costs of these externalities is extremely complicated and tedious, and barring carbon pricing policies in certain places,18 fossil fuel prices have by and large ignored
these externalities. In fact, the fossil fuel industry is heavily subsidized in many regions across the world (IMF 2013). Non accounting of these externalities is a major market failure. Termed Social Cost of Carbon, the estimates of these externality costs vary widely.19 It is argued that if properly accounted, they would
raise the price of fossil energy above renewable energy, correcting for the market failure (Epstein et al. 2011).
Second, climate change is a classic collective action problem (Olson 1984) as the effects are spread out across the globe and across multiple generations, while the actions to mitigate and adapt arguably lie with a few disparate institutions and jurisdictions,20 owing largely to their disproportionate contribution to global
17 IPCC (2014) establishes that negative impacts of climate change on crop yields have been more common than
positive impacts. Yields of wheat, maize, rice, and soya bean have been negatively impacted across the world.
18 Examples of countries/regions that have a carbon pricing mechanism in place include certain European nations
(Sweden, Switzerland, Norway, Finland, Denmark, France, Portugal etc.), Tokyo, British Columbia, Ireland, California’s Cap and Trade, EU ETS (including nations from the previous parenthesis), US north-east’s Regional Greenhouse Gas Initiative (RGGI), etc. (Jenkins & Karplus 2016)
19 A review of literature on Social Cost of Carbon (SCC) suggests a median value of $75 per ton of CO
2, with a central
range of $14 to $90, in 2015 USD (Tol 2011; Jenkins & Karplus 2016). The Interagency Working Group of the US government on SCC suggested four different estimates of $12, $43, $65 and $129 in 2007 USD (IAWG 2013). This illustrates the complexity associated with estimating the appropriate SCC.
18
greenhouse gas stock, and negotiating authority derived from global political structures. Olson (1984) specified that in a collective action problem, each individual entity has little incentive to act as the benefits of the action diminish by spreading out across a larger group, and in the context of climate change, are uncertain and accrue mostly to future generations (Nordhaus 1992; IPCC 2014). IPCC (2014) particularly notes the “continuing uncertainty about the severity and timing of climate-change impacts”. That several stakeholders do not see directly perceivable tangible benefits accruing to them makes them reluctant to act. Thus it becomes pertinent to frame policies that drive stakeholders to overcome collective action challenges.
Third, owing to the delayed and distributed impacts of climate mitigation, climate change also poses a classic intergenerational principal agent problem.21 Eisenhardt (1989) discusses two broad categories of
principal agent problem. The first type, agency problem, arises when the desires or goals of the principal and agent conflict and it is difficult or expensive for the principal to verify agent’s actual actions. The second type – the problem of risk sharing – arises when the principal and agent have different attitudes toward risk, owing to which they may prefer different actions. It can be argued that risk perception in the present would differ from that of the future generations as they would face more damaging impacts of climate change22 (IPCC 2014). Thus it is likely that future generations would have demanded stronger
climate mitigation efforts than what are in place now.
Economists argue that appropriate policy measures can be adopted to correct for these market failures, particularly to correct for non-accounting of externalities. Putting an appropriate price on carbon is widely acknowledged as the most efficient policy measure to move away from fossil intensive economies.
Notably, studies also suggest that the tradeoffs in balancing climate mitigation with development objectives tend to be more acute in developing economies. Greenstone & Jack (2015) identify four explanations for the poor environmental quality in developing countries, and argue that these challenges may also seriously undermine efforts to limit climate change. The challenges include (1) high marginal utility of consumption, (2) high marginal costs of environmental remediation owing to weaker institutional capacity, (3) political economy and rent seeking behavior, and (4) market failures and behavioral biases.
2.2.
Carbon Pricing: Addressing Market Failures of Climate Change
There are several pathways for shifting to a less carbon intensive economy. A broad classification could divide mitigation strategies into policy induced behavioral adaptations and technological modifications. However, this is not a strict classification as policy interventions inevitably interact with, facilitate, or
21 In agency theory, the agent is able to make decisions on behalf of, or that impact, the principal.
22 Strong impacts of climate change are already appearing in certain regions. Bangladesh is at the center of attention
for facing existential challenges arising from climate change. Rising sea levels are flooding low lying areas and are expected to inundate 17 percent of the land and displace 18 million people by 2050 (New York Times 2014).
19
restrict technological modifications. For instance, a policy intervention of carbon pricing may induce behavioral change in consumers to move away from carbon intensive commodities that may become expensive. It may also induce technological modifications in efficiency improvements in fossil electricity production, energy efficiency improvements in electronic devices, and innovations in renewable electricity production technologies.
The pathways towards GHG mitigation adopted by countries are officially reflected in their nationally determined contributions (NDCs) adapted under COP 21. While the objective is to limit global temperature rise to below 2oC, studies argue that the NDCs submitted by member countries do not add up to achieve the
target (see, for example, Paltsev et al. (2016)). Jacoby & Chen (2015) discuss several measures, both within and outside the NDC framework, which would be required to limit global emissions growth beyond 2040. These include measures to retire coal fired capacity, improvements in energy efficiency, and reduction in deforestation etc.
Each of these measures have their associated costs. The costs vary significantly across regions and technologies. For instance, it may be more economical to produce the same kilowatt equivalent of solar power in India than in, say, the United Kingdom, owing to India's larger solar endowment. Even within India, geographical distribution of energy resources varies considerably.23 It is a common concern, though,
that most forms of non-fossil energy are expensive than traditional fossil based energy,24 thus necessitating
government support in the forms of subsidies and tax benefits. However, as discussed earlier, a comparison of renewable energy with fossil energy should account for externalities, which significantly add to the cost of fossil energy (see, for example, National Research Council (2000)).
Using taxation to account for externalities has long been recognized as an efficient method. Pigou (1920) is credited for first noting that taxes can help achieve efficiency in the presence of externalities. Pigou argued that negative externalities associated with an economic activity prevent a market economy from reaching an efficient equilibrium, when producers do not internalize all costs of production. If taxes amounting to externalized costs are levied, the negative externality might be corrected. Permit trading is another commonly used instrument in such cases, generally considered as efficient as taxes (Dales 1968). This creates grounds for using price instruments to internalize carbon's externalities.
23 Broadly speaking, the coastal southern and western regions are well endowed with wind, the mountains have
considerable hydropower potential, and although almost the whole country has high solar potential, the dry western and central states are particularly well suited
24 Nuclear and Hydro power are exceptions. However, they have constraints of their own, chiefly political, but also
20
Economists have for long acknowledged the climate externalities of fossil fuels and have advocated for pricing carbon. Pearce (1991) was among the first to emphasize that the uncertainty, irreversibility, high damage costs, and high joint benefits of climate change would require broad based instruments for climate mitigation. Arguing for a carbon tax and tradeable carbon permits as two potential economic instruments, he noted five advantages of a carbon tax: correcting for the environmental externality, double dividend in gaining cooperation of developing countries by recycling revenues, minimizing compliance costs for industries, continuous incentivizing of adoption of cleaner technology and energy conservation, and adaptation of the tax based on new information.
Several previous studies have evaluated climate policies either quantitatively or theoretically. Nordhaus (1992) used an intertemporal general-equilibrium model of economic growth and climate change to estimate the optimal path for GHG reduction, and found a modest carbon tax to be the most efficient approach. Stavins (1997) suggested that for the US a grandfathered tradable permits scheme in the short run and revenue neutral carbon tax in the long run would be preferable. Internationally, he noted the advantages of a global tradable permit system while acknowledging that no existing institution could run this system. Quite presciently, Stavins contended that the strength of “domestic political barriers” should not be underestimated in hindering the theoretical advantages of carbon pricing mechanisms. More recently, in a widely discussed study, Stern (2007) argued for a carbon price as an “essential foundation for climate-change policy”, and discussed establishing a common global carbon price. Metcalf & Weisbach (2009) discussed designing a GHG emissions tax for the United States and argued for adjustments to income tax to ensure revenue and distribution neutrality.
In the economic modeling approach taken in this study, the two widely accepted pricing instruments of tax and permit trading are functionally equivalent.25 Importantly, in a general equilibrium modeling
framework, an emissions intensity target essentially represents a permit trading regime with emission levels indexed to economic output. An emissions intensity target will be most efficient if it is implemented along a marginal abatement cost curve, and a CGE modeling framework enables implementing emissions intensity target in this manner.
How does carbon pricing work? Assume an upstream carbon tax applied to three fossil fuels (coal, petroleum, and natural gas) at their entry in the economy (Aldy & Stavins 2012). As the fuel suppliers, essentially coal mining and upstream oil and gas companies, face a tax, they would raise the price at which they supply fuel to the market. This price increase will propagate through the energy system, and incentivize
25 Weitzman (1974) is widely considered a seminal work on deciding between price versus quantity instruments when
political considerations or market failure necessitate government intervention. For other discussion on instrument preference, see Aldy & Stavins (2012), (Metcalf 2007), Parry & Pizer (2007), Pizer (2002).
21
shifts to low carbon technologies and investments in energy efficiency improvements. To be cost effective, the tax should cover all sources of fossil fuel production. Besides, to achieve efficient outcomes, the tax rate should be set equal to marginal benefits of emission reduction as represented by estimates of the SCC (Aldy & Stavins 2012; IAWG 2013).
Thus an appropriate carbon price can correct for externality costs of fossil consumption. Further, a carbon price may also partly address the collective action problem, but the interaction is complex. In the absence of a carbon price, energy producers and consumers have little incentive to shift away from a fossil base, as the transition costs would be direct but the mitigation benefits widespread and disparate. An appropriate carbon price would be expected to make fossil energy more expensive than non-fossil, directly incentivizing energy consumers to shift base. Falling demand and price competitiveness would also make production of fossil energy less profitable, incentivizing a shift on the supply side. However, the immediate costs of high fossil energy prices on consumers and declining profits for large concentrated producers make it difficult to introduce a carbon price in the first place.
While the efficiency of a carbon price in addressing multiple market failures is well established, actual climate mitigation policies shy away from price instruments and rather include a multitude of technology and policy interventions.26 Even where carbon pricing exists, the prices are typically far lower than price
estimates required to fully internalize the marginal cost of climate change. Jenkins & Karplus (2016) explain the remarkable lack of support for widespread carbon pricing by citing political economy constraints. A discussion of political economic factors influencing climate policies is important for this thesis as India, too, has a patchwork of diverse climate policies instead of an economy-wide carbon tax.
2.3.
Political Economy Constraints on Carbon Pricing: Rationale for Multiple
Policy Instruments
One rationale for existence of multiple policies on GHG mitigation stems from the theory of the second best which concerns with the non-attainment of a Pareto optimal outcome in a general equilibrium system, owing to the presence of one or more constraints (Lipsey & Lancaster 1956). In the presence of these constraints, the attainment of other Pareto optimal conditions is no longer necessarily welfare improving. Stated differently, if multiple constraints prevent the fulfillment of multiple Pareto optimum conditions, removing one of the constraints is not necessarily welfare improving. The implication of second best theory for climate change originates from the presence of multiple market failures that hinder Pareto optimum outcomes of carbon pricing.
22
Initial studies into the implication of the theory of second best for climate change looked at the interaction between existing “distortionary” labor and capital taxes and a carbon pricing scheme. Goulder et al. (1999) examine the second best setting of the effect of pre-existing distortionary factor taxes on multiple climate policy instruments, including carbon tax, technology mandates, performance standards, and fuel taxes. Particularly on carbon tax, they discuss two opposing welfare effects. First, carbon tax raises the prices of goods compared to leisure, compounding the factor-market distortions of pre-existing taxes. This negative welfare impact is termed “tax-interaction effect”. Second, the tax revenues can be recycled through cuts in marginal tax rates to reduce the distortions caused by pre-existing taxes. This results in a positive welfare effect, termed “revenue-recycling effect”. Using analytical and numerical general equilibrium models, they find that pre-existing taxes raise the cost of abatement under each instruments, relative to the cost in no-prior-tax world. The tax interaction effect is partly offset by revenue recycling, but overall impact is an increase in abatement costs.
In a similar analysis, Parry & Williams (1999) employ a numerical general equilibrium model in a second best setting with distortionary labor taxes, and compare costs of alternative carbon emissions mitigation policies. The specific instruments they analyze include a carbon tax, two energy taxes, and narrow based and broad based emissions permits and performance standards. Similar to Goulder et al. (1999), they find that pre-existing taxes raise costs of these instruments. In particular, they establish that the efficiency of carbon pricing instruments (both taxes and permit trading) in a second best setting depends on the extent of revenue recycling.
Bennear & Stavins (2007) offer theoretical justification for supporting a mix of policy instruments in a second best setting. They contend that the existence of multiple market failures in a second best world leads to constraints on the general equilibrium setting that justify policy coordination and use of multiple instruments on economic grounds. As environmental policies are usually executed in second best settings, employing multiple policy instruments may be justified. However, the authors note that there is little clarity on whether the actual mixes of implemented instruments are the economically efficient ones.
Jenkins (2014) formalizes certain key political economy constraints that bind climate policymaking and create “opportunity space” for combining policy instruments to achieve a second best optimum. In particular, Jenkins (2014) notes political economy constraints influencing producer and consumer behavior. On the producer side, industrial sectors with high asset specificity would likely oppose instruments that may require moving the assets (Murphy 2002). Insofar as policy instruments affect a concentrated group of economic agents (for example, large industries), regulatory capture for serving vested interests is likely (Stigler 1971). On the consumer end, as discussed earlier, collective action and principal agent problems pose constraints on implementing an appropriate carbon price that reflects the true social cost of carbon.
23
Certain recent works offer quantitative evidence suggesting that a sub-optimal mix of technology and pricing policies can keep ambitious emissions targets within reach. Bertram et al. (2015) employ an integrated energy-economy-climate model to analyze a mix of three policies: (1) a carbon price starting at US$7 per tonne of CO2 in 2015 (significantly lower than the authors’ quoted optimal carbon price falling
between US$16 – US$73 per ton), (2) support for low-carbon technologies, and (3) a moratorium on new coal based power plants. While this policy mix is sub-optimal in achieving emissions reduction as compared to the optimal comprehensive carbon price, it is politically more palatable. They find that such a policy mix limits efficiency losses and lowers distributional impacts, while also building on policies already implemented in several countries, enhancing its political feasibility compared to a comprehensive carbon price.
Jenkins & Karplus (2016) employ a stylized partial equilibrium model of energy sector to study welfare impacts of combining carbon pricing with revenue recycling to address political economic constraints. They evaluate recycling carbon pricing revenues to subsidize clean energy and offset welfare loss of both producers and consumers, and find that this may lead to optimal first best carbon price levels. This suggests that a comprehensive policy package that accommodates interests of disparate stakeholder groups may be preferable, as it allows achievement of an optimal carbon price at lower welfare losses to specific groups or interests, motivating our analysis of alternative policy instruments.
As we would see in the next section, India offers additional unique political economic challenges along with the ones discussed so far. While this explains the patchwork of energy and climate policies, the arguments above suggest that any analysis of India’s energy policies should give serious consideration to political economy, and not restrain itself to a study only of theoretically optimal carbon pricing.
2.4.
India: Economy, Electricity Sector, and Access Issues
India is the second most populous country in the world, with a population of 1.252 billion as of 2013. A GDP of US $7.998 trillion (purchasing power parity) makes India the third largest economy in the world (World Bank 2015c). However, given the large population, GDP per capita (PPP) falls to US $6,101, putting India at 123rd position internationally (World Bank 2015b). The Indian economy is largely constituted of
services sector (59%), followed by industry (27%) and agriculture and allied sectors (14%) (Planning Commission 2014). Among industries, certain energy intensive sectors within manufacturing are important contributors. In particular, iron and steel, cement, and petroleum and petrochemicals are major contributors to industrial output.
As of October 31, 2016, India had a total installed power generation capacity of 307.278 GW, fourth largest in the world after China, USA, and Japan. In recent years, the generation capacity has grown
24
impressively, averaging 6.5% per year between 2009 and 2015. At the same time, due to significant existing unmet demand as well as rapid increase in demand, capacity additions have not been able to bridge the gap between requirement and availability, leading to supply being 2.1% short of demand, in financial year April-2015 to March-2016 (CEA 2016). Besides, this does not include the lack of access to electricity to a large section of the population. The actual shortfall could thus be significantly larger.
2.4.1. Electricity Production Mix
The electricity production mix is dominated by coal, followed by hydropower and renewables (Figure 1). While the installed capacity of coal is 61%, it had a 75.6% share in actual generation, compensating for the low plant load factors of hydropower and renewables (CEA 2015). India’s electricity targets reflect a strong commitment to renewables going forward. India’s NDCs submitted to COP21 note that 40% of installed electricity capacity in 2030 would be through non-fossil sources (GoI 2015a). Besides, the National Solar Mission of India targets expanding solar base to 100GW by 2022 (from current capacity of 12.288 GW, as of March 2017). These policy targets reflect strong commitment to technology specific choices for climate mitigation and must be considered in the analysis of India’s energy policies.
2.4.2. Transmission, Distribution, and Commercial Losses
A major problem with Indian electricity sector is the extremely high losses between source and sink. The Transmission and Distribution (T&D) losses amounted to 23% of electricity generated in FY 2012-13 as compared to 6% in the US and 8.1% worldwide (CEA 2015). Further, India also estimates Aggregate Transmission and Commercial (AT&C) losses, mainly accommodating for losses resulting from theft, non/under-billing, non-payment of bills, and misclassification of consumers in the subsidized category. The AT&C losses were 25% in 2012-13 (CEA 2015). For comparison, India’s AT&C losses amounted to 31% in FY2010-11 as compared with South Korea (4%), Japan (5%), Brazil (17%), China (5%), and Indonesia (10%). The total losses are estimated to be about 1.5% of India’s GDP (IEA 2012). These losses distort the complete value chain of electricity and are considered a major bottleneck in expanding electricity access. I argue in section 5.3, how these operational challenges not only make the electricity sector highly inefficient, but may also hinder implementation of climate policies.
25
Figure 1: India Energy Mix as of 31-March-2015 (CEA 2015)
2.4.3. Growth Projections
The growth projections published by the International Energy Agency (IEA) under New Policies Scenario (NPS) point to sustained increase in India’s energy demand. The New Policies Scenario take into consideration policy commitments and plans of governments, and not necessarily the existing capability to enact those plans (IEA Website). IEA forecasts that electricity demand in India would rise by an average of 4.9% per year, and would more than triple from 900 TWh in 2013 to almost 3300 TWh by 2040. Further, India would account for almost 17% of the increase in global electricity demand in this period, an amount that’s “roughly equivalent to today’s power consumption in Japan, Middle East and Africa combined”. Although per capita consumption will reach more than 2000 kWh per year, it would still remain well below the world average in 2040. The unmet demand in electricity, which IEA roughly estimates to be equal to the current load shedding, is expected to disappear by mid-2020s. However, this may not be a good estimate, given the low rural electricity access discussed later. Overall, the increase in demand of various sectors over the projection period is shown in Figure 2 below.
0 10 20 30 40 50 60 70 80
Percentage of Gross Electricity Generation
0 10 20 30 40 50 60 70
Percentage of Installed Electricity Capacity
26
Figure 2: Electricity Demand by Sector in India in the New Policies Scenario. Source: IEA India Energy
Outlook - World Energy Outlook Special Report 2015
IEA (2015) forecasts that India would make impressive progress in energy access reaching universal urban energy access by mid-2020s. However, there would still be nearly 60 million people in rural areas without electricity in 2030 (Figure 3). Given the poor financial condition of state DISCOMs, which are responsible for building rural distribution networks, and also the difficulty in recovering costs of rural electricity consumption (Maithani & Gupta 2015), universal access would continue to be a challenge.
Figure 3: Population without access to electricity and electrification rate in India in the New Policies
Scenario. Source: IEA India Energy Outlook - World Energy Outlook Special Report 2015
The projected demand increase corresponds with projected increase in capacity, expected to grow from current 281 GW to 1075 GW in 2040, which is roughly equal to the current installed capacity in European Union. Further, coal will continue to dominate, reaching almost 440 GW by 2040, and possibly making India the second largest coal fleet country after China.
27
2.4.4. Electricity Act of 2003
The electricity sector in India has historically been plagued by several institutional problems that curtailed expansion. Electricity falls under concurrent subjects in India’s constitution, with shared power between central and state governments, further complicating reforms. Nevertheless, a widely recognized need for strong institutional reforms lead to the Electricity Act of 2003 that aimed to make electricity sector competitive, transparent, investor-friendly and consumer-centric (Kumar & Chaterjee 2012). Certain major reforms included:
Unbundling the monopolies of State Electricity Boards in separate generation, transmission, and distribution companies27
Delicensing of generation and complete freedom and open access for captive generation
Introducing competition in the distribution sector by the provision of multiple distribution licensees in the same area
Institutionalizing short term electricity markets and trading
Introducing Tariff Policy in 2006 with several forward looking changes, such as: procuring generation capacity and transmission services from the private sector only through tariff based competitive bidding, preferential tariff for renewable generation, reduction in cross subsidization of agricultural and rural consumers through industrial consumers
These reforms have arguably made the electricity sector competitive and lucrative to the private sector, particularly in generation. The share of private power generation has been steadily rising, reaching nearly 40% in 2014 (Figure 4). Besides, almost all investment in renewables in India over the previous decade, particularly in wind and solar, has been private (Kumar & Chaterjee 2012). Several targeted policies, such as renewable purchase obligations (RPOs),28 renewable energy certificates (RECs),29 along with subsidies
and other forms of transfers are in place to facilitate investment in renewables. As last mile connectivity, especially in remote rural areas, continues to be challenging, standalone systems and microgrids have gained traction along with relevant support policies (Maithani & Gupta 2015).
27 The unbundling has arguably been ineffective in several states which have formed holding companies with complete
control and common management over the transmission as well as distribution utilities (Kumar & Chaterjee 2012).
28 RPOs aim to increase the demand for renewable energy by obligating distribution utilities to procure a percent of
their electricity from renewable sources.
29 REC mechanism aims to account for the differences in renewable capacities of the states, and consequently, their
differing abilities and costs to decide and achieve renewable purchase obligations. RECs provide a market mechanism to overcome “geographical constraint of renewable energy resources” (Kumar & Chaterjee 2012).
28
Figure 4: Power generation capacity by type of ownership in India
2.4.5. Low Electricity Access and Per Capita Consumption
An important energy policy challenge in India is the low levels of electricity access, particularly in rural areas. Several schemes over previous decades have focused on 100% rural electrification, always missing the target. While around 95% of the villages nationwide have been ‘electrified’, the weak definition of electrification can be misleading.30 A better indicator is percentage of electrified rural households, which is
as poor as 10% in Bihar and 24% in Uttar Pradesh. The total number of individuals without electricity access in 2015 was 240 million (IEA 2015).
Besides, while supporting around 16 per cent of the world population, India’s share in world electricity consumption is only 3.5 per cent (Maithani & Gupta 2015). This reflects in low annual per capita consumption of 1010 kWh, which is a third of world’s average (CEA 2015). Wide disparities between states in India lead to varying per capita consumption across the country. Owing to the differences in demographics, income levels, resource and industrial base, and also due to electricity being a concurrent subject with responsibility shared between central and state governments, these disparities are striking and important. For instance, Figure 5 shows the variations in per capita residential electricity consumption across states. The annual per capita consumption of nearly 50 kWh in Bihar amounts to an average household use of a fan, a mobile telephone, and two compact fluorescent lamps for less than five hours per day (IEA 2015).
30 A village is said to be electrified when “basic infrastructure is provided to the inhabited locality as well as the dalit
basti/hamlet, electricity is provided to public places, and at least 10 per cent of the total number of households are electrified” (Maithani & Gupta 2015).