HAL Id: hal-01837466
https://hal.archives-ouvertes.fr/hal-01837466
Submitted on 3 Jun 2020
HAL is a multi-disciplinary open access archive for the deposit and dissemination of sci-entific research documents, whether they are pub-lished or not. The documents may come from teaching and research institutions in France or abroad, or from public or private research centers.
L’archive ouverte pluridisciplinaire HAL, est destinée au dépôt et à la diffusion de documents scientifiques de niveau recherche, publiés ou non, émanant des établissements d’enseignement et de recherche français ou étrangers, des laboratoires publics ou privés.
Micromechanical features of jet erosion - A numerical
perspective
Pablo Cuellar, L.-H. Luu, P. Philippe, Florian Brunier-Coulin, Nadia
Benahmed, Stéphane Bonelli, Jean-Yves Delenne, Jeff Ngoma
To cite this version:
Pablo Cuellar, L.-H. Luu, P. Philippe, Florian Brunier-Coulin, Nadia Benahmed, et al.. Microme-chanical features of jet erosion - A numerical perspective. 8. International Conference on Scour and Erosion, Sep 2016, Oxford, United Kingdom. 2016. �hal-01837466�
1 INTRODUCTION
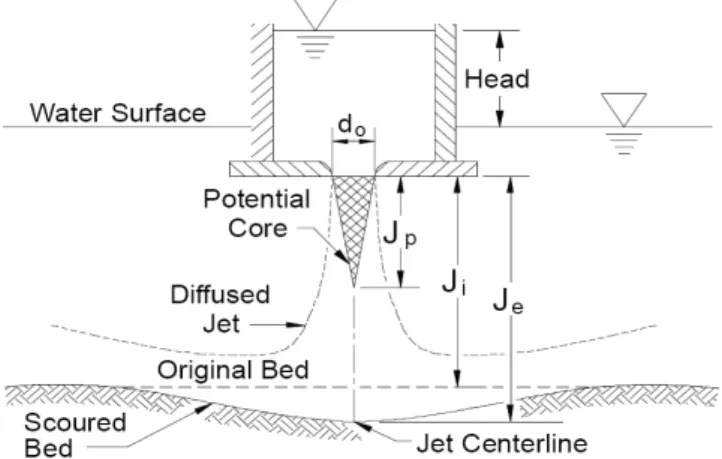
The earthen hydraulic civil constructions such as earth-dams and levees are often affected by a partic-ular form of erosion caused by the flow of water over their surface, the so-called surface erosion (Foster et al. 2000). Other kinds of (internal) erosion such as piping, suffusion or contact erosion may also take place (Fell & Fry 2007), but involve different mechanisms and lie out of the scope of this paper. Several experimental procedures and devices have been developed for the general assessment of the sensitivity of granular materials like soils to the oc-currence of surface erosion, among others the Jet Erosion Tests (JET) and the Hole Erosion Test (HET) (Hanson & Cook 2004; Benahmed & Bonelli 2012). The JET has received much attention and gained broad acceptance due to the relative simplici-ty of the experimental setup (Figure 1) and the pos-sibility of performance of tests in-situ by means of portable JET devices (Hanson & Cook 2004).
The so-called erodibility parameters are widely used to quantify the likelihood and magnitude of the erosive degradation in terms of, on the one hand, the critical threshold of hydrodynamic shear stress (τc)
for the initiation of erosion and, on the other hand, an erosion modulus (kd) that relates the rate of
ma-terial erosion to the hydrodynamic conditions at the eroded surface (Hanson & Cook 2004). A conve-nient and widely accepted form (though also contro-versial, see the recent discussion in Walder 2015) of
the erosion law can be then written in the following linear fashion:
for (1)
where E is the erosion rate and τ is the hydraulic shear stress. Therefore, the evolution of erosion is this way described in terms of solely one variable, the often elusive shear stress at the eroded surface, which is a quantity averaged over time and space that should represent the hydrodynamic conditions at the fluid-solid interface. This is of course a very rough simplification of the complex conditions at the surface under an impinging jet, where actually the shear stress should be zero right at the stagnation point.
Figure 1. Conceptual sketch and relevant magnitudes of the Jet Erosion Test, taken from (Hanson & Cook 2004).
Micromechanical features of jet erosion - A numerical perspective
P. Cuéllar, L.-H. Luu, P. Philippe, F. Brunier-Coulin, N. Benahmed and S. Bonelli
IRSTEA, UR RECOVER, Aix-en-Provence, France
J.-Y. Delenne
UMR1208 IATE, INRA/CIRAD/Montpellier Supagro/Université de Montpellier, France
J. Ngoma
Institut Jean Lamour, CNRS - Université de Lorraine, Nancy, France
ABSTRACT: The erosion mechanisms driving the particle detachment of a soil under an impinging jet are here analysed from a micromechanical perspective combining the numerical Discrete Element and Lattice Boltzmann methods (DEM-LBM). Firstly, the local hydrodynamic conditions of both free and impinging jets are examined and briefly discussed, particularly on the relevance of the superficial irregularities of the granu-lar assembly, which can dominate the local distribution of hydrodynamic variables over the impingement area. Profiles of both macromechanic and discrete (micromechanic) variables will be put forward. Then, the onset of erosion is reviewed from a topological point of view (locality of first grain motion) on the basis of a parametric study. Finally, the variation of the critical inflow velocity for the initiation of erosion in depen-dence on the particle size is also examined and briefly discussed.
The aim of this paper is therefore to provide an insight into the local hydrodynamic conditions at the onset of jet erosion from a micromechanical pers-pective. For this purpose, an efficient numerical model that considers the fluid-solid interactions at the micro-scale (see also Cuéllar et al. 2015) is here introduced. Then, the local hydrodynamic variables at the surface are examined and the results from a preliminary parametric study varying the grain size and the jet's inflow velocity are discussed.
2 NUMERICAL TECHNIQUES
The approach adopted here combines the computa-tional efficiency of the Lattice Boltzmann Method (LBM) for the fluid analysis with the relative sim-plicity of the Discrete Element Method (DEM) for the consideration of the solid particles. The field of applications of this combined technique already covers a wide spectrum of geomechanical problems (see e.g. Mutabaruka et al. 2014, Sibille et al. 2015, Ngoma 2015).
2.1 Fluid dynamics
The fluid dynamics are described here by means of a two-dimensional scheme of the lattice Boltzmann method, namely the so-called D2Q9, which is an ex-plicit finite difference scheme of the continuous Boltzmann equation (Succi 2001, Lallemand & Luo 2003). The LBM involves the definition of a Carte-sian lattice grid in the space and a discrete set of probability density functions and velocities of fluid particles at each grid point. The fluid dynamics arise then as the result of two basic steps: the collision and advection of the fluid particles following a set of rules aiming to ensure the conservation of mass, momentum and energy (i.e. the incompressible Navier-Stokes behaviour). However, some restric-tions apply and this scheme only holds for very low Mach numbers, i.e. when fluid velocity is much lower than the lattice speed. All in all, the fluid phase is fully defined by specifying a lattice grid size Δx and a lattice speed cs, the components sα of
the diagonal relaxation matrix S (inverse of the dif-ferent relaxation times) and the fluid material para-meters of density ρf and kinematic viscosity ν.
Fur-ther details of the employed formulation (multi-relaxation time type) can be found in (Cuéllar et al. 2015) and in the references contained therein.
2.2 Solid mechanics
The solid phase is introduced here by means of a discrete element model of the granular soil based on the classical Molecular Dynamics method pioneered by Cundall & Strack (1979). This way, the soil is represented by a two-dimensional assembly of circu-lar particles accounting for the soil grains, whose trajectories are computed by simple integration of
Newton’s equations of motion. A great number of modifications of the smooth inter-particle contact and friction laws of the original model have been proposed in the past, in particular concerning the in-troduction of cohesive interactions between particles (see e.g. Delenne et al. 2004, Richefeu 2005, Jiang et al. 2013). Here, and for the sake of concision, on-ly the rheological mechanisms for the description of a frictional granular material without cohesion will be considered, while the more complex case of a granular material with inter-particular cohesive bonds will be discussed in a forthcoming publica-tion.
The interaction between two particles is thus for-mulated in terms of an interaction force F and an in-teraction moment M applied at their common contact point. The interaction force is thereby decomposed into its normal and shear components, Fn and Fs
re-spectively, corresponding to the normal and tangen-tial directions at the contact. The normal force Fn is
here described in terms of the local interpenetration
δn by means of a classical Kelvin-Voigt viscoelastic
relationship defined by the normal stiffness and damping coefficients, kn and ηn. On the other hand,
the shear force arising at the frictional (non-cohesive) contact is defined here by a viscous-regularized Coulomb law (Richefeu et al. 2008, Schaefer et al. 1996) characterized by the static fric-tion coefficient μ and the viscous coefficient of shear regularization ks. This way, the shear force is
com-puted in terms of the sliding velocity s, which in
practice does not preclude the consideration of static friction, since this variable never really vanishes. Due to the small time steps considered here (in the order of 10-6 s), the quasi-static equilibrium under static friction is reached in the short term through re-sidual micro-slips. Finally, the interaction moment acting on each particle’s centre is defined by the shear force with the particle’s radius as lever arm and a rolling friction component that restrains the rolling motion of the particles (relative rotation without sliding). The latter can be described analog-ous to the shear friction in terms of the relative ve-locity of rotation, a rolling friction coefficient μω and
a coefficient of regularization kω (Richefeu 2005,
McNamara 2011).
2.3 Solid-fluid coupling
The fluid-solid interaction, i.e. the coupling between the fluid and solid phases and the computation of the hydrodynamic forces on the discrete particles, is dri-ven here by the momentum-exchange method pro-posed by Bouzidi et al. (2001), which relies on a ge-neralized bounce-back rule for the fluid particles and a linear interpolation strategy for arbitrary geome-tries in the LBM. On the other hand, the sub-cycling
time (200 of ti gene discr for e in or hydr to ov two-dens geom ing t equiv al. 2 3 JE Let deriv scrib diam ducin axis Fig. Figur and c T cal p been usua hens T Pa Po Le He Pa No Sh Ro Fri integration 07) has been ime steps r erally much rete solid ph each LBM rder to pre rodynamic f vercome the -dimensiona sely packed metrical red the drag fo valent cylin 011, Cui et ET HYDRO us now ex ved by the bed fluid ve metre b), and ng a granu and located 2). re 2. Spatial d ontrol section The arbitrary parameters n chosen e al values fro sive review Table 1: Geo article mean olydispersity ength of gran eight of gran article densit ormal contac hear contact olling stiffne iction coeffi n technique n used to ex equired for h larger tha hase. The n step was n serve the a forces on th e inherent l ality to th assembly o duction fact orces around nder with a al. 2012). ODYNAMI xamine the considerati elocity at th d then obse ular surface d at a distan disposition of n for fluid vari
y geometric employed f either for c om the litera in Luding 2 ometrical, m Soli size, Dmean y, Dmax / Dmin nular sample nular sample ty, ρs ct stiffness, stiffness, ks ess, kω icients, μ=3 e proposed xploit the fa r the fluid an that nec number of D evertheless accuracy of he solid par imitations i he fluid flo of particles tor was em d a sphere a reduced ra CS hydrodynam ion of a fre he injection erve the infl perpendicu nce H from
granular asse iables.
cal, materia for these sim convenience ature (see e 2008) and a material and id phase 3 x n 1.5 e, L 2.6 e, Hs 8 x 223 kn 1.1 1.1 0.1 ·μω 0.3 by Feng e act that the computatio cessary for DEM subcy restricted t f the compu rticles. In or imposed by ow through , a “hydrau mployed ma to those of adius (Bout mic conditi ee jet with p nozzle (noz luence of in ular to the j the nozzle mbly, jet’s no l and rheol mulations h e or based .g. the comp are summari model para x 10-3 m 5 63 x 10-1 m x 10-2 m 30 kg/m3 1 x 10⁵ N/m 1 x 10⁵ N/m 1 x kn 3 et al size n is the ycles to 2 uted rder y the h a ulic” atch-f an tt et ions pre-zzle ntro-jet's (see ozzle ogi-have d on pre-ized in scri num from 3.1 The out com ana pro stan cas cas bas tion ty u 2D 2D 3D w and the T diff wit ure vel rou due F file and wel aga the seu the lap ameters for Jet’ Jet’ Kin Flui Latt Latt Hyd Inle Table 1. T ibed as an mber Rej ~ 6 m a laminar Free jet co e particular t obstacles, mputational alytical solu oposed by s nce Bickley e of plane e of a roun sed on the n of the flui um as follow Poiseuille i uniform in round, unif where h is d λ is the n self-similar The compu fusive but th the analy e 3) and lie ocity of th und jet, whic
e to the jet d Figures 4 a es perpendic d normalise ll the hypot ation. It can nozzle is h uille shape self-simila se in the no the presente s distance to s nozzle size nematic fluid id density, ρ tice grid size tice speed, c draulic radiu et fluid veloc The corresp inertial la 60 to 100), r to a turbul onditions. Se case of a f permits an model by c utions of th several auth y 1937 and jets or Tr nd 3D jet). assumption id jet and pr ws (Badr 20 inlet: let: form jet: the axial d nozzle distan r jet (Badr 2 uted numeri nevertheles ytical Poiseu e, as expect e 2D unifo ch suffers a diffusion in and 5 show cular to the ed fashion r thesis of sel n be noted here prescrib and it thus ar shape w ormalised di ed simulatio Fluid p o surface, H e, b d viscosity, ν ρf e, Δx cs us factor, Rh city, uj ponding flo aminar one i.e. a flow lent regime. elf-similarit
free jet, i.e. n implicit v comparing t he Navier-S hors in the p d Schlichtin ritton 1988 Such analy n of a self-s rovide its c 14, Phares e ⁄ . / distance to nce to the 2014). ical results ss show a uille plane-j ted, betwee orm jet and a stronger d all three dim the comput jet's axis, i respectively lf-similarity that the ve bed with th s necessarily here the ot iagram. ons phase H 7 x 5 x ν 5 x 84 2.3 10 0.8 (0. ow may be (jet's Reyn in the trans . ty a fluid jet w validation o the results t Stokes equa past (see fo ng 1960 fo for the ge ytical model similar prop entreline ve et al. 2000): / / / / / / ⁄ / the jet's n virtual orig are a bit o fair agree et solution en the centr d that of th decay of vel mensions. ted velocity in a dimens y, confirmin y of the jet p elocity prof he parabolic y deviates ther results x 10-2 m x 10-3 m x 10-5 m2/s 7 kg/m3 3 x 10⁻⁴ m m /s 8 .45-0.8) m/s e de-nolds sition with-of the to the ations or in-or the eneral ls are paga- eloci-: (2) (3) (4) ozzle gin of overly ement (Fig-reline e 3D locity y pro-sional ng as prop-file at c Poi-from s
col-Figure 3. Centreline fluid velocity of a free jet. Comparison of numerical results (black solid line) with the analytical solutions for a 2D jet with uniform inlet (green triangles), a 2D jet with Poiseuille inlet (blue squares), and a 3D round jet (red circles).
Figure 4. Horizontal profiles of fluid velocity of a free jet at several heights (reference: height of nozzle at y=0).
The variable adopted for normalisation of the radial distance is here the velocity half-width bu
pro-posed by Schlichting (1960):
/ 3.20 / / / (5)
3.2 Impingement on a fixed granular surface
Now let us proceed with the introduction of a solid fixed (non-erodible) wall with an irregular surface (granular profile) at a certain distance H from the jet's nozzle and perpendicular to its axis. Figure 6 shows the fluid velocity field and the jet's deflection at the solid surface. The flow is confined between the solid surface and the upper, closed boundary, while the lateral boundaries have been left open, and so the appearance of two convective cells can be ob-served.
Figure 5. Normalised profiles of fluid velocity of a free jet. Ba-sis for normalisation in the ordinates and abscissae are the cen-treline velocity um(h) and the velocity half-width bu(h)
respec-tively.
A closer inspection of the centreline velocity (Figure 7) shows now the appearance of a stagnation point (zero velocity) right at the solid surface and its consequent modification of the velocity axial profile, in fair agreement with the experimental trend de-rived by Beltaos & Rajaratnam (1977) for the jet ve-locity close to a solid wall, valid for 0.75 ⁄ 1 :
5.5 1 ⁄ ⁄ (6)
Figure 6. Fluid velocity field of the jet's impingement on a fixed irregular surface. Arrow marker size is proportional to the velocity magnitude at each point.
0 0.1 0.2 0.3 0.4 0.5 0.6 0.7 0 0.05 0.1 0.15 0.2 Je t's c en tr elin e ve lo city , um [m /s ]
Distance to jet's nozzle, h [m]
Simulated, plane free jet Analytical, 2D jet, uniform inlet Analytical, 2D jet, Poiseuille inlet Analytical, 3D round uniform jet
0 0.1 0.2 0.3 0.4 0.5 0.6 0.7 0 0.005 0.01 0.015 0.02 F lui d ve lo ci ty , u [ m /s ]
Radial distance to jet's axis, r [m]
Nozzle, y = 0.0 m y = - 0.005 m y = -0.010 m y = -0.015 m y = -0.020 m y = -0.030 m y = -0.040 m y = -0.050 m y = -0.075 m y = -0.100 m y = -0.150 m 0 0.1 0.2 0.3 0.4 0.5 0.6 0.7 0.8 0.9 1 0 1 2 3 4 N or m alis ed f lu id v elo city u /um [-]
Normalised radial distance, r/bu[-]
Nozzle, y = 0.0 m y = - 0.005 m y = -0.010 m y = -0.015 m y = -0.020 m y = -0.030 m y = -0.040 m y = -0.050 m y = -0.075 m y = -0.100 m y = -0.150 m
Figure 7. Computed centreline velocity of an impinging jet as compared to the free jet (red circles) and the experimental trend derived in (Beltaos & Rajaratnam 1977) (cross markers).
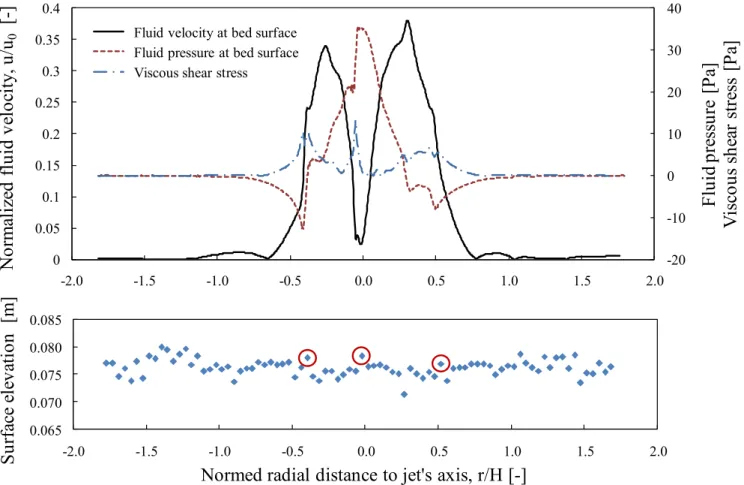
Now it is interesting to examine the profiles of fluid velocity, pressure and shear stress right over the solid surface, in particular taking into account the irregular profile of the granular assembly (Figure 8). The characteristic "M"-shape profile of fluid ve-locity with the stagnation point right under the jet's axis and its complementary maximum of fluid pres-sure can be appreciated in the figure. However, the maxima of shear stress, as well as the highest
pres-sure gradients, are located actually right on the spots of the most prominent grains (the most exposed ones) of the irregular surface, marked with red cir-cles in the lower diagram of Figure 8. Therefore, it appears that the topology of erosion, at least at its onset, can be dictated by the irregularities of the sur-face in the relevant impingement area, approximate-ly in the range (-H, H) of radial distance from the jet's axis.
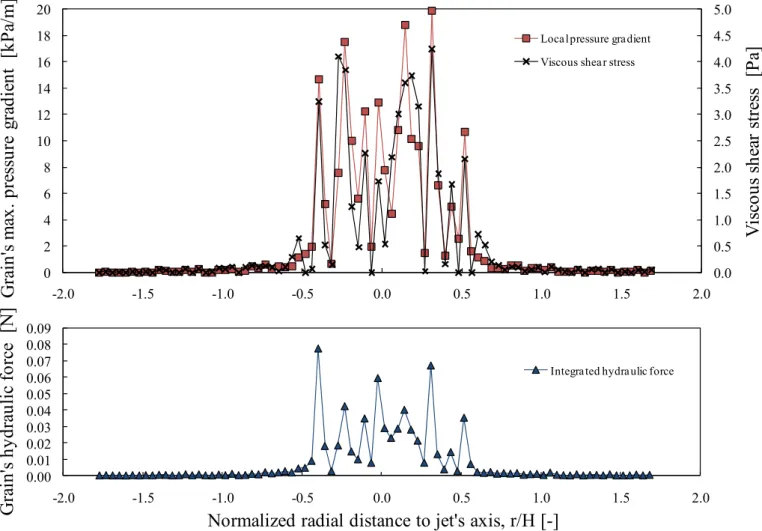
The employed numerical model has the advan-tage that it can provide access to a number of in-sightful micromechanical variables (i.e. at the grain scale). The lower diagram of Figure 9 shows the in-tegrated hydraulic force acting specifically on each grain at the surface, while the upper diagram por-trays the estimated maximum pressure gradients and shear stresses taking place directly around the solid particles (a refined calculation of these magnitudes is on course and shall be published in due time). It can be noted that the hydraulic force is obtained as the integral of the momentum exchange between flu-id particles and the grain's surface (thus computed from an explicitly micromechanical point of view), whereas the pressure gradients and shear stresses are derived from macroscopic magnitudes of fluid pres-sure and velocity with a posterior identification of their maxima around the discrete particles. It seems therefore appropriate to highlight the apparent strong correlation between these three variables.
Figure 8. Upper diagram: Profiles of fluid velocity (solid line), pressure (red dashed) and shear stress (blue points and dashes) right above the granular surface. Lower diagram: Discrete profile of surface elevation of the granular assembly (prominent grains within the relevant impingement area highlighted with red circles). All profiles obtained at time t=8 s of the transient simulation.
0 0.1 0.2 0.3 0.4 0.5 0.6 0.7 0 0.02 0.04 0.06 0.08 Je t's c en tr elin e ve lo ci ty , um [m /s ]
Distance to jet's nozzle, h [m]
Simulated, plane free jet
Simulated, solid wall at 73 mm from nozzle Exp. trend [Beltaos & Rajaratnam, 1977]
-20 -10 0 10 20 30 40 0 0.05 0.1 0.15 0.2 0.25 0.3 0.35 0.4 -2.0 -1.5 -1.0 -0.5 0.0 0.5 1.0 1.5 2.0 F lui d pr es su re [ P a] V isc ou s sh ea r st re ss [P a] N or m aliz ed f lu id v elo city , u /u0 [-]
Fluid velocity at bed surface Fluid pressure at bed surface Viscous shear stress
0.065 0.070 0.075 0.080 0.085 -2.0 -1.5 -1.0 -0.5 0.0 0.5 1.0 1.5 2.0 S ur face el ev at io n [ m ]
Figure 9. Upper diagram: Discrete profiles of maximum local pressure gradient (red squares) and shear stress (black cross markers) derived from macroscopic fluid variables around the surperficial grains. Lower diagram: Discrete profile of integrated hydraulic force at each grain on the surface of the assembly. All profiles obtained at time t=8 s of the transient simulation.
4 ONSET OF EROSION
4.1 Topology of first grain movement
Now let us turn the attention to the incipient motion of the soil grains under the action of the fluid jet when they are allowed to move. Figure 10 shows the topology of the first grain motion out of a parametric study encompassing three different random granular assemblies for each of four different mean particle sizes ranging from 1mm to 5mm, and two different fluid kinematic viscosities (4 x 10⁻⁵ and 5 x 10⁻⁵ m2/s respectively).
The inlet fluid velocity was kept constant with a Poiseuille profile and a maximum velocity of 0.6 m/s for all simulations. As a reference, Figure 10 also depicts the locations of the maxima of shear stress provided in (Rajaratnam 1976) and (Weidner et al. 2012) out of experimental and numerical anal-ysis of the impinging jet respectively.
These results tend to show that the reference val-ues of maximum shear stress can hardly predict the location of the motion onset which is rather go-verned by the irregularities of the surface, particular-ly as the size of the solid grains increases. In any case, the limitations of such a two-dimensional anal-ysis may also play a relevant role in this respect. The
superficial irregularities of a 2D granular assembly are in general more pronounced than in three-dimensional conditions, while the single grains at the surface resting on top of two other grains can in principle be set in motion more easily than their counterparts in 3D.
Figure 10. Initial location of the first particle to be displaced at the onset of jet erosion and reference locations of shear stress maxima out of (Rajaratnam 1976) and (Weidner et al. 2012).
0.0 0.5 1.0 1.5 2.0 2.5 3.0 3.5 4.0 4.5 5.0 0 2 4 6 8 10 12 14 16 18 20 -2.0 -1.5 -1.0 -0.5 0.0 0.5 1.0 1.5 2.0 V isc ou s sh ea r st re ss [ P a] G ra in' s m ax. pr es su re g ra di ent [ kP a/ m ]
Local pressure gradient Viscous shear stress
0.00 0.01 0.02 0.03 0.04 0.05 0.06 0.07 0.08 0.09 -2.0 -1.5 -1.0 -0.5 0.0 0.5 1.0 1.5 2.0 G ra in' s hydr au li c f or ce [ N ]
Normalized radial distance to jet's axis, r/H [-]
Integrated hydraulic force
0.0 0.5 1.0 1.5 2.0 2.5 3.0 3.5 4.0 4.5 5.0 0.01 0.10 1.00 P ar tic le r ad iu s R [ m m ]
Normed distance to jet's axis r/H [-]
d_mean = 1 mm d_mean = 2 mm d_mean = 3 mm d_mean = 5 mm
Max shear stress [Rajaratnam, 1976] Max shear stress [Weidner et al, 2012]
4.2 Critical jet inflow velocity
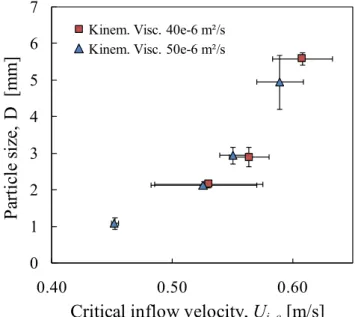
Finally, the magnitude of the critical jet inflow ve-locity for the initiation of erosion has been addressed here by means of a further parameter variation. For this purpose, the parametric study introduced in Sec-tion 4.1 was repeated but this time featuring an creasing inflow velocity growing in time from an in-itial value of 0.45 m/s with a rate of 0,02 m/s2.
Despite the relatively large error bars (standard deviations here), the general trend of growing criti-cal velocity with particle size and decreasing fluid viscosity shown in Figure 11 seems plausible and al-so consistent with the experimental results obtained by Brunier-Coulin and coworkers (some preliminary details already available in Brunier-Coulin et al. 2015; 2016).
Figure 11. Critical jet velocity for the initiation of erosion in dependence of the solid particle size and of the fluid kinematic viscosity.
5 CONCLUSIONS AND OUTLOOK
The local distribution of hydrodynamic variables at the surface of a granular assembly under the action of an impinging jet can be suitably analysed from a micromechanical perspective employing a numerical model that combines the LBM and DEM techniques. The irregularities (rugosity) of the solid surface ap-pear to bear a strong relevance on the distribution of shear stresses and pressure gradients, particularly as the size of the solid particles increases. The topology of the erosion onset seems therefore to be dictated by the granular profile and hardly follows the theo-retical references of the maximum shear stress local-ity. Finally, the critical velocity of the jet for the init-iation of erosion seems also to be relatively variable depending on the actual surface irregularities, but tends to show a seemingly consistent growth pattern with particle size.
The validity of these results is obviously con-strained by the significant limitations imposed by the
analytical method itself (i.a. the two-dimensionality, the particle size and shape, or the low Reynolds and Mach numbers, to name only a few) as well as by the computational expense inherent to the multi-scale study case (a macroscopic problem featuring microscopic details). The presented model might nevertheless prove useful while providing a rare in-sight into the micromechanical origins of erosion.
The authors are presently working on further pa-rametrical variations and an elaborate analysis of the micromechanical data for the case of jet erosion of frictional (non-cohesive) materials. On the other hand, a further study of granular assemblies with co-hesion, thus allowing for tensile normal forces be-tween the solid particles, is currently under way and shall complement the preliminary results already published in (Cuéllar et al., 2015).
ACKNOWLEDGEMENTS:
The French regional administration Provence-Alpes-Côte d'Azur has kindly provided the funding for these investigations, which were carried out in the frame of the ESCAPE research project. This support is gratefully acknowledged by the authors.
6 REFERENCES
Badr, S. 2014. Erosion d’un milieu granulaire par un jet. PhD thesis, Université Paris-Sud.
Benahmed, N.; Bonelli, S. 2012. Investigating concentrated leak erosion behaviour of cohesive soils by performing Hole Erosion Test. European Journal of Environmental and Civil Engineering, Vol. 16, n° 1, pp. 43-58.
Bickley, W.G. 1937. The plane jet. The London, Edinburgh and Dublin Philosophical Magazine and Journal Science, 23: 727–731
Boutt, D.F.; Cook, B.K. and Williams, J. R. 2011. A coupled fluid–solid model for problems in geomechan-ics:Application to sand production, Int. J. Numer. Anal. Meth. Geomech.35:997–1018x.
Bouzidi, M.; Firdaouss, M. and Lallemand, P. 2001. Momen-tum transfer of a Boltzmann-lattice fluid with boundaries, Phys. Fluids, Vol. 13, No. 11.
Brunier-Coulin, F.; Cuéllar, P. and Philippe, P. 2015. Méca-nismes élémentaires de l’érosion d’un sol cohésif. In Proc. 22ème Congrès Français de Mécanique.
Brunier-Coulin, F.; Cuéllar, P. and Philippe, P. 2016. Local mechanisms of cohesive soil erosion. Submitted to 8th In-ternational Conference on Scour and Erosion, ICSE2016, Mathematical Institute, Oxford, UK..
Cuéllar, P., Philippe, P., Bonelli, S., Benahmed, N., Brunier-Coulin, F., Ngoma, J., Delenne, J.-Y., Radjai, F. 2015: Mi-cromechanical analysis of the surface erosion of a cohesive soil by means of a coupled LBM-DEM model. Proc. 4th Int. Conf. on Particle-based Methods, PARTICLES 2015. E. Oñate, M. Bischoff, D.R.J. Owen, P. Wriggers & T. Zohdi (Eds).
Cui, X.; Li, J.; Chan, A. and Chapman, D. 2012. A 2D DEM– LBM study on soil behaviour due to locally injected fluid, Particuology10: 242– 252.
Cundall, P.A. and Strack, O.D.L. 1979. A discrete numerical model for granular assemblies, Géotechnique, Vol. 29, pp. 47-65.
Delenne, J.-Y.; El Youssoufi, M.S.; Cherblanc, F. and Bénet, J.-C. 2004. Mechanical behaviour and failure of cohesive
0 1 2 3 4 5 6 7 0.40 0.50 0.60 P ar tic le s iz e, D [ m m ]
Critical inflow velocity, Uj_c[m/s] Kinem. Visc. 40e-6 m²/s
granular materials,Int. J. Numer. Anal. Meth. Geomech., Vol. 28, pp. 1577–1594.
Fell, R., and Fry, J.-J. 2007. Internal Erosion of Dams and Their Foundations. Taylor & Francis, London.
Feng, Y.T.; Han, K. and Owen, D.R.J. 2007. Coupled lattice Boltzmann method and discrete element modelling of par-ticle transport in turbulent fluid flows: Computational is-sues, Int. J. Numer. Meth. Engng. 72:1111–1134.
Foster, M., Fell, R., & Spannagle, M. 2000. The statistics of embankment dam failures and accidents. Can. Geotech. J. Volume 37:1000-1024.
Hanson, G.J. and Cook, K.R. 2004. Apparatus, test procedures and analytical methods to measure soil erodibility in situ. Engineering in Agriculture, ASAE, 20(4): 455-462.
Jiang, M.; Zhang, W.; Sun, Y. and Utili, S. 2013. An investiga-tion on loose cemented granular materials via DEManalys-es, Granular Matter15:65–84
Lallemand, P. and Luo, L.-S. 2003. Lattice Boltzmann method for moving boundaries, Journal of Computational Physics, Vol. 184, pp. 406–421.
Luding, S. 2008. Cohesive, frictional powders: contact models for tension, Granular Matter, Vol. 10, pp. 235–246.
McNamara, S. 2011. Molecular dynamics method, inDiscrete-element modeling of granular materials, Eds. Radjaï, F. and Dubois, F., Wiley-Iste
Mutabaruka, P.; Delenne, J.-Y.; Soga, K. and Radjai, F. 2014. Initiation of immersed granular avalanches, Phys. Rev. E. 89.
Ngoma, J. 2015. Etude numérique et expérimentale de la déstabilisation des milieux granulaires immergés par fluidi-sation, PhD thesis, Université d’Aix-Marseille.
Phares, D. J., Smedley, G. T., and Flagan, R. C. 2000. The wall shear stress produced by the normal impingement of a jet on a flat surface. J. Fluid Mech., 418, 351–375.
Richefeu, V. 2005. Approche par éléments discrets 3D du comportement de matériaux granulaires cohésifs faiblement contraints. PhD thesis. Université Montpellier II.
Richefeu, V.; El Youssoufi, M.S.; Peyroux, R. and Radjaï, F. 2008. A model of capillary cohesion for numerical simula-tions of 3D polydisperse granular media, Int. J. Numer. Anal. Meth. Geomech.,Vol. 32, pp. 1365–1383.
Schaefer,J.; Dippel, S. and Wolf, D. 1996. Force schemes in simulations of granular materials, Journal de Physique I, 6 (1), pp.5-20, EDP Sciences.
Schlichting, H. 1960. Boundary Layer Theory. McGraw-Hill. Sibille, L.; Lominé, F.;Poullain, P.; Sail, Y. and Marot, D.
2015. Internal erosion in granular media: direct numerical simulations and energy interpretation, Hydrol. Process. 29(9), pp 2149–2163, Wiley and Sons.
Succi, S. 2001. The Lattice-Boltzmann Equation for fluid dy-namics and beyond. Oxford university press, Oxford. Tritton, D. J. 1988. Physical fluid dynamics. Oxford,
Claren-don Press.
Walder, J. 2015. Dimensionless Erosion Laws for Cohesive Sediment. J. Hydraul. Eng., Volume 142, Issue 2.