HAL Id: halshs-01782274
https://halshs.archives-ouvertes.fr/halshs-01782274
Submitted on 1 May 2018
HAL is a multi-disciplinary open access
archive for the deposit and dissemination of
sci-entific research documents, whether they are
pub-lished or not. The documents may come from
teaching and research institutions in France or
abroad, or from public or private research centers.
L’archive ouverte pluridisciplinaire HAL, est
destinée au dépôt et à la diffusion de documents
scientifiques de niveau recherche, publiés ou non,
émanant des établissements d’enseignement et de
recherche français ou étrangers, des laboratoires
publics ou privés.
1.5 °C stabilization: a short-term multi-model
assessment
Zoi Vrontisi, Gunnar Luderer, Bert Saveyn, Kimon Keramidas, Lara Aleluia
Reis, Lavinia Baumstark, Christoph Bertram, Harmen Sytze de Boer, Laurent
Drouet, Kostas Fragkiadakis, et al.
To cite this version:
Zoi Vrontisi, Gunnar Luderer, Bert Saveyn, Kimon Keramidas, Lara Aleluia Reis, et al.. Enhancing
global climate policy ambition towards a 1.5 °C stabilization: a short-term multi-model assessment.
Environmental Research Letters, IOP Publishing, 2018, 13 (4), �10.1088/1748-9326/aab53e�.
�halshs-01782274�
LETTER • OPEN ACCESS
Enhancing global climate policy ambition towards
a 1.5 °C stabilization: a short-term multi-model
assessment
To cite this article: Zoi Vrontisi et al 2018 Environ. Res. Lett. 13 044039
View the article online for updates and enhancements.
Related content
The contribution of transport policies to the mitigation potential and cost of 2 °C and 1.5 °C goals
Runsen Zhang, Shinichiro Fujimori and Tatsuya Hanaoka
-The contribution of Paris to limit global warming to 2 °C
Gokul C Iyer, James A Edmonds, Allen A Fawcett et al.
-Will international emissions trading help achieve the objectives of the Paris Agreement?
Shinichiro Fujimori, Izumi Kubota, Hancheng Dai et al.
LETTER
Enhancing global climate policy ambition towards a
1.5
◦
C stabilization: a short-term multi-model assessment
Zoi Vrontisi1 , Gunnar Luderer2, Bert Saveyn1,12, Kimon Keramidas1, Lara Aleluia Reis4,5 , Lavinia
Baumstark2, Christoph Bertram2 , Harmen Sytze de Boer3,11, Laurent Drouet4,5, Kostas Fragkiadakis6,
Oliver Fricko7, Shinichiro Fujimori8,9 , Celine Guivarch10 , Alban Kitous1, Volker Krey7, Elmar
Kriegler2 , Eoin ´O Broin10, Leonidas Paroussos6and Detlef van Vuuren3,11
1 European Commission, Joint Research Centre (JRC), 41092 Seville, Spain
2 Potsdam Institute for Climate Impact Research (PIK), Member of the Leibniz Association, PO Box 60 12 03, 14412 Potsdam, Germany 3 PBL Netherlands Environmental Assessment Agency, Bezuidenhoutseweg 30, The Hague, The Netherlands
4 Fondazione Eni Enrico Mattei, Corso Magenta 63, 20123 Milan, Italy
5 Centro Euro-Mediterraneo sui Cambiamenti Climatici, Corso Magenta 63, 20123 Milan, Italy
6 E3M-Lab, Institute of Communication and Computer Systems, National Technical University of Athens, 9, Iroon Politechniou Street,
15 773 Zografou Campus, Athens, Greece
7 International Institute for Applied Systems Analysis (IIASA), 2361 Laxenburg, Austria 8 National Institute for Environmental Studies, 16-2 Onogawa, Tsukuba, Japan
9 Department Environmental Engineering, Kyoto University, Postal address; 361, C1-3, Kyoto University Katsura Campus, Nishikyo-ku,
Kyoto-city, 615-8540 Japan
10 Cired, Ecole des Ponts ParisTech, Nogent-sur-Marne, France
11 Copernicus Institute for Sustainable Development, Utrecht University, Heidelberglaan 2, The Netherlands 12 Author to whom any correspondence should be addressed.
OPEN ACCESS
RECEIVED
20 November 2017
REVISED
20 February 2018
ACCEPTED FOR PUBLICATION
8 March 2018
PUBLISHED
26 April 2018
Original content from this work may be used under the terms of the Creative Commons Attribution 3.0 licence. Any further distribution of this work must maintain attribution to the author(s) and the title of the work, journal citation and DOI.
E-mail:[email protected]
Keywords: INDC, 1.5 degree, 2 degrees, integrated assessment modelling, mitigation cost, Paris Agreement, energy system Supplementary material for this article is availableonline
Abstract
The Paris Agreement is a milestone in international climate policy as it establishes a global mitigation
framework towards 2030 and sets the ground for a potential 1.5
◦C climate stabilization. To provide
useful insights for the 2018 UNFCCC Talanoa facilitative dialogue, we use eight state-of-the-art
climate-energy-economy models to assess the effectiveness of the Intended Nationally Determined
Contributions (INDCs) in meeting high probability 1.5 and 2
◦C stabilization goals. We estimate that
the implementation of conditional INDCs in 2030 leaves an emissions gap from least cost 2
◦C and
1.5
◦C pathways for year 2030 equal to 15.6 (9.0–20.3) and 24.6 (18.5–29.0) GtCO
2eq respectively.
The immediate transition to a more efficient and low-carbon energy system is key to achieving the
Paris goals. The decarbonization of the power supply sector delivers half of total CO
2emission
reductions in all scenarios, primarily through high penetration of renewables and energy efficiency
improvements. In combination with an increased electrification of final energy demand, low-carbon
power supply is the main short-term abatement option. We find that the global macroeconomic cost
of mitigation efforts does not reduce the 2020–2030 annual GDP growth rates in any model more
than 0.1 percentage points in the INDC or 0.3 and 0.5 in the 2
◦C and 1.5
◦C scenarios respectively
even without accounting for potential co-benefits and avoided climate damages. Accordingly, the
median GDP reductions across all models in 2030 are 0.4%, 1.2% and 3.3% of reference GDP for
each respective scenario. Costs go up with increasing mitigation efforts but a fragmented action, as
implied by the INDCs, results in higher costs per unit of abated emissions. On a regional level, the
cost distribution is different across scenarios while fossil fuel exporters see the highest GDP
reductions in all INDC, 2
◦C and 1.5
◦C scenarios.
1. Introduction
Building on the work that started at the Copen-hagen and Cancun climate summits, the bottom-up approach to climate change mitigation has been strengthened with the Paris Agreement and the submission of Intended Nationally Determined Con-tributions (INDCs or now called NDCs). This approach marked a fundamental shift in international climate policy, attracting wide support and thus reaching a participation of 195 parties representing over 98% of global emitters. In addition to this ambitious inter-national coverage, of major importance is also the decision of COP21 to officially set the long-term tar-get agreed in Copenhagen and Cancun, expressing the aim of ‘holding the increase in global mean temper-atures to a well below 2◦C and to pursue efforts to limit the temperature increase to 1.5◦C’. A facilitative dialogue, expected to start in 2018 and to reoccur at five year intervals, shall take stock of the combined efforts of the parties in relation to this long-term emis-sion reduction goal and report progress to the COP. The strengthened ambition of the long-term goal poses new challenges for policy makers and indeed soci-ety as a whole, but also for scientific analysis. Such a target has long been endorsed by climate scien-tists despite the debate surrounding its origins and effectiveness (Cointe et al 2011, Knutti et al 2016, Smith et al2009, Jaeger and Jaeger2010, Knopf et al
2012).
The scientific community is committed to pro-viding input for a potential ratcheting-up of INDCs and to describe possible pathways and necessary actions towards achieving the 1.5◦C target in light of the UNFCCC facilitative dialogue. Climate-energy-economy models have a long tradition in contributing to the global societal challenge of climate change mitigation and in providing scientific insights to the international climate policy proceedings. Such assess-ments span from an analysis on the impacts of the 1997 Kyoto protocol (Weyant 1999) to assessments of the Cancun pledges (UNEP2010, UNFCCC2010, Ricci and Selosse 2013, van Vliet et al 2012, den Elzen et al 2011, Saveyn et al 2011, Peterson et al
2011, Kriegler et al 2013, Riahi et al 2015, Lud-erer et al2016). Similarly, in the lead-up to COP21, a number of analyses (Labat et al 2015, Spencer et al 2015, IEA2015, UNEP 2015, UNFCCC2015) were published to facilitate an informed negotiation process. In the aftermath of COP21, additional analy-ses were published, which included the agreed Paris outcome and reaffirmed earlier findings about the insufficiency of the INDCs in meeting the 2◦C tar-get (UNFCCC2016, Rogelj et al2016, den Elzen et al
2016, Vandyck et al2016, UNEP2016, Fujimori et al
2016a).
We further add to this literature and contribute to the ongoing scientific research by providing a first multi-model analysis on the short-term, i.e. to 2030,
effectiveness of INDCs in relation to up-to-date sce-narios for a well-below 2◦C (2◦C scenario) and a high probability 1.5◦C (1.5◦C scenario) climate sta-bilization, as presented in table 1. We discuss the contributions of different sectors and different green-house gases and describe the transition of the energy system. Our analysis concludes with an estimation of global macro-economic mitigation costs. Through this, we aim to provide a first harmonized multi-model assessment of the INDCs along with 1.5◦C–2◦C consistent stabilization scenarios. We expect that this analysis can potentially provide quantitative input to the upcoming UNFCCC Facilitative Dialogue on Enhancing Ambition and Support in 2018. Our multi-model assessment enhances the robustness of our findings and provides an insight on the range of uncertainty of model results, due to both an inher-ent uncertainty of the quantification of INDCs (Rogelj et al2017) and to the different modelling methodolo-gies, techno-economic and structural assumptions of each model. Moreover, we provide a first multi-model short-term estimation of high probability 1.5◦C emis-sion pathways and subsequent system requirements. Current literature includes very limited 1.5◦C scenar-ios (UNEP2016), the majority of which assumes that global mitigation action to reach this target started in 2010 (IPCC 2014, Rogelj et al 2015) and can thus be considered as out of date given the existing pol-icy framework. An even smaller number of scenarios assume the introduction of global carbon prices in 2020 but only ensure a 50% chance of meeting the 1.5◦C target (Rogelj et al2015, UNEP2016). Our set of scenarios fill the 1.5◦C scenario gap (UNEP2016) as we implement a carbon budget that is in line with achieving with a high probability (> 66% chances) temperature increase below 1.5◦C by the end of the century. Comparability and equity considerations of the regional global mitigation effort as well as legal implications of the agreement are beyond the scope of this analysis.
2. Methods
2.1. Scenario set-up
Our set of scenarios enables the assessment of INDCs towards the 1.5◦C–2◦C climate targets. They are described briefly in table 1 and in more detail in the supplementary material available at
stacks.iop.org/ERL/13/044039/mmedia.
2.2. Models
The eight state-of-the-art climate-energy-economy models that participate in this analysis feature different characteristics and model structures, providing further robustness of results. A brief description is provided in table2, while more information can be found in the supplementary material.
Table 1. Brief description of scenarios.a
Scenario name Description Climate stabilization constraint Reference Realistic achievement of 2020 Cancun pledges. Low
climate policy ambition in the post-2020 period.
No INDC Realistic achievement of 2020 Cancun pledges. Full
implementation conditional INDCs by 2030. Fragmented climate action after 2030 with following a reduction of carbon intensity as in 2020–2030 period.
No
2◦C Realistic achievement of 2020 Cancun pledges. Post-2020 cost-optimal global mitigation action to keep total CO2 emissions to within a 800 GtCO2carbon budget in 2016–2100.
>67% chance to stay below 2◦C (for more details on the
climate evaluation please refer to Luderer et al (in review))
1.5◦C Realistic achievement of 2020 Cancun pledges. Post-2020 cost-optimal global mitigation action to keep total CO2 emissions to within a 200 GtCO2carbon budget in 2016–2100.
>67% chance to return to below 1.5◦C in 2100 (for more
details on the climate evaluation please refer to Luderer et al (in review))
aThe 2◦C and 1.5◦C scenarios correspond to the B200|1.5C-T2100|> 67% and B800|2C-Tmax| > 67% scenarios in Luderer et al (in review).
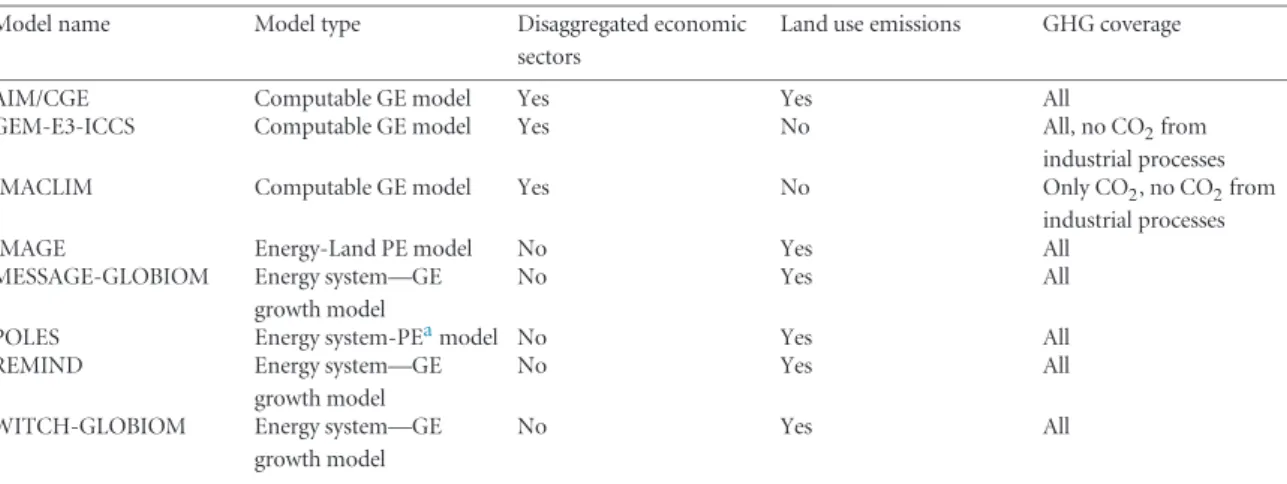
Table 2. Brief description of participating models.
Model name Model type Disaggregated economic sectors
Land use emissions GHG coverage AIM/CGE Computable GE model Yes Yes All
GEM-E3-ICCS Computable GE model Yes No All, no CO2from industrial processes IMACLIM Computable GE model Yes No Only CO2, no CO2from
industrial processes IMAGE Energy-Land PE model No Yes All
MESSAGE-GLOBIOM Energy system—GE growth model
No Yes All
POLES Energy system-PEamodel No Yes All REMIND Energy system—GE
growth model
No Yes All
WITCH-GLOBIOM Energy system—GE growth model
No Yes All
aPE: Partial equilibrium, GE: General equilibrium.
3. Results and discussion
This section presents the results of the numerical simulations of the scenarios presented in section 2. Simulations have been conducted by all eight partici-pating models and the results throughout the text are presented as a median of all model results, while min-imum and maxmin-imum values of the eight model results are provided in the brackets unless indicated otherwise. In all boxplot figures the top of the rectangle indicates the third quartile, the horizontal line near the middle of the rectangle indicates the median, while the bottom of the rectangle indicates the first quartile. We note that especially with regards to the ranges of GHG emission levels, these do not include GEM-E3 and IMACLIM models, as they do not have a full coverage of GHG emissions.
The first subsection of this section discusses the emission pathways for each scenario and the emis-sion reduction contributions by different GHGs and by economic sectors. Next, we analyze the energy system transition that is in line with the climate pol-icy constraints, with a particular focus on the power supply and the transport sector. Finally, we present the short-term macroeconomic costs of the mitigation
action for each scenario, covering both direct and indi-rect costs but not taking into consideration avoided climate damages nor any potential co-benefits of the mitigation action.
3.1. Emission pathways
In the absence of the Paris pledges, the implemen-tation of current policies (reference scenario) leads to an increase of global emissions at a rate of 0.7% (0.4%–1.1%) per annum during 2010–2050, reaching 60.3 (56.6–64.6) GtCO2eq in 2030 (table3), and peak after 2050 in all models, if at all by 2100. Along such trajectories the global mean temperature, projected by the global climate model MAGICC612(Meinshausen et al 2011) shows a 3.4◦C (2.9◦–3.8◦) temperature increase by the end of the century compared to pre-industrial levels and thus falls far short of the cli-mate stabilization targets agreed in Paris, and exposes the world to severe climate risks (e.g. IPCC 2014, World Bank2012).
12All temperature results mentioned in the text refer to year 2100
and to the 50 percentile output of MAGICC6 model. The ranges that are provided include the 50% temperature across models for year 2100, thus full climate uncertainty is not covered.
Table 3. GHG emissions levels in 2030 and GHG, GDP and final energy trends in 2010–2050 for all scenario and models.
Mean annual global GHG emissions in 2030 Mean annual change in 2010–2050 Absolute level Versus 2010 Versus reference GHG GDP Final energy Reference AIM/CGE 63.6 24% 0.8% 2.6% 1.1% GEM-E3/ICCSb 52.8 26% 0.8% 2.5% 1.4% IMACLIMa 41.7 36% 1.2% 2.9% 1.8% IMAGE 56.6 18% 0.5% 3.0% 1.1% MESSAGE 57.4 11% 0.4% 3.8% 1.4% POLES 61.8 33% 1.0% 2.6% 1.2% REMIND 64.6 29% 1.1% 2.6% 1.6% WITCH 58.9 24% 0.7% 2.5% 1.6% INDC AIM/CGE 54.5 7% −14% −0.3% 2.6% 0.9% GEM-E3/ICCSb 47.0 12% −11% −0.2% 2.4% 1.0% IMACLIMa 39.2 28% −6% 0.7% 2.9% 1.6% IMAGE 53.8 12% −5% −0.1% 3.0% 0.8% MESSAGE 53.7 4% −6% −0.4% 3.8% 1.2% POLES 50.1 8% −19% −0.5% 2.6% 0.9% REMIND 56.6 13% −12% 0.3% 2.6% 1.5% WITCH 48.8 3% −17% 0.0% 2.5% 1.5% 2◦C AIM/CGE 36.0 −30% −43% −2.8% 2.5% 0.5% GEM-E3/ICCSb 43.6 4% −17% −2.5% 2.3% 0.4% IMACLIMa 31.6 3% −24% −2.6% 2.7% 0.7% IMAGE 38.3 −20% −32% −2.8% 3.0% −0.1% MESSAGE 40.4 −22% −30% −2.1% 3.8% 0.8% POLES 41.1 −11% −34% −2.8% 2.6% 0.6% REMIND 41.0 −18% −37% −2.4% 2.6% 1.1% WITCH 28.5 −40% −52% −2.1% 2.4% 0.8% 1.5◦C AIM/CGE 25.5 −50% −60% −9.4% 2.5% 0.1% GEM-E3/ICCSb 23.9 −43% −55% −3.8% 2.2% 0.1% IMACLIMa 26.6 −13% −36% −8.2% 2.4% 0.2% IMAGE 35.3 −27% −38% −9.2% 3.0% −0.2% MESSAGE 27.9 −46% −51% −4.0% 3.7% 0.3% POLES 30.8 −34% −50% −5.7% 2.6% 0.0% REMIND 33.1 −34% −49% −4.5% 2.5% 0.9% WITCH 21.5 −55% −64% −3.5% 2.2% 0.4%
aIMACLIM only covers CO
2emissions.
bGEM-E3/ICCS does not include LULUCF emissions.
The implementation of high-ambition INDCs (conditional INDCs) brings global emissions down by 8.5 (2.8–11.7) GtCO2eq compared to the reference scenario, thus reaching 53.7 (48.8–56.6) GtCO2eq in 2030. Our range of results confirms earlier estima-tions of conditional INDC GHG levels that refer to 51–56 GtCO2eq (UNFCCC 2016, Rogelj et al 2016, UNEP 2016). By keeping the ambition of post-2030 climate policies similar to that of the INDCs, namely by following an annual decarbonization rate equal to that of 2020–2030, we find that the average annual growth rate of global GHG emissions becomes only marginally negative for most models in 2010–2050, while emis-sions peak in the 2020–2030 period. However, with such an assumption on future climate policies, the temperature increase by the end of the century is still higher than the commonly agreed climate stabiliza-tion goals, reaching the range of 2.6◦C (2.4◦C–3.1◦C) as evaluated with MAGICC6 (see also Luderer et al (in review) for a more detailed climate evaluation).
In the cost-optimal 2◦C and 1.5◦C scenarios all models find that global emissions peak in 2020, namely when the global climate mitigation action begins with the introduction of a global carbon price. GHG emis-sion levels in 2030 fall to 39.3 (28.5–41.1) and 29.4 (21.5–35.3) GtCO2eq respectively, corresponding to
a 34% (19%–52%) and 53% (36%–64%) reduction from reference levels. The implementation of condi-tional INDCs in 2030 leaves an emissions gap (UNEP
2015) of 15.6 (9.0–20.3) and 24.6 (18.5–29.0) GtCO2eq for the 2◦C and 1.5◦C targets respectively (see figure1).
We find that our 2030 2◦C emission levels are on the lower end of the IPCC AR5 scenarios that are reported in the literature (UNEP 2016, Rogelj et al
2015), in part due to a later starting year of global climate action in our scenarios. Comparing our 1.5◦C estimations with existing literature is more challenging, since relevant estimations are very limited and based on different assumptions (i.e. earlier starting year of global climate action and higher carbon budget for the period 2011–2100, as described in section2). Our high probability 1.5◦C scenario falls well below the emission levels of earlier estimations that report a level of 2030 global GHG emissions equal to 33 (26–40) GtCO2eq (Rogelj et al2015) and 39 (37–40) GtCO2eq (UNEP
2016), while other recent publications (Robiou du Pont et al2017) provide an estimation of 29 GtCO2eq but exclude LULUCF and bunker emissions and are thus not comparable. Our estimations are lower than the findings of the literature so far, primar-ily due to the construction of our scenarios which
B A
Figure 1. (a) Global emission trajectories for 2010–2050. (b) Global GHG emissions in 2030. The graphs do not include emission projections from GEM-E3/ICCS and IMACLIM models as these do not have a full coverage of GHG. The shaded areas (funnel) exclude WITCH results as the respective 2◦C levels fall in the 1.5◦C range making funnels less visible.
features increased chances of meeting the 1.5◦C tar-get (higher than 66% chance instead of higher than 50% chance). In addition, our implementation of a global mitigation action 10 years later than most IPCC AR5 scenarios, i.e. in 2020, results in a smaller available carbon budget for the period 2020–2100.
Apart from the intrinsic uncertainty of GHG emis-sion projections, different historical emisemis-sions across participating models may also explain the wide emis-sions range. In particular, historical emisemis-sions are
an important consideration, as INDC targets are largely expressed in relation to historical base years. In line with the above, our harmonized quantification of INDCs is expressed in relation to 2010 emission levels. The differences in historical emissions across mod-els can be explained by the usage of different data sources (EDGAR, UNFCCC, CAIT and PRIMAP) as well as by the different calibration years of each model. While the use of different data sources can pro-vide an indication of the adjacent uncertainty ranges
Figure 2. Average yearly reduction rates of CO2intensity (CO2emissions per GDP). The calculation excludes LULUCF emissions. IMACLIM, IMAGE, POLES and REMIND model results are not included in the 2030–2050 boxplot for the 1.5 C scenario as their CO2intensity reduction rates reach 45%/yr.
of emission trajectories, a harmonization of sources remains a challenge for future model ensemble analy-ses. In order to understand the potential significance of a data harmonization process, we isolate this uncer-tainty by using the uniform scaling harmonization approach (Rogelj et al 2011). For this we select the average 2005 global GHG emissions of all models as a reference value to adjust all GHG projections. We find that this harmonization results in a somewhat reduced range of results, but also in systematically lower median values, with emissions gaps of 15.6 (9.1–19.8) for the 2◦C and to 22.0 (17.8–27.0) for the 1.5◦C targets. All results described in the subsections below have not been adjusted with this harmonization process.
The rate of decarbonization of the economy (namely the reduction of carbon intensity of GDP) is slower in the period 2010–2030 than in 2030– 2050 in all scenarios (figure 2). Implementing the INDCs leads to an improvement of carbon intensity towards a rate that exceeds the 1990–2010 average by 1%. The carbon intensity improvement rates of the climate stabilization scenarios in 2010–2030 are below the observed rates of Europe and Central Asia in the period 2004–2014, which are equal to −6%, while in the period 2030–2050 the rates are above the highest observed improvement rate of the 2004– 2014 period, which is equal to−11%, thus posing a real challenge for the achievement of this transition.
Around 80% of emission reductions in 2030 in all scenarios come from the reductions of the domi-nant GHG, CO2. With regards to the rest of the GHG, CH4contributes by around 13%, F-gases by 4% and
N2O by 3%. In particular, F-gases mark the highest reduction compared to the reference scenario for most models, ranging from 16% in the INDC scenario to 72% in the 1.5◦C scenario. This indicates the cheap abatement potential of F-gases assumed in most mod-els, also in line with the Kigali Agreement of 2016 that sees an 80%–85% reduction of HFCs in 204513 compared to reference projections. On the contrary, N2O emissions mark the lowest relative reductions in all scenarios, as emissions from agricultural soils have limited abatement options (Smith et al2014).
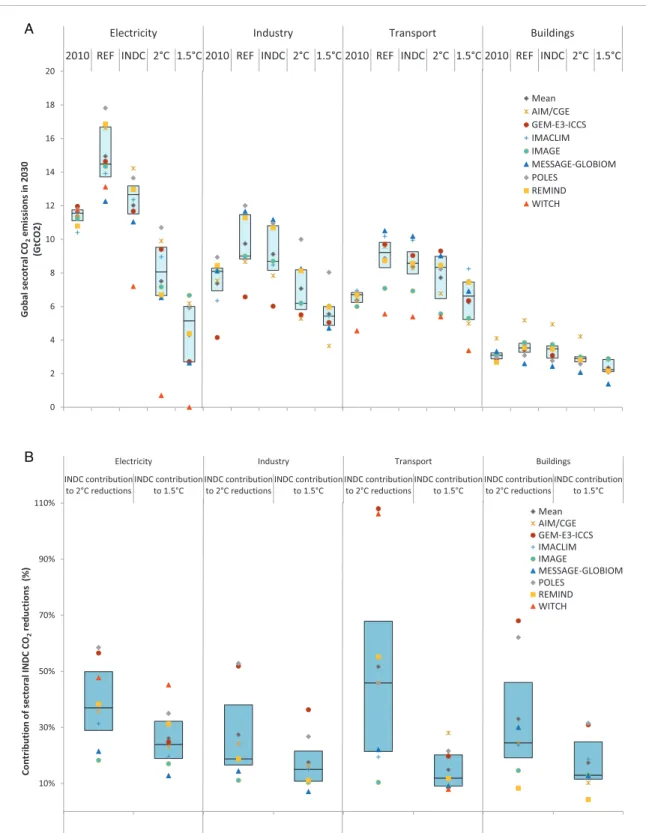
In terms of sectoral contributions, in 2030 the power sector continues to have the highest share of direct CO2emissions in both reference and INDC sce-narios (figure 3(a)), while its emissions rapidly fall in the climate stabilization scenarios, even below the emission levels of the industry and transport sectors. We find that the decarbonization of the power sup-ply sector accounts for around 50% of total CO2 emission reductions in all scenarios. The implemen-tation of INDCs contributes substantially to that end, as it achieves 37% (18%–59%) of sectoral reduc-tions of the 2◦C scenario and 24% (13%–45%) of the 1.5◦C reductions. Although the effectiveness of INDCs is noteworthy in the power supply sector, also demand sectors, and especially transportation, register emission reductions induced by the INDCs (figure 3(b)) that account for more than 15%–20%
13Decision XXVIII/1 Further Amendment of the Montreal
Pro-tocol. http://ozone.unep.org/sites/ozone/files/pdfs/FAQs_Kigali_ Amendment.pdf
A
B
Figure 3. (a) Global direct CO2emissions by sector in 2030. (b) Contribution of INDCs to the sectoral emission gap for 2◦C and 1.5◦C. GEM-E3 and IMACLIM results do not include CO2process emissions.
of the respective sectoral reductions observed in the 1.5◦C–2◦C scenarios. The decarbonization of the remaining energy demand sectors is more expensive and thus emission reductions are less pronounced. The overall contribution of the industry sector to total emission reductions in 2030 varies from around 12% in the INDC to 20% and 18% in the 2◦C and 1.5◦C scenarios respectively. The transport sector contributes by around 12% to total CO2 reductions
in all scenarios, while the respective share of the buildings sector is close to 6%. However, the trans-port sector is the only sector whose emissions in 2030 in the decarbonization scenarios are higher than 2010 levels. This is mainly due to increasing demand from emerging economies (Lennert and Schoenduwe
2017), both for private transportation and freight, thus leaving further scope for decarbonization later in the century.
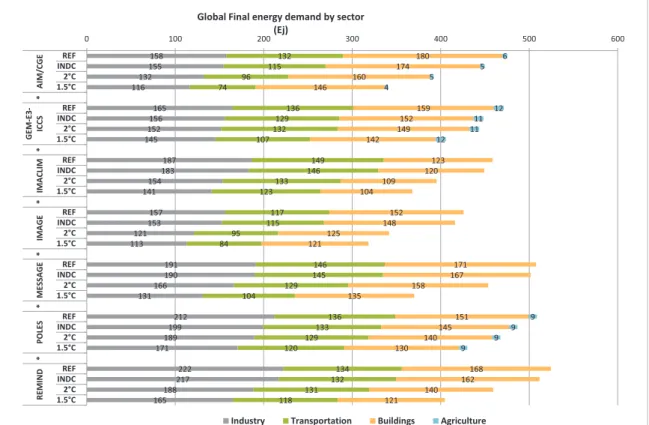
Figure 4. Global final energy demand by sector in 2030. WITCH model is not included in the graph due to limited sectoral representation.
3.2. The energy transformation gap
The moderate ambition of the INDCs results in a slow and restrained transformation of the energy sys-tem. We here use sectoral indicators to quantify and analyze the energy transformation gap, i.e. the dif-ference in these transformation indicators between INDC scenarios and cost optimal 1.5 and 2◦C scenarios. Final energy intensity of the global econ-omy in 2030 is 25% (20%–44%) lower than 2010 levels but only 3% (1%–8%) below reference levels. In the 2◦C and 1.5◦C scenarios final energy intensity of GDP improves at a much faster pace than under the INDCs. Already in 2030 energy intensity reductions are deep, falling below 2010 levels by 34% (25%–50%) and 39% (30%–57%) respectively.
On a sectoral level (figure 4), industry plays the key role in total energy savings, depicting a large untapped potential for energy efficiency mea-sures. In the INDC scenario in 2030, reductions in industrial final energy demand constitute 38% (7%–58%) of total energy reductions from refer-ence. Much deeper reductions are seen in the climate stabilization scenarios as the INDC industrial final energy reductions are only a fraction of the latter (12% (2%–68%) of 2◦C reductions from reference and 9% (1%–45%) of 1.5◦C reductions from ref-erence). The contribution of industry in total final energy reductions is close to 45% in the climate sta-bilization scenarios, while the buildings and transport sectors contribute by around 27% each in all scenarios.
The role of industry in total energy savings is facili-tated by the use of more efficient energy carriers, and in particular by the extended electrification of various industrial processes and energy needs.
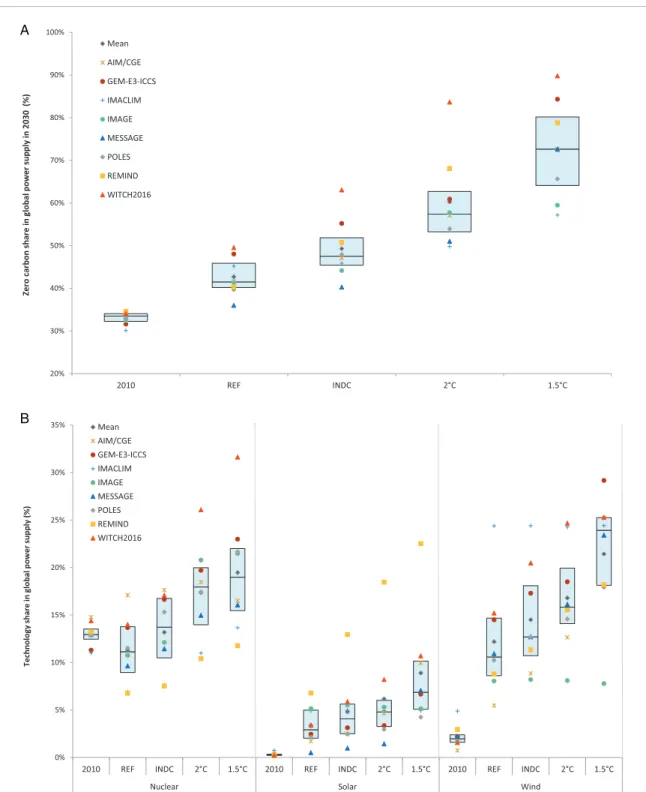
Power supply is the dominant mitigation sector, undergoing a low-carbon transformation in all sce-narios (see figure5). The implementation of INDCs increases the share of zero-carbon14 power supply in 2030 by 7 (1–14) percentage points from reference levels, reaching a share of 48% (40%–63%) of zero-carbon electricity. The respective share is 15% (5–34) percentage points higher in the 2◦C power mix and 34% (12–40) percentage points higher in the 1.5◦C one (figure5 (a)). All models find that the penetra-tion of renewable energy is the driving force of this transition. Wind energy has the most notable growth pattern, increasing sevenfold by 2030 from 2010 lev-els in the INDC scenario and registering a share of 16% (8%–25%) and 24% (8%–29%) in 2◦C and 1.5◦C scenarios respectively (figure5(b)). Solar power is also a key zero-carbon technology increasing its share in global power supply from an almost zero in 2010 to 4% (1%–13%) in 2030 in the INDC and 7% (4%–23%) in the 1.5◦C scenario. Nuclear power sustains a share similar to that of 2010, increasing only by 8% (5%–18%) in the 1.5◦C scenario.
14Zero carbon power supply includes all renewable power supply
(including all hydro and biomass production) as well as nuclear power.
A
B
Figure 5. (a) Share of zero-carbon power in global power supply in 2030. (b) Share of nuclear, solar and wind production in the global power mix in 2030.
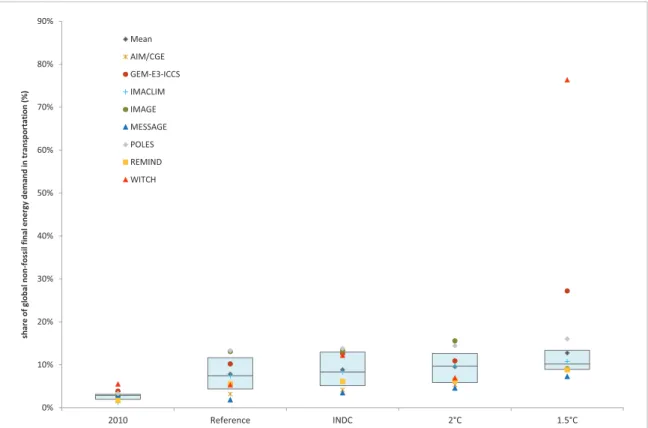
The transport sector shows a less rapid low-carbon transition and thus its delow-carbonization remains a challenge for the period after 2030. Results (fig-ure 6) indicate that the transition is already taking place in 2030 in the reference scenario but the share of non-fossil final energy demand in transportation increases only marginally with the implementa-tion of the INDCs and remains roughly the same in the 2◦C scenario. As shown in figure 3(b), transport CO2 emission reductions in the INDC scenario are equal to 50% of the 2◦C sectoral
reductions, the highest share across all sectors. How-ever, the INDC reductions are around 20% of the reductions registered in the 1.5◦C scenario, where non-fossil final energy demand in transportation reaches 13% (7%–27%) (figure6). The electrification of the global transport sector is found close to 2% of the sector’s energy demand in the reference and INDC scenarios and increases to around 4% in the 2◦C and 1.5◦C scenarios. Similarly, the share of biofuels in the INDC scenario reaches 6%, and increases only to an 8% share in the 1.5◦C scenario.
Figure 6. Share of non-fossils in transport final energy demand in 2030. In WITCH model the transport sector includes only road transport.
3.3. Macroeconomic costs of mitigation action
Moving to a low-carbon system is a capital-intensive process and entails a reallocation of resources that can result in economy-wide policy costs (Paltsev and Capros2013). Cost estimates vary widely across mod-els depending on the assumptions for technological progress and technology costs, marginal costs for avail-able abatement options, the overall and sectoral model responsiveness to carbon prices, the model-specific price elasticities, the level of sectoral and regional dis-aggregation of each model and more. A multi-model analysis can provide some insight into the level of uncertainty of cost estimations (Iyer et al2015).
We contribute to the literature by providing a multi-model assessment of the short-term costs of implementing of the Paris Agreement mitigation tar-gets for 2030 (INDCs) along with cost estimations for achieving the 2◦C and 1.5◦C targets with a >66% probability. To our knowledge, there is no cost esti-mation of a high probability 1.5◦C scenario in the literature. Our analysis includes a subset of the partici-pating models, as not all models feature an endogenous macroeconomic representation. We calculate the total costs of a low-carbon transition, as we do not only cover the direct costs of emission reductions (as for example in Iyer et al (2015)), but also the indirect macroeconomic impacts of this transition. However, our estimations only consider the costs of mitigation and do not include any potential co-benefits of climate action or the benefits from avoided climate damages.
In our 2◦C and 1.5◦C decarbonization scenarios costs are minimized (IPCC 2014) as we implement
a global, unified mitigation framework where reduc-tions are undertaken by the sectors and regions with the lowest marginal abatement costs. On the con-trary, INDC emission reductions assume a fragmented mitigation action and are thus expected to result in suboptimal burden sharing and increased costs (Aldy et al 2016, Fujimori et al 2016b). In addition, it is important to note that a cost-optimal mitigation framework, like in our 2◦C and 1.5◦C scenarios, does not address any equity considerations (Raupach et al2014), but can serve as a benchmark to indicate, among other things, the cost-optimal level of abate-ment as well as sectors where abateabate-ment is cheaper. Equity considerations along with other supplementary policies, like technology transfer, financing schemes and the removal of trade restrictions, could address other socioeconomic considerations or UN sustain-able development goals (SDGs), but this is out of the scope of this analysis.
We find that the pace of economic growth is affected by climate change mitigation action only to a lim-ited degree. Global annual GDP growth rates in the period 2020–2030 remain close to reference levels, namely close to 3% in most scenarios and models. The most striking reduction in global annual GDP growth rates for the same period is registered in the 1.5◦C scenario, equal to 0.36 (0.21–0.48) percentage points compared to the reference (table 4). This is much lower than the uncertainty of the pace of economic growth, as can be seen in the different assump-tions on reference annual GDP growth rates across models, covering a range from 2.8% to 4.6%.
Figure 7. Total costs of mitigation in 2030: GDP (bar chart) in relation to GHG reductions (markers), all as % change from reference.
Table 4. Average annual global GDP growth rates in 2020–2030 period in all scenarios. IMAGE and POLES models are not included as they feature an exogenous GDP.
REF INDC 2◦C 1.5◦C AIM/CGE 2.9% 2.9% 2.8% 2.6% GEM-E3-ICCS 2.9% 2.8% 2.8% 2.6% IMACLIM 3.1% 3.1% 2.8% 2.6% MESSAGE 4.4% 4.4% 4.3% 4.0% REMIND 2.9% 2.8% 2.8% 2.6% WITCH 2.8% 2.8% 2.6% 2.3%
All models register increasing costs with increas-ing abatement efforts. In 2030 the implementation of INDCs results in a global macroeconomic cost of 0.4% (0.1%–1.2%) of the reference GDP, similar to the findings of other macro-economic assessments (Vandyck et al2016). In the 2◦C scenario the respec-tive cost is 1.2% (0.5%–4.5%). To put this number into context we calculate GDP costs from the public IPCC AR5 WGIII Scenario database15, using results on GDP impacts for 450 ppm scenarios16, and find that costs are of comparable magnitude, equal to 1.6% (0.7%–6%) of reference GDP. Further, in accor-dance with the IPCC methods of presenting mitigation costs (IPCC 2014), we compare private consump-tion losses, reported by AIM/CGE, GEM-E3-ICCS, IMACLIM and MESSAGE-GLOBIOM models. We find that the scale of impacts is similar to that of GDP costs, namely a loss of 1.2% (0.4%–2.5%) of reference consumption in our 2◦C scenario and a
15IPCC AR5 Scenario database https://tntcat.iiasa.ac.at/AR5DB/ dsd?Action=htmlpage&page=about.
16We used the AMPERE and LIMITS databases taking stock of all
models that feature endogenous macroeconomic variables.
loss of 1.7% (1.0%–3.7%) in the IPCC scenario set which is described above.
The rapid decarbonization required already in 2030 in order to achieve the 1.5◦C target results in higher costs as we move to the part of the global marginal abatement curve with the steepest slope once cheap mitigation options have been exploited in lower ambition scenarios. GDP impacts in the 1.5◦C sce-nario are equal to 3.3% (2.1%–7.1%) of reference GDP and consumption losses equal to 3.6% (1.6%– 4.6%) of reference consumption. In figure7we provide the GDP changes in relation to total GHG reductions for each model, so as to highlight the model-specific responsiveness to carbon prices and other resource restrictions that are adjacent to mitigation action. The different responsiveness results in different costs per unit of abated emissions for each model. The graph illustrates that in addition to the different assump-tions and model properties that result in varying cost estimations, costs may differ due to different abate-ment efforts with regards to the reference scenario of each model. We note that the mitigation effort in the climate stabilization scenarios is continued beyond 2030, and that costs might increase further beyond that date.
Despite these differences across models, we cal-culate an average abatement cost (the ratio of GDP losses to GHG reductions relative to reference) which is similar across most models, within the range of 60$2005/tCO2eq for the INDC and 2◦C scenarios and 110$2005/tCO2eq for the 1.5◦C scenario. Find-ing that the average abatement cost of the INDC and 2◦C scenarios is roughly the same confirms the above-mentioned earlier findings (Aldy et al 2016, Fujimori et al 2016b, Blanford et al 2014), namely
that a fragmented action, like the INDC scenario, results in higher costs per unit of abated emissions.
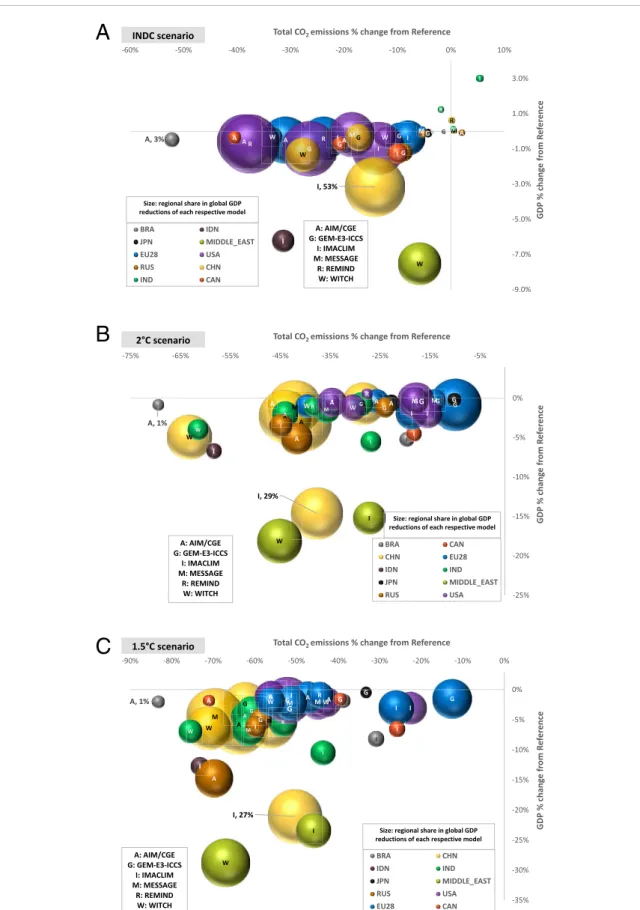
While our analysis focuses on the global scale, we briefly discuss here the regional distribution of abate-ment efforts and mitigation costs so as to highlight any findings that could prove useful for a future assess-ment of effort allocation schemes. According to our 2◦C and 1.5◦C scenario set-up, we implement a cost-optimal mitigation so that global costs are cost-optimally minimized without any further assumptions on bur-den sharing. We find that economic costs, expressed in terms of GDP reductions from reference levels, are shared differently across regions amongst the frag-mented and the cost-effective, climate stabilization scenarios. High income economies, like USA, EU28, Canada and Japan, contribute substantially to the mit-igation effort in the INDC scenario and thus have high regional GDP costs when compared to the reference (see figure 8). On the contrary, in the cost-efficient global decarbonization scenarios, emerging economies like China, India and Brazil take up most of the mitigation efforts due to untapped cheap abatement potentials, thus resulting in higher GDP reductions rel-ative to the reference than those seen in high income economies. Nevertheless, a common characteristic can be identified in all scenarios, namely that the fossil fuel exporting regions, particularly Middle East, Rus-sia and IndoneRus-sia, see high costs compared to the rest of the regions both due to declining global fos-sil fuel demand that leads to diminishing exports but also due to the carbon intensive structure of their economies.
4. Conclusion
In this paper, we present a multi-model assessment of the effectiveness of the INDCs in achieving the well below 2◦C and the 1.5◦C climate stabilization targets. We provide a detailed description of the low-carbon mitigation pathways which are consistent with meeting these targets, as well as an estimation of the macroeco-nomic costs of mitigation. Through this, we contribute with scientific insights on the scale of a potential ratch-eting up of INDCs and suggest sectors with untapped abatement potentials. The participation of eight state-of-the-art models enhances the robustness of results and provides an estimation of the uncertainties of future emission projections and policy costs.
Our results indicate that the INDCs pledged under the Paris Agreement induce substantial emission reduc-tions, getting to 53.7 (48.8–56.6) GtCO2eq in 2030. However, we find that this effort is not adequate to put the world on a 1.5◦C or even a well below 2◦C emissions path. By keeping the ambition of post-2030 climate policies equal to the effort required for mov-ing from the Cancun to the INDCs emission levels, the temperature increase by the end of the century com-pared to pre-industrial levels would reach on average
2.6◦C. Significant ratcheting up of INDC aspirations is required in order to put the world on track for a well below 2◦C or even 1.5◦C stabilization. In 2030, additional emission reductions of 15.6 (9.0–20.3) and 24.6 (18.5–29.0) GtCO2eq respectively would be con-sistent with the 2◦C and 1.5◦C cost-optimal emission trajectories.
We find that all sectors can further contribute to an increased mitigation effort even after the implemen-tation of INDCs. The decarbonization of the power supply sector accounts for more than half of total emission reductions in all scenarios and is primarily achieved through the intensive deployment of renew-able power technologies. Efforts for a zero-carbon power supply are crucial for the global short- to medium-term mitigation efforts while carbon lock-in investment decisions between now and 2030 would put these efforts at risk. Demand-side emission reduc-tions contribute less to the INDC mitigation effort but become more crucial for the climate stabilization scenarios, where deep emission reductions in indus-try become important from 2030 onwards. Indusindus-try is found to have the largest energy saving potential, as it contributes close to 45% of total final energy reductions in the climate stabilization scenarios. Sector-specific measures could further increase the available demand-side potential. Overall, a deeper transformation of the energy system remains a challenge that can be addressed with more ambitious climate policies in order to keep with the Paris goal of ‘well below 2◦C’.
The assessment of the macroeconomic cost of the low carbon transformation shows that global annual GDP growth rates are only marginally reduced by the climate stabilization action and even less so by the INDC implementation. Interestingly, the fragmented mitigation action commissioned under the Paris Agree-ment is found to have the same average abateAgree-ment cost (the ratio of GDP losses to GHG reductions rel-ative to reference) with a global, common mitigation action for achieving a ‘well below 2◦C’ climate stabi-lization, thus indicating its inefficient burden sharing. On a regional level, the highest costs in all scenarios are seen in the fossil fuel exporting regions, making the diversification of their economies towards alternative economic activities and the gradual decarbonization of their energy systems pivotal in order to avoid sig-nificant adverse economic impacts. In the 2◦C and 1.5◦C scenarios, emerging economies take up the biggest mitigation efforts and face the highest eco-nomic costs. Cooperation mechanisms, coordinated financing schemes, technology transfer and capacity building, as foreseen in Article 6 of the Paris Agreement, could alleviate the disproportionate costs while still aim for a cost-effective mitigation.
A further advancement of the work presented in this paper could include a detailed mitigation analysis along with an integrated assessment of avoided dam-ages of climate change and the potential co-benefits of the adjacent climate policies.
A
B
C
Figure 8. Regional allocation of GDP costs in 2030: GDP losses in relation to total CO2reductions, both as % change from reference. The size of each bubble shows the share of each region in global GDP losses and is indexed to the size of maximum and minimum values as indicated in the graph (AIM/CGE;Brazil and IMACLIM;China). (a) INDC scenario, (b) 2◦C scenario, (c) 1.5◦C scenario.
Acknowledgments
The research leading to these results has received fund-ing from the European Union’s Seventh Programme FP7/2007-2013 under grant agreement no. 308329 (ADVANCE). The views expressed are purely those of the authors and may not in any circumstances be regarded as stating an official position of the European Commission.
ORCID iDs
Zoi Vrontisi https://orcid.org/0000-0003-3767-0617
Lara Alelui Reisa https://orcid.org/0000-0002-6676-7007
Christoph Bertram https://orcid.org/0000-0002-0933-4395
Shinichiro Fujimori https://orcid.org/0000-0001-7897-1796
Celine Guivarch https://orcid.org/0000-0002-9405-256X
Elmar Kriegler https://orcid.org/0000-0002-3307-2647
References
Aldy J et al 2016 Economic tools to promote transparency and comparability in the Paris Agreement Nat. Clim. Change6
1000–4
Blanford G J, Kriegler E and Tavoni M 2014 Clim. Change 123 383 Cointe B, Ravon P-A and Gu´erin E 2011 2◦C: The History of a
Policy-Science Nexus, Working papers N◦19/11 (Paris: IDDRI) p 28
den Elzen M G J, Hof A F, Mendoza Beltran A, Grassi G, Roelfsema M, van Ruijven B, van Ruijven J and van Vuuren D P 2011 The Copenhagen accord: abatement costs and carbon prices resulting from the submissions Environ. Sci. Policy14 28–39
den Elzen M G J, Admiraal A, Roelfsema M, van Soest H, Hof A F and Forsell N 2016 Contribution of the G20 economies to the global impact of the Paris agreement climate proposals Clim. Change137 655–65
Fujimori S, Su X, Liu J Y, Hasegawa T, Takahashi K, Masui T and Takimi M 2016 Implication of Paris Agreement in the context of long-term climate mitigation goals Springer Plus5
2193–1801
Fujimori S, Kubota I, Dai H, Takahashi K, Hasegawa T, Liu J, Hijioka Y, Masui T and Takimi M 2016 b Will international emissions trading help achieve the objectives of the Paris Agreement? Environ. Res. Lett.11 104001
IEA 2015 Energy and climate change World Energy Outlook Special Report (Paris: IEA)
IPCC 2014 Climate change 2014: synthesis report Contribution of Working Groups I, II and III to the Fifth Assessment Report of the Intergovernmental Panel on Climate Change (Geneva: IPCC)
Iyer G C, Edmonds J A, Fawcett A A, Hultman N E, Alsalam J, Asrar G R, Calvin K V, Clarke L E, Creason J and Jeong M 2015 The contribution of Paris to limit global warming to 2 C. Environ. Res. Lett.10 125002
Jaeger C and Jaeger J 2010 Three views of two degrees Clim. Change Econ.1 145–66
Knopf B, Kowarch M, Flachsland C and Edenhoffer O 2012 The 2◦C target reconsidered Climate Change, Justice and Sustainability (Berlin: Springer) pp 121–37
Knutti R, Rogelj J, Sedlacek J and Fischer E 2016 A scientific critique of the two-degree climate change target Nat. Geosci.9
13–18
Kriegler E et al 2013 What does the 2◦C target imply for a global climate agreement in 2020? The LIMITS study on Durban platform scenarios Clim. Change Econ. 2013 04
Labat A, Kitous A, Perry M, Saveyn B, Vandyck T and Vrontisi Z 2015 GECO2015. Global Energy and Climate Outlook. Road to Paris. JRC Scientific and Policy Reports, EUR 27239 EN Lennert F and Schoenduwe R 2017 Disrupting Mobility: Impacts of
Sharing Economy and Innovative Transportation on Cities (Berlin: Springer)
Luderer G, Bertram C, Calvin K, De Cian E and Kriegler E 2016 Implications of weak near-term climate policies on long-term mitigation pathways Clim. Change136 127–40
Luderer G et al in review Residual fossil CO2determining carbon dioxide removal requirements in 1.5◦C –2◦C Pathways Nat. Clim. Change
Meinshausen M, Raper S C B and Wigley T M L 2011 Emulating coupled atmosphere-ocean and carbon cycle models with a simpler model, MAGICC6—Part 1: model description and calibration Atmos. Chem. Phys.11 1417–56
Paltsev S and Capros P 2013 Cost concepts for climate change mitigation Clim. Change Econ. 4 1340003
Peterson E, Schleich J and Duscha V 2011 Environmental and economic effects of the Copenhagen pledges and more ambitious emission reduction targets Energy Policy39
3697–708
Raupach M, Davis S, Peters G, Andrew R, Canadell J, Ciais P, Friedlingstein P, Jotzo F, van Vuuren D and Le Quere C 2014 Sharing a quota on cumulative carbon emissions Nat. Clim. Change4
Riahi K et al 2015 Locked into Copenhagen pledges — Implications of short-term emission targets for the cost and feasibility of long-term climate goals Technol. Forecast. Soc. Change90 8–23
Ricci O and Selosse S 2013 A cost analysis of the Copenhagen emission reduction pledges Working paper 2013-01-08, Chaire modelisation prospective au service du développement durable (Les Cahiers de la Chaire) p 12
Rogelj J, Hare W, Chen C and Meinshausen M 2011 Discrepancies in historical emissions point to a wider 2020 gap between 2◦C benchmarks and aggregated national mitigation pledges Environ. Res. Lett.6 024002
Rogelj J, Luderer G, Pietzcker R, Kriegler E, Schaeffer M, Krey V and Riahi K 2015 Energy system transformations for limiting end-of-century warming to below 1.5◦C Nat. Clim. Change 5 519–527
Rogelj J, den Elzen M, H¨ohne N, Fransen T, Fekete H, Winkler H, Schaeffer R, Sha F, Riahi K and Meinshausen M 2016 Paris Agreement climate proposals need a boost to keep warming well below 2◦C Nature534 631–9
Rogelj J, Fricko O, Meinshausen M, Krey V, Zilliacus J and Riahi K 2017 Understanding the origin of Paris Agreement emission uncertainties Nat. Commun.8 15748
Robiou du Pont Y, Jeffery M, Gutschow J, Rogelj J, Christoff P and Meinshausen M 2017 Equitable mitigation to achieve the Paris Agreement goals Nat. Clim. Change7 38–43
Saveyn B, Van Regemorter D and Ciscar J C 2011 Economic analysis of the climate pledges of the Copenhagen accord for the EU and other major countries Energy Econ.33 S34–40
Smith J B et al 2009 Assessing dangerous climate change through an update of the Intergovernmental Panel on Climate Change (IPCC) reasons for concern Proc. Natl Acad. Sci. 106 4133–7 Smith P et al 2014 Climate change 2014: mitigation of climate
change Contribution of Working Group III to the Fifth Assessment Report of the Intergovernmental Panel on Climate Change ed O Edenhofer et al (Cambridge: Cambridge University Press) pp 811–922
Spencer T, Pierfederici R, Waisman H and Colombier M 2015 Beyond the Numbers: Understanding the Transformation Induced by INDCs, Study N◦05/15 (Paris: IDDRI–MILES Project Consortium) p 80
UNEP 2010 The emissions gap report: Are the Copenhagen Accord pledges sufficient to limit global warming to 2◦C or 1:5◦C?
UNEP 2015 The Emissions Gap Report 2015 (Nairobi: United Nations Environment Programme)
UNEP 2016 The Emissions Gap Report 2016 (Nairobi: United Nations Environment Programme)
UNFCCC 2010 Compilation of pledges for emission reductions and related assumptions provided by parties to date and the associated emission reductions Note by the Secretariat, FCCC/KP/AWG/2010/INF.1
UNFCCC 2015 Synthesis report on the aggregate effect of the intended nationally determined contribution
UNFCCC 2016 Synthesis report on the aggregate effect of intended nationally determined contributions
van Vliet J, van den Berg M, Schaeffer M, van Vuuren D, den Elzen M, Hof A, Beltran A and Meinshausen M 2012 Copenhagen Accord Pledges imply higher costs for staying below 2◦C warming Clim. Change 113 551–561
Vandyck T, Keramidas K, Saveyn B, Kitous A and Vrontisi Z 2016 A global stocktake of the Paris pledges: implications for energy systems and economy Glob. Environ. Change41 46–63
Weyant J 1999 The costs of the Kyoto protocol: a multi-model evaluation Energy J. 20 1–390
World Bank 2012 Turn Down the Heat: Why a 4◦C Warmer World Must be Avoided (Washington, DC: The World Bank)