1 SUPPLEMENTARY MATERIAL
9,10-Dihydro-5-hydroxy-2,3,6-trimethoxyphenanthrene-1,4-dione: a new dihydrophenanthrene from commercial Cannabis and its effect on zebrafish larval behaviour
Arjun H. Banskota*, Roumiana Stefanova, Joseph P.M. Hui, Fabrice Berrué, John C. Achenbach, Lee Ellis
Aquatic and Crop Resource Development Research Centre, National Research
Council, 1411 Oxford Street, Halifax, Nova Scotia, B3H 3Z1, Canada
Abstract: A new dihydrophenanthrene derivative namely
9,10-dihydro-5-hydroxy-2, 3,6-trimethoxyphenanthrene-1,4-dione (1) was isolated from commercial cannabis product together with 4,5-dihydroxy-2,3,6-trimethoxy-9,10-dihydrophenanthrene (2), 4-hydroxy-2,3,6,7-tetramethoxy-9,10-dihydrophenanthrene (3), combretastatin B-2 (4) and isocannbispiradienone (5). Structure elucidation of the isolated compounds were done based on the interpretation of the mass spectrometry (MS) and nuclear magnetic resonance (NMR) data. New dihydrophenanthrene derivative (1) was tested for its effect on zebrafish larval behaviour. Preliminary results suggested that the new dihydrophenanthrene derivative (1) exhibits similar effect on zebrafish larval behaviour as cannabidiol (CBD), a biologically active component of Cannabis.
Keywords: Cannabis; phenolics; dihydrophenanthrene, Cannabis sativa,
2 Experimental
1. General
NMR spectra were measured on Bruker 700 MHz spectrometer with deuterated solvents. Both analytical and preparative HPLC were carried out on an Agilent 1200 Series HPLC equipped with a diode array detector or the HPLC coupled with 6100B Series Single Quadrupole LC/MS systems for LCMS analysis. High resolution mass spectra were recorded with a Thermo Fisher Scientific (Waltham, MA) Exactive Mass Spectrometer.
2. Cannabis
Commercial Cannabis (AltaVie™, MedReleaf Corp., Lot: 7060613763446402) product was purchased from Nova Scotia Liquor Corporation (NSLC), February 2019. The label of the product indicated that the total THC and CBD contains were 4.12 and 6.88%, respectively.
3. Extraction
Dry cannabis sample (27.2 g) was grinded into powder using coffee grinder. The powdered biomass was extracted with hexane (250 mL x 2) by stirring at room temperature for 1 hour followed by sonication for 15 minutes. The residue was separated by filtration and the solvent was evaporated under reduced pressure to yield hexane extract (4.0 g). The hexane extract was stored at -20°C until further
investigation.
4. Isolation of phenolic compounds from hexane extract
Hexane extract (4.0 g) was suspended into MeOH (50 mL), the precipitate, mostly fatty acids (0.2 g) was removed by centrifugation at 4000 rpm for 20 min. The MeOH
3
soluble part of the hexane extract was used for Combi-Flash chromatography using C-18 Cartridge (240 g RediSep Teledyno Isco Inc, USA) after making slurry with CC-18 reversed phase silica gel (10 g). The column was eluted with 0.2% formic acid (A) in water / 5% MeOH and CH3CN (B) with a gradient [0-15 min B:25-75%; 15-30 min
B-75%; 30-45 min B:75-100%; 46-70 min MeOH/CH3CN (1:1), flow rate 50
mL/min, collection 25 ml/fraction]. Phenolic compounds were dominant in the first 45 fractions (25 mL/fraction) eluting before 20 minutes (Figure S1). Fractions 30-35 (7.2 mg) and Fractions 41-45 (16.6 mg) were pooled together and subjected to a semi-preparative HPLC on an Agilent 1200 series HPLC coupled with diode detector using a NOVA Pack C18 column (5m, 7.75 × 250 mm) eluting with 0.2% formic acid in H2O/ACN/MeOH gradient (90:5:5 at 0 min to 75:20:5 at 15 min) with a flow rate of 3
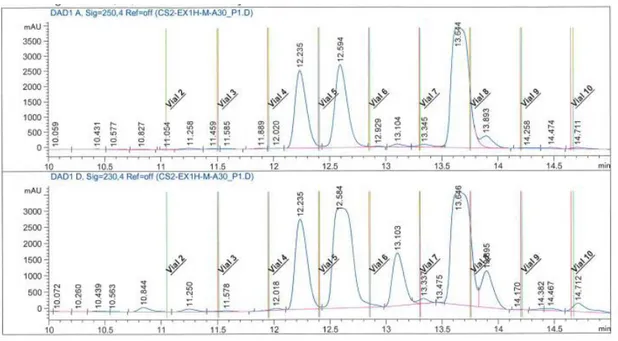
mL/min. Fractions 30-35 yielded isocannabispralieone (5, 0.62 mg), combretastatin B-2 (4, 0.63) and compound 1 (1.82 mg) eluting at 12.2, 13.10 and 13.6 minutes, respectively. The peak eluting at 12.6 min shown to be a mixture of phenolic compounds (Figure S3). Similarly, semi-preparative HPLC purification of fractions 41-45 using the same method yielded compound 1 (0.20 mg), 4,5-dihydroxy-2,3,6-trimethoxy-9,10-dihydrophenanthrene (2, 0.80 mg) and
4-hydroxy-2,3,6,7-tetramethoxy-9,10-dihydrophenanthrene (3, 0.19 mg) eluting at 13.6, 15.3 and 15.6 minutes, respectively. The peaks eluting at 14.6 min was shown to be a mixture of phenolic compounds while the two peaks eluting at 16.6 min and 17.1 min were mixture of cannabinoids (Figure S4).
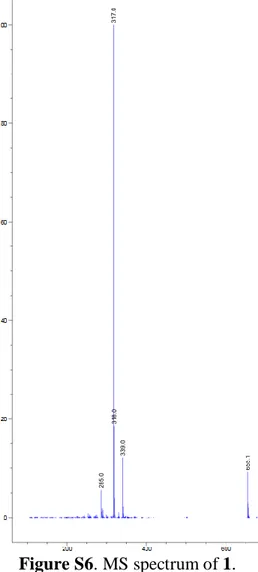
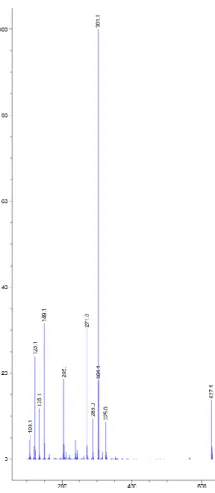
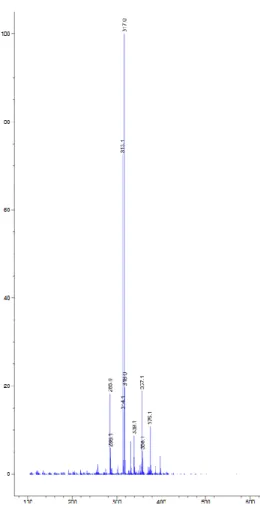
1: Dark orange powder; UV (λmax) 224, 256 and 337nm; MS (ESI in positive mode)
m/z 339 (M + Na)+, 317 (M + H )+; HRESIMS 317.1021 calcd for C17H17O6 (M+H)+
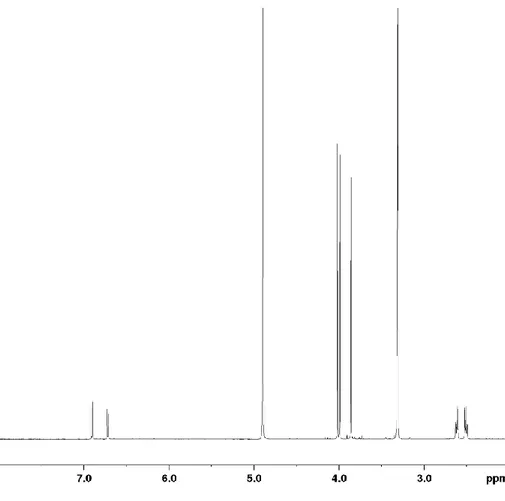
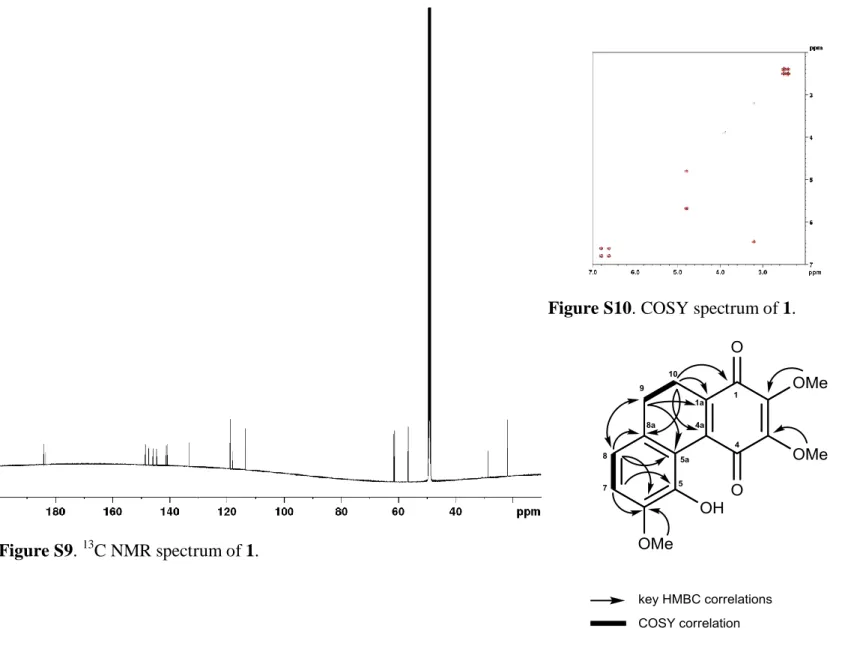
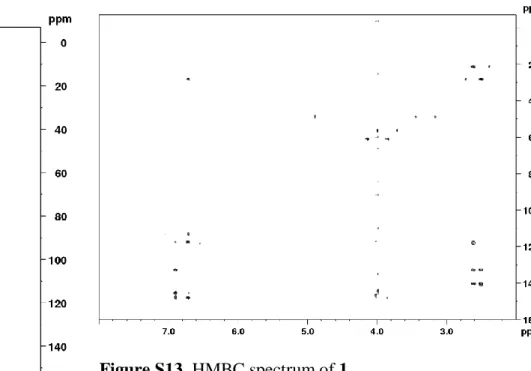
317.1025. The 1H and 13C NMR data are presented in Table S1 and spectra are shown in Figures S5-S10, S12 and S13.
4
Compounds 2-5: 1H NMR spectrum and MS spectrum are shown in Fifure S14-S21.
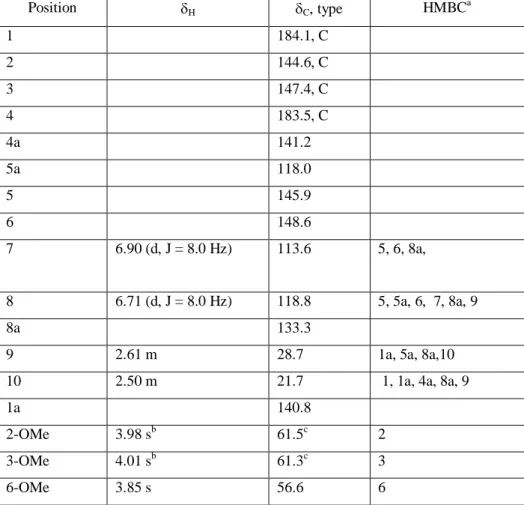
Table S1. 1H (700 MHz) and 13C NMR (175 MHz) data of 1 in CD3OD.
Position H C, type HMBC a 1 184.1, C 2 144.6, C 3 147.4, C 4 183.5, C 4a 141.2 5a 118.0 5 145.9 6 148.6 7 6.90 (d, J = 8.0 Hz) 113.6 5, 6, 8a, 8 6.71 (d, J = 8.0 Hz) 118.8 5, 5a, 6, 7, 8a, 9 8a 133.3
9 2.61 m 28.7 1a, 5a, 8a,10
10 2.50 m 21.7 1, 1a, 4a, 8a, 9
1a 140.8
2-OMe 3.98 sb 61.5c 2
3-OMe 4.01 sb 61.3c 3
6-OMe 3.85 s 56.6 6
a 1
H correlating with 13C resonance. b,c may interchange within same column.
5. Larval zebrafish hehavioral assay
All larvae were derived from breeding AB/Tub hybrid wild-type zebrafish housed following Canadian Council for Animal Care (CCAC) guidelines in a ZebTec recirculating water aquaria system (Tecniplast USA, Exton, PA). The aquaria was kept at a constant 28.5 °C under a 14 h light: 10 h dark lighting cycle.
The larval zebrafish behavioral assay was performed as described previously by Achenbach J. C. et al. (Zebrafish 2018, 15(4): 349- 360). Briefly, at 120 hours post
5
fertilization (hpf) larval zebrafish were transferred to a 96-well polystyrene microtiter plate with one larvae transferred to each well in 270 µL of HE3 media (5 mM NaCl, 0.17 mM KCl, 0.33mM CaCl2-2H2O, 0.33 mM MgSO4-7H2O, 10 mM HEPES, pH
7.2) using a micropipette. Larvae were allowed to acclimate to the plate for at least two hours in a lighted 28.5°C incubator (photon flux: 3-5 µmol s-1 m-2).
For each experimental replicate 30 µL of a 10x solution of test chemical was pipetted into each well using an electronic repeat pipette starting with the lowest concentration of the test compounds and finishing with the highest concentration. The % methanol present in every exposure concentration tested was held at 0.5% (v/v). For each experimental replicate 12 wells were tested with the same concentration of test chemical. After addition of test chemical the plate was immediately placed into a Noldus Daniovision Instrument (Noldus Instruments, Leesburg, VA, USA) and the behavioural assay started. Total elapsed time between addition of test chemical and starting the behavioural assay was kept to 3-4 minutes. The temperature was maintained at 29°C within the Noldus instrument for the duration of the assay.
All behavioural assays consisted of a basal activity measurement for 1.5 h with an approximate irradiance of 18 µmol s-1 m-2 followed by a series of three 5min dark periods separated by a 5min period of light (also 18 µmol µmol s-1 m-2). Following the experiment, larval phenotypes were assayed visually to verify that no lethal endpoints were reached during the assay. Any dead or affected larvae were removed from the analysis.
6
The activity level was assessed by measuring the total distance travelled of each larvae within 60 s bins using the Noldus Daniovision Behavioural Tracking Software (Noldus Instruments, Leesburg, VA, USA). At least three experimental replicates were done for every concentration of test chemical assayed. In the behavioural analysis every embryo was considered as an independent measurement so n ≥36 for every concentration of chemical tested. The statistical significance of total distance travelled for each chemical concentration tested as compared to the carrier control within each 60 s time bin was determined by two-way repeated measures ANOVA using the GraphPad Prism 7.04 software (La Jolla, California) followed by a Bonferroni post-hoc test (p < 0.05).
7
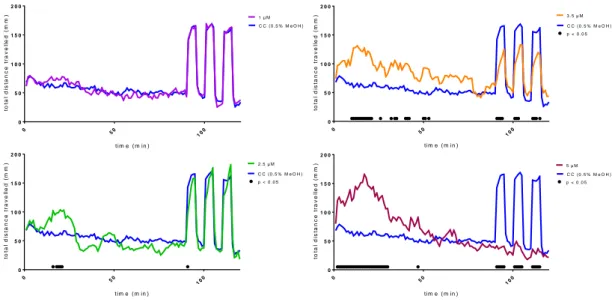
Figure S1: Combi-Flash chromatogram of MeOH soluble part of hexane extract at 250 nm. 0 50 100 0 5 0 1 0 0 1 5 0 2 0 0 t im e ( m in ) to ta l d is ta n c e t ra v e ll e d ( m m ) C C ( 0 .5 % M e O H ) 1 µ M 0 50 100 0 5 0 1 0 0 1 5 0 2 0 0 t im e ( m in ) to ta l d is ta n c e t ra v e ll e d ( m m ) C C ( 0 .5 % M e O H ) 2 .5 µ M p < 0 .0 5 0 50 10 0 0 5 0 1 0 0 1 5 0 2 0 0 t im e ( m in ) to ta l d is ta n c e t ra v e ll e d ( m m ) C C ( 0 .5 % M e O H ) 3 .5 µ M p < 0 .0 5 0 50 100 0 5 0 1 0 0 1 5 0 2 0 0 t im e ( m in ) to ta l d is ta n c e t ra v e ll e d ( m m ) C C ( 0 .5 % M e O H ) 5 µ M p < 0 .0 5
Figure S2. Acute larval zebrafish locomotor activity assayed with varying exposure concentrations (1, 2.5, 3.5, and 5µM) of dihydrophenanthrene derivative (1). Total distance travelled following addition of 1 or carrier control (CC). Larvae are under lighted conditions for the first 1.5 h of exposure followed by three cycles of 5 min dark – 5 min photo periods. A black dot above the x-axis indicates a statistical significance between the total distance travelled by the larva in the test and carrier control exposures during that 60 s time bin as determined by two-way ANOVA followed by a Bonferroni multiple comparisons test (p < 0.05).
8
Figure S3: HPLC chromatogram of fraction 30-35 at 250 nm (top) and 230 nm (bottom).
Figure S4: HPLC chromatogram of fraction 41-45 at 250 nm (top) and 230 nm (bottom).
9
10 Figure S7. HRMS spectrum of 1.
11 Figure S9. 13C NMR spectrum of 1.
Figure S10. COSY spectrum of 1.
12 Figure S12. HSQC spectrum of 1.
13 Figure S14. 1H NMR spectrum of 2.
14
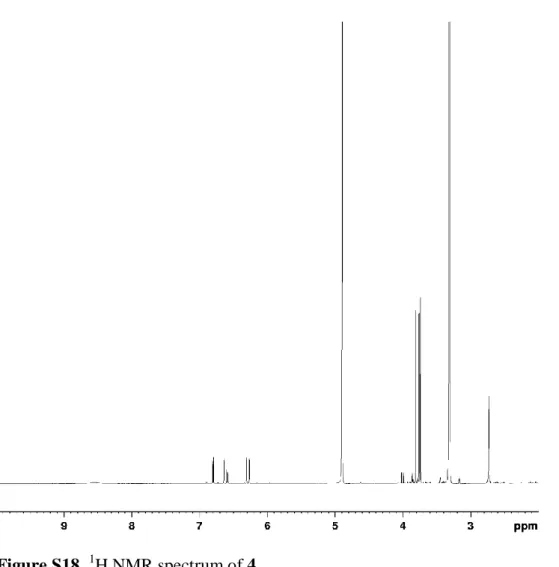
15 Figure S18. 1H NMR spectrum of 4.
16 Figure S20. 1H NMR spectrum of 5.