HAL Id: cea-02438710
https://hal-cea.archives-ouvertes.fr/cea-02438710
Submitted on 27 Feb 2020HAL is a multi-disciplinary open access archive for the deposit and dissemination of sci-entific research documents, whether they are pub-lished or not. The documents may come from teaching and research institutions in France or abroad, or from public or private research centers.
L’archive ouverte pluridisciplinaire HAL, est destinée au dépôt et à la diffusion de documents scientifiques de niveau recherche, publiés ou non, émanant des établissements d’enseignement et de recherche français ou étrangers, des laboratoires publics ou privés.
Pressure Vessel modelling approach and experimental
results on intermediate break LOCAs of ROSA 2
program
S. Carnevali, P. Bazin
To cite this version:
S. Carnevali, P. Bazin. Comparison of CATHARE code using a 3D Reactor Pressure Vessel modelling approach and experimental results on intermediate break LOCAs of ROSA 2 program. NUTHOS-11 - The 11th International Topical Meeting on Nuclear Reactor Thermal Hydraulics, Operation and Safety, Oct 2016, Gyeongju, South Korea. �cea-02438710�
1/11
Comparison of CATHARE code using a 3D Reactor Pressure Vessel
modelling approach and experimental results on intermediate break
LOCAs of ROSA 2 program
Sofia CARNEVALI
CEA, France Gif-sur-Yvette, 91191, France sofia.carnevali@cea.frPascal BAZIN
CEA, France Grenoble, France pascal.bazin@cea.frABSTRACT
The CATHARE code is a thermal-hydraulic code employed by several countries in the world as reference tool to study incidental and accidental transients in nuclear power plants. The CEA (Commissariat à l’Energie Atomique et aux Energies renouvelables Alternatives), in collaboration with its French nuclear partners (AREVA NP, EDF and IRSN) in France, develops and validates this code to increase its predictive capabilities. A particular attention is focused today to validate the 3D model for the entire Reactor Pressure Vessel component during a IBLOCA transient. Several 3D phenomena take place in this element and they cannot be realistically predicted using a simple 1D/0D approach. Asymmetrical liquid flow repartitions, and counter current phenomena are some examples. The OECD/ROSA-2 program is here chosen to validate and demonstrate the enhanced prediction capability of CATHARE tool by modelling the entire Reactor Pressure Vessel of the Japanese LSTF facility using one only 3D component. Tests 1, 2 and 7 are selected to this work, corresponding to different intermediate break LOCAs (13% and 17% sizes into hot and cold legs). Comparison with experimental results shows an improvement of global system response by using a 3D approach for the entire Reactor Pressure Vessel instead of a corresponding 1D/0D. In particular the upper plenum and the core voiding are very well predicted and the global pressure trend is better foreseen. The same trend is observed for the three tests. This study shows the important role of the 3D phenomena prediction to the understanding of global system response. A clear improvement using a 3D approach to represent the entire Reactor Pressure Vessel suggests the necessity to follow this way and to carry on with the 3D method to study the integral systems.
KEYWORDS
3D APPROACH, REACTOR PRESSURE VESSEL, ROSA2 PROGRAM, CATHARE CODE
1. INTRODUCTION
The OECD/NEA ROSA-2 Project aimed to investigate and solve issues in thermal-hydraulic analysis relevant for PWR reactors, focusing the attention on Intermediate Break Loss Of Coolant Accidents. A total of 7 experiments is realized in the ROSA/LSTF facility [1] operated by the Japan Atomic Energy Agency (JAEA). Among these, three were devoted to the Intermediate Break Loss Of Coolant Accident (IBLOCA).
2/11
CATHARE 2_3 code [2] using a classical 1D-0D approach and an improved 3D approach to represent the entire Reactor Pressure Vessel (RPV).
2. OECD/ROSA 2 PROGRAM AND LSTF FACILITY
The ROSA-LSTF (Large Scale Test Facility) is located in Japan and it was constructed to simulate the full-scale height and 1/48 volumetrically scaled-down reactor of a Westinghouse four-loop PWR with a thermal power of 3423 MW [1].
Fig. 1 shows the primary loop of LSTF facility, made up of two loops, two steam generators, a pressurizer and ECCS located in both intact and broken loops. Pressurizer is located in the intact loop.
Fig. 1: ROSA/LSTF Facility.
A total of seven tests is performed but only three tests deal with safety issues during an intermediate break loss-of-coolant accident. A more accurate description of these three tests will be presented below but the main features are synthetized in Table 1. As presented in the table, tests are performed changing the inner diameter (break section) and the position (Hot or Cold Leg) to simulate the break flow through the broken PZR surge line piping (Hot Leg) or through the broken ECCS piping (Cold Leg) [3], [4], [5].
Table 1: IBLOCA tests during ROSA 2 Program.
Test n° Break size (%) Break diam (mm) Break position Test period (s)
1 17 41 Hot Leg 600
2 17 41 Cold leg 500
7 13 36 Cold leg 1000
3. CATHARE 2 CODE
CATHARE 2 [2] is an advanced best estimate code used for safety analyses, accident management, definition of plant operating procedures and for research and development. The code is developed in France by a collaboration between the Commissariat à l'Énergie Atomique (CEA), Électricité De France (EDF), AREVA and Institut de Radioprotection et de Sûreté Nucléaire (IRSN).
The two-phase flows are described using a two-fluid six-equation model and the presence of one to four non-condensable gases can be taken into account. CATHARE 2 can model any water-cooled reactor or test facility using several available modules (0D, 1D and 3D modules).
3/11
3.1. Main Characteristics
The main purpose of the 3D module of the CATHARE 2 code is the representation of large scale thermal-hydraulic 3D effects in nuclear power plants. In particular the three-dimensional modelling is mainly thought for the RPV component. The 3D module is based on the two-fluid six-equation model [2], [6], [7]. The basic set of equation consists of six thermal-hydraulic differential equations. The mass and energy balance equations are of primary form whereas the momentum equations are of secondary form. The presence of one to four non-condensable gases can be taken into account by adding one to four transport equations as for the 1D module. The numerical choices are finite volume discretization with structured mesh, first order discretization in space and time, staggered spatial mesh and donor cell principle, a semi-implicit scheme is used. Two coordinate options are available: either Cartesian coordinates, or cylindrical coordinates. A qualified set of constitutive relationships is directly extrapolated from those of the 1D element, extended over the three directions and with some specificity: no stratification, nor added mass terms.
3.2. 1D versus 3D Modelling Approach Strategy
The choice to employ a simple 1D/0D modelling or a more complex 3D approach to represent the RPV is due to the specific scenario. In general during a Small break LOCA, 3D phenomena can be negligible and a 1D approach is considered sufficient. For Large break LOCA, important 3D phenomena may occur during the blowdown phase and so a 3D nodalisation is suggested. At the same time a 1D modelling is considered conservative with respect to the core heat up prediction. For the Intermediate break LOCA the situation is so intermediate and 3D phenomena in the core and in the downcomer may have a significant influence. Purpose of this work is the investigation of an optimized nodalisation approach to represent this last transient.
The original idea presented in this paper deals with the substitution of a single 3D module to represents the entire Reactor Pressure Vessel, instead of a 0D-1D approach. This different nodalisation is used to investigate IBLOCA scenarios. Calculated and experimental results may be compared and the 3D module of the CATHARE code finally validated.
3.3. 3D Modelling for the Reactor Pressure Vessel
The modelling of the RPV is realized starting from the reactor plans and the previous 1D-0D nodalisation. Fig. 2 shows the reactor pressure vessel with the corresponding porosities calculated as fluid volume (Vf)/ mesh volume (Vt) in order to take into account the internal structures. Internal structures are so taken into account. A total of 624 meshes are used to describe the entire volume: 26 meshes in vertical direction, 4 in the radial and 6 in the azimuthal one. The 3D nodalisation is chosen starting from the core power distribution. The outer ring describes the downcomer region. The pale blue zone of Fig. 2 represents the core region and the blue one corresponds to the support plate (plate between the upper plenum and the upper head).
The next section rapidly describes the three transients of OECD/ROSA 2 project taken into account to validate this 3D module of CATHARE 2 code.
4/11
Fig. 2: Porosities in the RPV using a 3D modelling.
4. OECD/ROSA 2 PROGRAM TESTS: N°1, N°2, N°7
Transients of the three tests taken into account for the validation of the 3D module of CATHARE 2 for the IBLOCA scenario are hereafter rapidly described. A first comparison between calculated and experimental results is also presented for the system pressure trend.
4.1. Test n°1
The first transient presented in this paper is test n°1 [3] where the double-ended guillotine break (DEGB) of pressurizer (PZR) nozzle is simulated by using a 41.0 mm inner-diameter nozzle. It is upwardly mounted in the hot leg of the broken loop without pressurizer to better represent the break flow through broken pressurizer surge line piping. Before transient beginning, the pressuriser is so isolated to well represent the primary inventory involved in the LOCA transient. Fig. 3 shows the rapidity of the transient. The primary pressure steeply dropped and became lower than steam generator secondary-side pressure in about 55 s. Break flow turned from single-phase liquid to two-phase flow in a few seconds after the break. The upper plenum is completely voided at the same time of the core uncovery. The CCFL occurs at this period due to the important steam velocity at core outlet associated with the important break steam flowrate. Core is rapidly recovered and the loop seal clearing (LSC) induced by steam condensation on accumulator (ACC) coolant, injects into cold legs. The experiment terminates when the core cooling is confirmed after the actuation of the low pressure injection (LPI) system at about 600 s. As shown in Fig. 3, pressure trends calculated using a 1D/0D or a 3D approach are practically the same.
Fig. 3: Pressure trend for test n°1. The black, red and blue lines represent respectively the experimental, 1D and 3D modelling results.
5/11
4.2. Test n°2
This second test [4] represents the double-ended guillotine break (DEGB) of the Emergency Core Cooling Systems (ECCS) nozzle with a 41.0 mm inner-diameter nozzle which is upwardly mounted in the cold leg. Also in this case a fast primary depressurization is observed (Fig. 4). Promptly the primary pressure becomes far lower than steam generator (SG) secondary-side pressure, at about 55 s. Due to the break position the core flowrate remains inversed till the first minimum core liquid level (about 36 s). A first core dry out takes place due to the rapid liquid level drop in the core at about 40 s and a second one is observed at about 47 s. LCS allows to slightly increase the pressure drop in the core but it is not sufficient to completely rewet fuel rods. A 3D behaviour is observed due to the asymmetry of falling liquid distribution. Liquid accumulated in upper plenum, SG U-tube upflow-side and SG inlet plenum before the LCS is controlled by the counter-current flow limiting (CCFL), due to the high velocity vapour flow, causing further decrease in the core liquid level. The HPI system was started almost simultaneously with the core dry out at about 35 s, but was ineffective on the core cooling. The core bottom-up quench started after the initiation of accumulator coolant injection at about 110 s. Just before this injection, the core is so completely uncovered. During the injection period the cold leg A is completely filled by liquid, the cold leg B presents several oscillations due to the break. Moreover during this period a large temperature excursion appeared in the core, which induced actuation of automatic core power decrease to protect the LSTF core at 140 s. No relevant difference between 1D/0D and 3D approach is observed for the system pressure trend as shown in Fig. 4.
Fig. 4: Pressure trend for test n°2. The black, red and blue lines represent respectively the experimental, 1D and 3D modelling results.
4.3. Test n°7
The thirst test [5] represents the double-ended guillotine break (DEGB) of the Emergency Core Cooling Systems (ECCS) nozzle with a 36.0 mm inner-diameter nozzle which is upwardly mounted in the cold leg. Fig. 5 shows the fast depressurisation caused by the break for this last test. A similar behaviour to test n°2 is observed and relevant 3D phenomena are expected. Break flow turned from single-phase liquid to two-phase flow in a very short time after the break. The primary pressure soon becomes far lower than steam generator (SG) secondary-side pressure. The first core dry out takes place due to rapid liquid level drop in the core and a first temperature peak is observed at about 55 s. Liquid accumulated in upper plenum, SG U-tube upflow-side and SG inlet plenum is controlled by counter-current flow limiting (CCFL) due to the high velocity vapour flow, causing decrease in the core liquid level. Just after, the LSC leads to increase the core liquid level and rapidly cools down fuel rods. At about 150 s a second core heat up is obtained corresponding to the initiation of the accumulator injection and a second temperature peak is measured. The HPI systems started before the core dry out, but are ineffective on the core cooling. Fig. 5 shows the important improvement for the system pressure prediction using a 3D model instead of a 1D/0D approach.
6/11
Fig. 5: Pressure trend for test n°7. The black, red and blue lines represent respectively the experimental, 1D and 3D modelling results.
5. MAIN FINDINGS OF THE OECD/ROSA2 TEST SIMULATIONS WITH
CATHARE 2
A general better prediction using the 3D module in comparison with the 1D may be slightly observed starting from pressure trends presented in Fig. 3 to Fig. 5, in particular for test n°7. In this section some specific phenomenon predicted by code will be investigate in more detail and a comparison, when possible, with experimental results will be presented. This analysis will permit to better observe the improvement of the 3D modelling approach and justify future works.
5.1. Bypass in the Downcomer
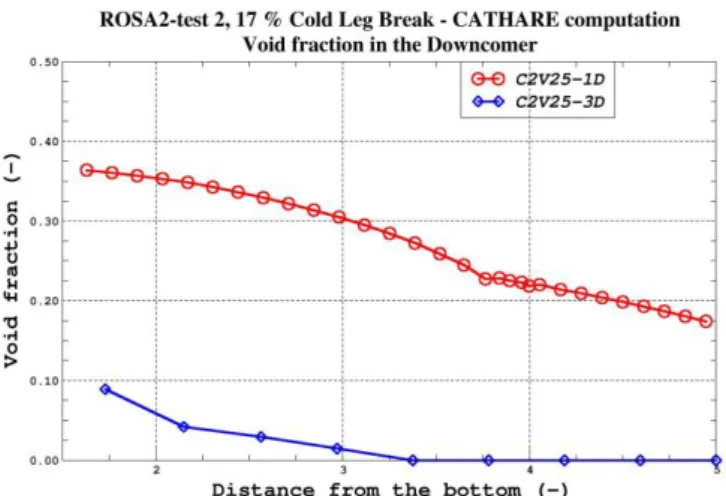
Due to the fast depressurization during the accumulator injection, in tests n°2 and n°7, the flashing and the heat release from the hot walls could have led to a possible downcomer swelling but, actually, this phenomenon is probably prevented by the cold liquid water fall coming from ECCS in cold legs. This phenomenon is not well predicted using a 1D approach and it is necessary to employ a 3D modelling to capture the event. This conclusion is already presented in [9] for test n°7. Results of comparison for test n°2 are shown in Fig. 6. After the accumulator injection at about 110 s, the pressure drop increases in both the experimental and the 3D simulation. It is probably the consequence of a kind of water fall through the annular space that compensates the previous counter current flow (flashing and steam produced by water in contact with hot walls). A different behaviour is predicted by using a 1D model (Fig. 6) where the depressurisation remains important after 110 s, a kind of downcomer bypass due to the counter current flow is wrongly predicted. The same conclusion is reached starting from the void fraction value (Fig. 7). Starting from what previously said, for the 1D approach the void fraction is expected to be high because of the presence of a strong depressurization (Fig. 6). Differently, using a 3D approach, it is suggested that (see Fig. 6) liquid water from accumulators does not bypass the downcomer, contrary it falls down through the volume and a final low void fraction may be supposed. This hypothesis is confirmed by Fig. 7. For test n°2 the void fraction simulated using a 1D element foresees the presence of an important steam flow while with a 3D element, it remains very low.
7/11
Fig. 6: Pressure drop in the lower downcomer for test n°2. The black, red and blue lines represent respectively the experimental, 1D and 3D modelling results.
Fig. 7: Void fraction in the downcomer calculated using a 1D and 3D module at 250 s.
5.2. Upper Plenum Voiding and Core Counter Current Flow
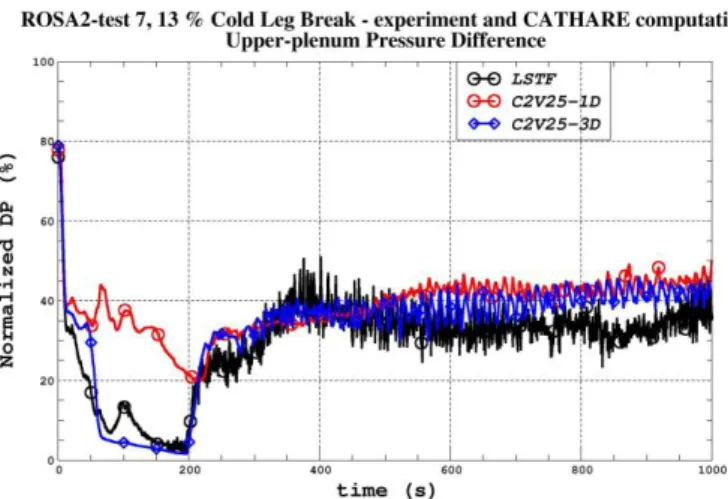
During the experiments the upper section of the vessel is practically empty following the rapid depressurization and consistently with the core dry out. This behaviour is obviously connected to the presence of CCFL or merely counter current flows at the beginning of core dry out in the exit core region. At this time, important temperature cladding peaks are observed corresponding to a quasi-completely void of the core region. Fig. 8 to Fig. 11 show the very good agreement of 3D modelling in comparison with a 1D/0D for test n°2 and n°7. Same behaviour was observed for test n°1 [8]. This is merely because the 3D representation better corresponds to the real configuration. Using a 1D/0D nodalisation the core and the guide tubes are represented by axials elements and the upper plenum as a volume. Junctions are used to connect elements. Figures show that the 1D/0D model is not probably sufficient to well represent the correct behaviour of the fluid. Clearly the CCFL, the liquid/gas velocities in the core exit and the repartition of liquid in the upper plenum are not well predicted using a 1D/0D nodalisation. Contrary, using a 3D approach, all phenomena are well represented.
8/11
Fig. 8: Pressure drop in the upper plenum for test n°2. The black, red and blue lines represent respectively the experimental, 1D and 3D modelling results.
Fig. 9: Pressure drop in the upper plenum for test n°7. The black, red and blue lines represent respectively the experimental, 1D and 3D modelling results.
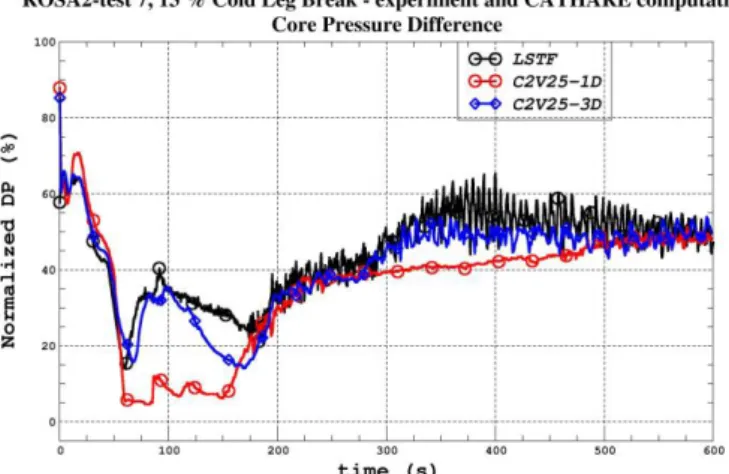
Fig. 10: Pressure drop in the core for test n°2. The black, red and blue lines represent respectively the experimental, 1D and 3D modelling results.
9/11
Fig. 11: Pressure drop in the core for test n°7. The black, red and blue lines represent respectively the experimental, 1D and 3D modelling results.
Let now consider test n°7. It may be supposed, according to the 1D/0D curve of Fig. 11, a constant value of void fraction close to 1 (between 50 s and 150 s), along all the core length. Differently for the 3D where the pressure drop rises at 100 s, a lower void fraction value is expected. Fig. 12 confirms this hypothesis since the void fraction for the 3D is not everywhere equal to 1. In addition note that a gap between the void fraction at the core exit (penultimate point) and in the lower part of the upper plenum (last point) is predicted.
Fig. 12: Void fraction in the core using a 3D model for test n°7 at 50 s, 100 s and 200 s. Curves correspond to three times during the transient. The last point at about x=9 corresponds to the void
fraction calculated in the upper plenum.
Fig. 13 shows liquid and gas flowrates calculated by code at the core exit in the three core rings (I-Internal, M-Medium and E-External), in the 6 azimuthal sectors. A first remark is that, thanks to the 3D modelling, a heterogeneous flow may be observed in the core. Liquid and gas mass flux are different for different azimuthal sectors and radii. Note that hot legs are located just before sector three and six. A second observation is that in the internal and medium ring, both liquid and gas mass flux are positives and everywhere homogenous while for the external ring liquid and gas mass flux are characterised by opposite directions. It means that a kind of central channel where liquid and gas rise, is formed while externally, a higher cross section entails a lower gas velocity and consequently liquid descends. Additionally note that in this internal and medium region a more emphasized liquid difference for the different azimuthal sectors may be observed. A last remark involves the general liquid and gas mass flux trend. Note that an increasing of gas mass flux, as expected, allows to an increase ofabsolute value of liquid mass flux.
10/11
Fig. 13: Liquid and gas mass flux at the core exit calculated from the internal to the external ring for the 6 azimuthal sectors. Results for test n°7 at 100 s.
5.3. Core Maximum Temperatures
For the three tests the maximum cladding temperature is compared with the experimental values. In this test n°7 (see Fig. 14), the overestimation of the Peak Cladding Temperature in the 1D/0D calculation probably mainly results from the underestimation of the core mass inventory (Fig. 11). A future work is in program to fully understand the differences in the cladding temperature predictions. In that frame, it is planned to increase the mesh number used to represent the core. At the moment only nine meshes are employed. Doing that it will be probably possible to better estimate the real liquid level in the core and improve the precision of the temperature measurement in the dry core region.
Fig. 14: Maximum cladding temperature for test n°2. The black, red and blue lines represent respectively the experimental, 1D and 3D modelling results.
6. CONCLUSIONS
The real improvement of the 3D modelling for the entire reactor pressure vessel in comparison with a 1D/0D approach is here presented. The OECD/ROSA2 project is used and in particular test n°1, 2 and 7 are chosen, representing intermediate break LOCA transients with 13% and 17% breaks sizes located in both hot and cold legs. A comparison between experimental and calculated results is here proposed. CATHARE code is suggested to simulate these three scenarios basing on a completely 1D/0D nodalisation and a 3D representation of the Reactor Pressure Vessel. Results show that using the 3D modelling approach a better prediction of global system behaviour is obtained. The complete voiding of the upper plenum during the core heat up is foreseen. A very good prediction of the core dry out is also observed and the correct liquid/gas distribution in the downcomer estimated. This is
11/11
obviously due to the 3D nodalisation itself because closer to the real system description. 3D effects may be so observed and better investigated. Unfortunately no experimental results concerning the real flowrates or void fraction values are given. Anyway since the good agreement of the 3D prediction with experimental results, it may be supposed the coherence with the corresponding values predicted by the code. A further analysis concerning the maximum temperature prediction in the heated cladding will be performed in the future work.
ACKNOWLEDGMENTS
The present work contains findings that are produced within the OECD/NEA ROSA-2 Project. The author is grateful to the Management Board of this project for its consent to this publication. The author is also grateful to the CEA colleagues for their support and help during the experiment analysis and the CATHARE modelling.
REFERENCES
1. The ROSA V Group, ‘ROSA-V Large Scale Test Facility (LSTF) – System description for the third and fourth simulated fuel assembly’, JAERI Tech/2003-037, March (2003).
2. M. Robert, M. Farvacque, M. Parent and B. Faydide, “CATHARE 2 V2.5: a fully validated CATHARE version for applications”, Proceedings of the 10th International Topical Meeting on
Nuclear Reactor Thermal-Hydraulics (NURETH-10), Seoul, Korea, October (2003).
3. The ROSA V Group, ‘Final Data Report of ROSA-2/LSTF Test 1, (Hot Leg Intermediate Break LOCA IB-HL-01)’, September (2011).
4. The ROSA V Group, ‘Final Data Report of ROSA-2/LSTF Test 2, (Cold Leg Intermediate Break LOCA IB-CL-03)’, September (2011).
5. The ROSA V Group, ‘Final Data Report of ROSA-2/LSTF Test 7, (Cold Leg Intermediate Break LOCA IB-CL-05)’, September (2011).
6. I. Dor, C. Morel, P. Bazin and P. Boudier, “Assessment of the CATHARE 3-D module for LBLOCA simulation”, Proceedings of the 11th International Topical Meeting on Nuclear Reactor
Thermal-Hydraulics (NURETH11), Avignon, France, October (2005).
7. I.Dor, M.Chandesris, P.Germain and A. Ruby, “CATHARE 3D module from CATHARE 2 V2.5_3 to CATHARE 3 V1.0“, Proceedings of the 15th International Topical Meeting on Nuclear
Reactor Thermal-Hydraulics, NURETH-15, Pisa, Italy, Mai 12-15, (2013).
8. S. Carnevali, P. Bazin, “Validation of CATHARE code on the 3D ROSA-LSTF pressure vessel”
Proceedings of NURETH 16, Chicago, Augost 30-Septembre 4, Vol. 31, pp. 134-156 (2012).
9. P. Mazgaj, J.L. Vacher, S. Carnevali, “COMPARISON OF CATHARE RESULTS WITH THE EXPERIMENTAL RESULTS OF COLD LEG INTERMEDIATE BREAK LOCA OBTAINED DURING ROSA-2/LSTF TEST 7” Proceedings of ICAPP 2015, Nice, May 03-06, 15442 (2015).